1840 Ribble St · Buena Vista, MI
Flood risk 1/10 · Minimal
- FEMA flood zone
- X (unshaded)
- Chance of flooding over 30 yrs
- 0.0%
- Est. flood insurance / yr
- $507 – $1,088
Fire risk 1/10 · Minimal
- Est. fire insurance / yr
- $784 – $1,456
Heat risk 2/10 · Minimal
- Hot days now (above 98°F)
- 7 days/yr
- Hot days in 30 yrs
- 14 days/yr
Wind risk 1/10 · Minimal
- Chance of severe wind over 30 yrs
- —
Air-quality risk 2/10 · Minimal
- Unhealthy air days now
- 1 days/yr
- Unhealthy air days in 30 yrs
- 2 days/yr
Risk factors via First Street. Map © Google.
Why this score? — see what drove the B grade
The composite is a weighted blend of 9 inputs, each scored 0–100. Each bar is that input's sub-score; the figure is the points it added to the 100-point composite (weight × sub-score).
- Cash flow +30.0/30.0
- ARV discount +15.0/15.0
- 1% rule +10.0/10.0
- DSCR +10.0/10.0
- Livability +3.0/5.0
- Rent growth +2.5/5.0
- Condition / age +2.5/5.0
- Schools +1.0/10.0
- Appreciation +0.0/10.0
$39,500
🖨 Deal sheet 📄 Offer letter ✓ Due diligence
Listing remarks MLS
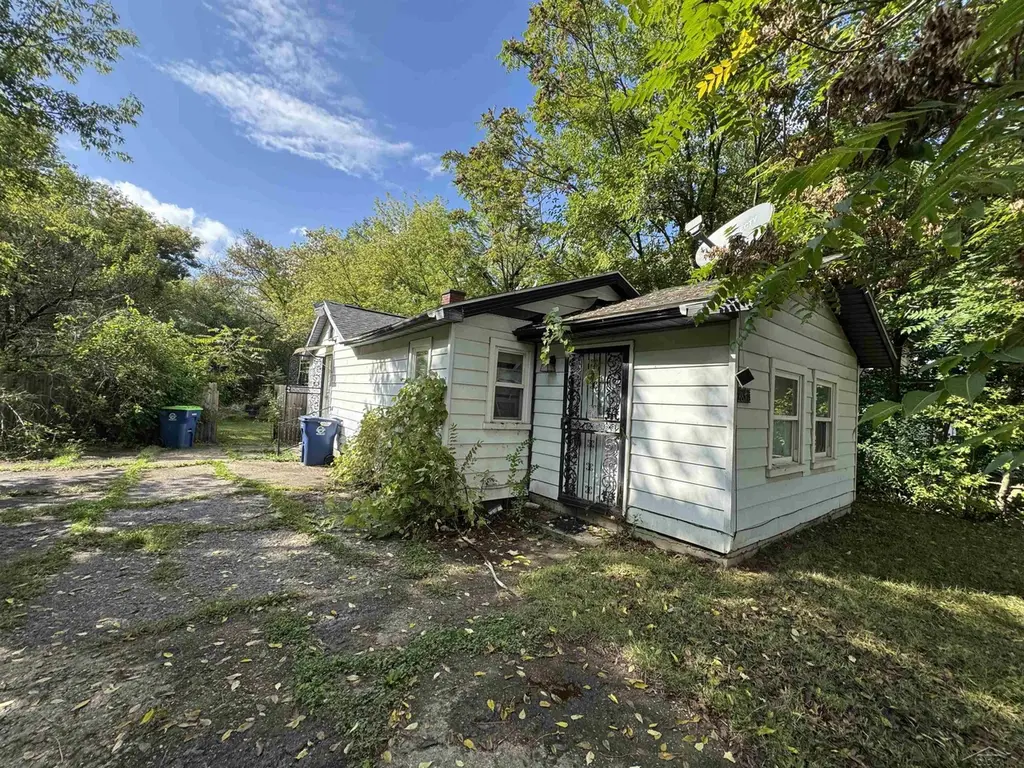
Charming Starter Home or Investment Opportunity! Welcome to this beautifully updated 2-bedroom, 1-bath home featuring fresh paint and stylish new flooring throughout. Enjoy the privacy of a fully fenced yard—perfect for pets, play, or entertaining. Whether you're a first-time homebuyer or savvy investor, this property offers comfort, convenience, and potential. Don’t miss your chance to own this move-in ready gem!
Key facts
- Fully fenced yard
- 8,276 sq ft lot
- Built 1948
Tags
Property features AI
Finance
- Other: Approximately 770 square feet of above-grade finished living area
- HOA & community: Homeowners association present
Exterior
- Utilities: Public water; Public sewer
- Home design: Single-family residence; One story
- Construction: Aluminum siding; Built above grade (living area present); Crawl space foundation
- Exterior features: Paved road access; Lot dimensions approximately 66 x 130 (0.19 acres); Residential zoning
Interior
- Bedrooms: Total of 3 rooms (includes bedrooms and living spaces)
- Bathrooms: 1 full bathroom
- Heating & cooling: Forced air heating (natural gas); Ceiling fan(s) for cooling; Has central heating and cooling
- Interior features: Gas water heater; Crawl space basement
Neighborhood map
What this means for you Summary
Snapshot
- This is a 2-bed/1.0-bath single-family listed at $40k.
Deal economics
- At list price, monthly cash flow is $451 ($5k/yr) — positive.
- The deal already cash-flows at list — no discount required.
- Meets the 1% rule at list price ($898 rent vs $40k).
- Recommended offer: $39k (1.5% below list) — sets the bar for market timing.
- Cap rate 20.0% vs local median 11.7% in Buena Vista — top-decile yield for the area; either an underpriced asset or a hidden risk that comps aren't pricing in. Stress-test before assuming the spread holds.
Location & tenants
- Location reads 59/100 on livability (#615 in MI) — a working-class tenant base; expect higher turnover. Strengths: cost of living A+, housing B+; Watch: health & safety C-, schools F, crime F.
- Bridgeport-Spaulding Community School District (suburban): math 7% / reading 17% proficiency, ranked #513 of 540 in MI (top 95%) — low school quality limits family demand, transient renter base, plan for 1-2y turnover; 75% free/reduced lunch — lower-income household profile, screen leases tightly.
- Market conditions: 199 active listings in the ZIP; 3 comparable units currently listed for rent nearby; rentals lingering (median 44d on market — plan ~5-8 weeks vacancy on turnover, expect pricing pressure); 100% of comp listings sitting > 30 days — soft ceiling on asking rent; 154 units permitted in Saginaw County in 2024 (0 in 5+ unit buildings).
Forward outlook
- Local home prices are declining (-3.0%/yr); year-one equity from $273 of loan paydown is wiped out by about $1k of value loss. Plan a longer hold.
- Saginaw County population projected at -25% by 2050 — secular population decline; favor cash flow + early exit over multi-decade hold.
- At projected returns (-3.0% appreciation + 3.0% rent growth), your $11k cash investment doubles in ~3 years — after that, you're playing with house money.
Negotiation context
- It's been on market 17 days — a 2% lower offer ($39k) is reasonable based on typical stale-listing flexibility.
- 16 sale attempts since 20y ago with the ask held roughly flat each time — persistent listings suggest the price (not the market) is what's stuck; bring a comps-based counter.
- Current owner paid $4k; list at $40k implies a 888% gain — meaningful room to come down on a strong offer.
Risks & watch-outs
- Watch-outs: built in 1948 — expect roof / HVAC / electrical / plumbing capex.
Questions for the listing agent
- Built in 1948 — when were the roof, HVAC, electrical panel, plumbing, and water heater last replaced?
- Is there a deadline driving the sale (1031 exchange, divorce, estate, relocation)? That informs how much negotiation room exists.
- Schools are F-rated, which usually means shorter tenancies and higher turnover. Who's the typical renter profile here, and what's been the actual vacancy rate?
- Crime grade is F in this area — have there been break-ins, vandalism, or insurance claims at this property in the last 3 years? What carrier currently insures it and at what premium?
- What's the average days-on-market for RENTAL listings here right now (not sales)? A rising rental-DOM trend means longer vacancies and softer asking-rent achievability than the comps imply.
- What's the recent tenant-quality profile in this submarket — average credit score on applications, eviction rate, late-payment / NSF rate, and stable-employment percentage? A property-management company in the area should have these aggregated.
- How much new for-sale + rental construction is in the pipeline within 1–3 miles? Heavy new supply typically softens prices + rents 12–24 months out; constrained supply supports both.
Investment metrics
- 1% rule
- 2.27% ✓
- Cap rate
- 20.01%
- Cash-on-cash
- 48.97%
- DSCR
- 3.18
- GRM
- 3.7
CMA / ARV
- ARV (on-the-fly)
- $50,820
- Comps found
- 7
Show comp detail 7 sales within ~0.75 mi
| Address | Dist | Beds/Ba | Sqft | Sold | Price | $/sf | Match |
|---|---|---|---|---|---|---|---|
| 1726 Prospect St | 0.14mi | 3/1.0 (+1) | 864 (+12%) | 6mo | $33,900 | $39 | 64 |
| 5025 Peterson St | 0.25mi | 2/1.0 | 884 (+15%) | 1mo | $29,500 | $33 | 63 |
| 1890 Prospect St | 0.07mi | 3/1.0 (+1) | 864 (+12%) | 14mo | $57,000 | $66 | 59 |
| 1800 Prospect St | 0.08mi | 3/1.0 (+1) | 864 (+12%) | 15mo | $62,000 | $72 | 59 |
| 3446 Chalmers Rd | 0.42mi | 2/1.0 | 720 (-6%) | 14mo | $24,900 | $35 | 57 |
| 1690 Prospect St | 0.17mi | 3/1.0 (+1) | 864 (+12%) | 22mo | $85,000 | $98 | 49 |
| 2837 Longview Ave | 0.71mi | 2/1.0 | 864 (+12%) | 14mo | $89,900 | $104 | 35 |
Match score weights: distance 35% · size 25% · config 20% · recency 20%. Top-matched comps best support the ARV.
Projected returns pro-forma
-3.0% appreciation · 3.0% rent growth · sell at horizon
- IRR
- 46.6%
- Equity multiple
- 3.02×
- Total profit
- $22,351
- Equity at exit
- $5,890
- IRR
- 52.3%
- Equity multiple
- 6.11×
- Total profit
- $56,497
- Equity at exit
- $3,415
Cash invested: $11,060 (down + closing). Projections, not guarantees.
Landlord ↔ Tenant lean methodology
- Overall (STATE)
- 62 Landlord-Friendly
- State Michigan
- 62 Landlord-Friendly · EVEN
- County
- — inherits STATE
- City
- — inherits STATE
ZIP-level market 48601
- Home prices YoY
- -32.1%
- Active inventory
- 199
- Price-to-rent
- 3.7×
Monthly cashflow live
- Estimated rent
- $898 medium interval (Pro) →
- Mortgage (P&I)
- −$207
- Tax from tax record
- −$34 /mo · $409/yr
- Insurance
- −$16
- HOA
- −$0
- Vacancy / Maint / Mgmt
- −$188
- Net cashflow
- $451
Break-even live
UW: 25.0% down · 7.5% · 30yr · 1.5% tax · 5.0% vac · 8.0% maint · 8.0% mgmt
Financing live
Cash to close
- Down payment
- $9,875
- Closing costs
- $1,185
- Reserves months
- —
- Total cash needed
- —
Loan-product check · same deal, 3 products live
Conventional
25% down · 7.5% · 30yr
- Down + closing
- —
- Monthly P&I
- —
- Monthly cashflow
- —
- DSCR
- —
- Eligible?
- —
Personal DTI + credit; lowest rate.
DSCR
20% down · 8.5% · 30yr
- Down + closing
- —
- Monthly P&I
- —
- Monthly cashflow
- —
- DSCR
- —
- Eligible?
- —
No personal income docs; deal must DSCR.
Hard money
10% down · 12.0% · 12mo
- Down + closing
- —
- Monthly P&I
- —
- Monthly cashflow
- —
- DSCR
- —
- Eligible?
- —
Short-term bridge; refi at stabilization.
Rent comps 3 comps
| Address | Beds | Baths | Sqft | Rent | $/sqft | DOM | Units | Dist |
|---|---|---|---|---|---|---|---|---|
| 2800 Gemini St Unit GE2800 Saginaw, MI | 3.0 | 2.0 | 960 | $920 | $0.96 | 43d | 1 | 0.80mi |
| 2564 Apollo Dr Unit AP2564 Saginaw, MI | 3.0 | 2.0 | 960 | $883 | $0.92 | 43d | 1 | 1.03mi |
| 2554 Apollo Dr Unit AP2554 Saginaw, MI | 3.0 | 2.0 | 960 | $883 | $0.92 | 43d | 1 | 1.04mi |
Listing history 13 events
-
2026-06-18days on market $39,500 Active 17 DOM
-
2026-06-17days on market $39,500 Active 16 DOM
-
2026-06-16days on market $39,500 Active 15 DOM
-
2026-06-15days on market $39,500 Active 14 DOM
-
2026-06-13days on market $39,500 Active 12 DOM
-
2026-06-12days on market $39,500 Active 11 DOM
-
2026-06-09days on market $39,500 Active 8 DOM
-
2026-06-08days on market $39,500 Active 7 DOM
-
2026-06-07days on market $39,500 Active 6 DOM
-
2026-06-07days on market $39,500 Active 5 DOM
-
2026-06-04days on market $39,500 Active 2 DOM
-
2026-06-01remarks 418-char remark
-
2026-06-01$39,500 Active 1 DOM
ⓘ Source: listings_history table (triggers on properties + properties_extension) + one-shot
backfill from property_details.listing_events for pre-trigger history.
Tax reassessment forecast MI · Partial reset (capped growth)
- Current annual tax
- $409 · $34/mo
- Projected year-2 tax
- $509 · $42/mo
- Expected delta
- +$99/yr (+$8/mo · 24.3%)
ⓘ Screening estimate from a state-policy table — verify with the county assessor before closing.
Climate risk First Street
- Flood 1/10 Low FEMA zone X (unshaded) · 0% chance over 30 yrs
- Wildfire 1/10 Low
- Heat 2/10 Low 7 d/yr ≥98°F today · 14 d/yr by 30 yrs out
- Wind 1/10 Low
- Air quality 2/10 Low 1 unhealthy d/yr today · 2 by 30 yrs out
Nearby sold comps map
Loading sold comps map…
Walkable amenities ~0.75 mi
Loading nearby amenities…
Taxation est. · year 1
- Rental income
- $10,771
- − Mortgage interest
- −$2,213
- − Property taxes
- −$409
- − Insurance
- −$198
- − Repairs & maintenance
- −$862
- − Management
- −$862
- − Depreciation
- −$1,149
- Taxable income
- $5,079
- Est. tax owed @ 24.0%
- −$1,219
- After-tax cash flow
- $4,197/yr
For passive investors: Depreciation is non-cash, so a rental often shows a tax loss while cash-flowing — sheltering income. Rental losses are passive: they offset passive income freely, and up to $25,000/yr can offset ordinary (W-2) income if you actively participate and your MAGI is under $100k (phasing out to $0 by $150k); unused losses carry forward. On sale, claimed depreciation is recaptured at up to 25%, and gains may owe capital-gains tax (a 1031 exchange can defer both). Figures are a year-1 estimate at your 24.0% rate — not tax advice; consult a CPA.
Schools (NCES district)
- District
- Bridgeport-Spaulding Community School District
- NCES district ID
- 2606780
- Math proficiency
- 7% ▼ -4.00%
- Reading proficiency
- 17% ▼ -5.00%
- Median HH income
- $38,403
- Composite
- 10.13/100
- National rank
- #9800
- State rank
- #513 of 540 in MI
Livability — Buena Vista
- Score
- 59/100
- State rank
- #615
- US rank
- #20603
Category grades
Schools grade is shown separately in the Schools card above.
Census & demographics
- Census place
- Buena Vista, MI
- City population
- 32,069
- Population (ZIP)
- 32,069
Population outlook (Saginaw County) Hauer SSP2
- Today (2025)
- 180,568 people
- By 2030
- 172,302 · -4.6%
- By 2040
- 153,919 · -14.8%
- By 2050
- 135,519 · -24.9%
- By 2075
- 97,199 · -46.2%
- By 2100
- 65,037 · -64.0%
Race, ethnicity, and origin ACS 2023
- Neighborhood character
- Diverse neighborhood (Simpson 0.56)
- Race & ethnicity
- Black 59% White 27% Hispanic / Latino 12% Two or more races 5%
- Hispanic origin (detail)
- Mexican 10%
- Common ancestry
- Romanian 2% Lithuanian 2%
- Foreign-born
- 1% · Canada
- Languages at home
- 96% English-only · Spanish 4%
Political lean MEDSL · Saginaw
- 2024 margin
- Toss-up / Even · D 47.7% · R 51.0% · Other 1.4%
- 2008→2024 swing
- -20.6pp toward R · 2008: 17.3pp · 2024: -3.3pp
- All cycles
- 2024: R+3.3 2020: D+0.3 2016: R+1.1 2012: D+11.9 2008: D+17.3
Not yet ingested
- Civics
- —
Market trends
- HPI YoY
- ▼ -93.46%
- Current HPI
- 197.3359
- Rent YoY
- —
- Metro
- —
- State GDP YoY
- ▲ 1.37%
- F500 in state
- 28
Industry mix (Fortune 500 HQ in MI)
| Industry | F500 HQs | Revenue |
|---|---|---|
| Automotive Parts | 3 | $48B |
|
||
| Automotive | 2 | $372B |
|
||
| Chemicals | 1 | $45B |
|
||
| Automotive Retail | 1 | $29B |
|
||
| Healthcare / Medical Devices | 1 | $23B |
|
||
| Automotive Technology | 1 | $20B |
|
||
Price history
-10.2% since first listed38 events — show timeline
- 2026-06-01 Listed $39,500 REALCOMP
- 2026-05-31 Listed $39,500 MiRealSource-MiMLS
- 2026-04-17 Listing Removed — MiRealSource-MiMLS
- 2026-04-17 Listing Removed — REALCOMP
- 2026-03-17 Listed $45,500 REALCOMP
- 2026-03-16 Listed $45,500 MiRealSource-MiMLS
- 2026-03-11 Listing Removed — REALCOMP
- 2026-03-11 Listing Removed — MiRealSource-MiMLS
- 2026-02-28 Listing Removed — REALCOMP
- 2026-02-28 Listing Removed — MiRealSource-MiMLS
- 2026-02-27 Relisted — MiRealSource-MiMLS
- 2026-02-27 Listed $45,500 REALCOMP
- 2026-02-27 Listed $45,500 MiRealSource-MiMLS
- 2026-02-25 Relisted — REALCOMP
- 2026-02-25 Relisted — MiRealSource-MiMLS
- 2026-02-25 Listing Removed — MiRealSource-MiMLS
- 2026-02-25 Listing Removed — REALCOMP
- 2026-02-25 Listing Removed — MiRealSource-MiMLS
- 2026-02-03 Price Changed $45,500 MiRealSource-MiMLS
- 2026-02-02 Price Changed $45,500 REALCOMP
- 2025-09-26 Listed $47,500 REALCOMP
- 2025-09-25 Listed $47,500 MiRealSource-MiMLS
- 2025-07-01 Listing Removed — MiRealSource-MiMLS
- 2025-07-01 Listing Removed — REALCOMP
- 2025-06-19 Relisted — REALCOMP
- 2025-06-19 Listing Removed — REALCOMP
- 2025-06-11 Price Changed $47,500 MiRealSource-MiMLS
- 2025-06-10 Price Changed $47,500 REALCOMP
- 2025-05-01 Price Changed $49,900 MiRealSource-MiMLS
- 2025-05-01 Price Changed $49,900 REALCOMP
- 2025-03-17 Listed $51,500 REALCOMP
- 2025-03-17 Listed $51,500 MiRealSource-MiMLS
- 2007-04-17 Listing Removed — MiRealSource-MiMLS
- 2007-04-13 Sold (MLS) $4,000 REALCOMP
- 2007-04-13 Sold (MLS) $4,000 MiRealSource-MiMLS
- 2006-12-08 Listed $4,900 REALCOMP
- 2006-12-08 Listed $4,900 MiRealSource-MiMLS
- 2004-10-26 Sold (Public Records) $44,000 Public Records
Property tax history
-5.2%/yrLatest (2025): $409 · -71.2% YoY. Source: county tax records.
Cash-flow waterfall
monthlySold comps — $/sqft
last 12 mo · ≤1 miLoading sold comps…