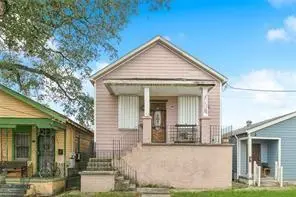
3424 Toledano St · New Orleans, LA
Flood risk 8/10 · Major
- FEMA flood zone
- AE
- Chance of flooding over 30 yrs
- 0.78%
- Est. flood insurance / yr
- $1,737 – $8,500
Fire risk 1/10 · Minimal
- Est. fire insurance / yr
- $1,269 – $2,357
Heat risk 10/10 · Severe
- Hot days now (above 108°F)
- 7 days/yr
- Hot days in 30 yrs
- 21 days/yr
Wind risk 10/10 · Severe
- Chance of severe wind over 30 yrs
- 99.0%
Air-quality risk 3/10 · Minor
- Unhealthy air days now
- 3 days/yr
- Unhealthy air days in 30 yrs
- 4 days/yr
Risk factors via First Street. Map © Google.
Why this score? — see what drove the B- grade
The composite is a weighted blend of 9 inputs, each scored 0–100. Each bar is that input's sub-score; the figure is the points it added to the 100-point composite (weight × sub-score).
- Cash flow +30.0/30.0
- 1% rule +10.0/10.0
- DSCR +10.0/10.0
- ARV discount +7.5/15.0
- Livability +4.0/5.0
- Rent growth +2.7/5.0
- Condition / age +2.5/5.0
- Schools +1.6/10.0
- Appreciation +0.0/10.0
$170,000
🖨 Deal sheet 📄 Offer letter ✓ Due diligence
Listing remarks MLS
This spacious single family home is ready for some TLC. Featuring 3 Bedroom and 2.5 Baths in an open floor plan with a lot of potential.
Key facts
- 3,223 sq ft lot
- Parking
- Built 2007
Property features AI
Finance
- Other: Lot is a city, rectangular lot approximately 30' x 108' (0.074 acres)
Exterior
- Parking: Driveway; Off-street parking
- Security: Smoke detector(s)
- Utilities: Public water; Public sewer; Water heater (energy-efficient)
- Home design: 2-story property; Raised foundation; Property listed in poor condition
- Construction: HardiPlank and concrete construction; Asphalt shingle roof; Built on a raised foundation
- Exterior features: Wood porch; Porch
Interior
- Bathrooms: 2 full bathrooms; 1 half bathroom
- Heating & cooling: Central heating; Central air conditioning
- Interior features: Storm windows; Attic; Ceiling fan(s); Jetted tub; Pull-down attic stairs; Cable TV
Neighborhood map
What this means for you Summary
Snapshot
- This is a 3-bed/2.5-bath single-family listed at $170k.
Deal economics
- At list price, monthly cash flow is $333 ($4k/yr) — positive.
- The deal already cash-flows at list — no discount required.
- Meets the 1% rule at list price ($3k rent vs $170k).
- Recommended offer: $165k (3.0% below list) — sets the bar for market timing.
- Cap rate 11.7% vs local median 4.4% in New Orleans — top-decile yield for the area; either an underpriced asset or a hidden risk that comps aren't pricing in. Stress-test before assuming the spread holds.
Location & tenants
- Location reads 81/100 on livability (#3 in LA, #1,383 nationally) — a professional / high-income tenant draw. Strengths: amenities A+, commute A+, health & safety A+; Watch: crime C-, employment D.
- Orleans Parish (urban): math 11% / reading 27% proficiency, ranked #69 of 98 in LA (top 70%) — low school quality limits family demand, transient renter base, plan for 1-2y turnover; 68% free/reduced lunch — lower-income household profile, screen leases tightly.
- Market conditions: Rents flat; 217 active listings in the ZIP; 40 comparable units currently listed for rent nearby; rentals at typical pace (median 24d on market — plan ~3-4 weeks tenant-placement turnaround); 710 units permitted in Orleans Parish in 2024 (244 in 5+ unit buildings).
- At $2,669/mo this rent would consume 52% of the median local household income ($61k/yr) (locally 1270% of renters already pay >50% of income on rent) — very limited rent-growth headroom before tenants either downsize or default.
Forward outlook
- Local home prices are declining (-3.0%/yr); year-one equity from $1k of loan paydown is wiped out by about $5k of value loss. Plan a longer hold.
- Orleans County population projected at +61% by 2050 — long-run rental-demand tailwind backs the buy-and-hold thesis.
Negotiation context
- It's been on market 42 days — a 3% lower offer ($165k) is reasonable based on typical stale-listing flexibility.
- 3 sale attempts; this cycle's ask has dropped $30k (15%) from the opening price — seller is motivated, your offer sets the floor, not the list.
- Current owner paid $25k; list at $170k implies a 580% gain — meaningful room to come down on a strong offer.
Risks & watch-outs
- Watch-outs: property tax is 2.7% of price; flood insurance adds $427/mo.
- Climate carrying-cost: in FEMA flood zone AE (mandatory federal flood insurance); severe wind risk, 99% chance of damaging wind over 30y; extreme-heat days projected 7→21/yr by 2055 (HVAC capex compounding) — expect insurance premiums to compound above CPI over the hold.
Questions for the listing agent
- It's been on market 42 days. Have you received any prior offers? Is the seller open to a 3% concession, seller financing, or rate buy-down credit?
- Property tax is high relative to price — has the assessment been appealed recently, and will the sale trigger a re-assessment?
- What's the actual annual flood-insurance premium (NFIP or private), and is the property in a SFHA with mandatory coverage?
- Is there a deadline driving the sale (1031 exchange, divorce, estate, relocation)? That informs how much negotiation room exists.
- What's the average days-on-market for RENTAL listings here right now (not sales)? A rising rental-DOM trend means longer vacancies and softer asking-rent achievability than the comps imply.
- What's the recent tenant-quality profile in this submarket — average credit score on applications, eviction rate, late-payment / NSF rate, and stable-employment percentage? A property-management company in the area should have these aggregated.
- How much new for-sale + rental construction is in the pipeline within 1–3 miles? Heavy new supply typically softens prices + rents 12–24 months out; constrained supply supports both.
Investment metrics
- 1% rule
- 1.57% ✓
- Cap rate
- 11.65%
- Cash-on-cash
- 19.14%
- DSCR
- 1.85
- GRM
- 5.3
CMA / ARV
- ARV (median comp)
- $430,562
- List price
- $170,000
- Delta
- -60.52%
- Verdict
- UNDERPRICED
- Comps
- 20 within 1.0 mi
Show comp detail 12 sales within ~0.75 mi
| Address | Dist | Beds/Ba | Sqft | Sold | Price | $/sf | Match |
|---|---|---|---|---|---|---|---|
| 3233 General Taylor St | 0.23mi | 4/3.0 (+1) | 2,882 (+7%) | 5mo | $490,000 | $170 | 68 |
| 4311 S Miro St | 0.25mi | 3/2.5 | 2,366 (-12%) | 3mo | $575,000 | $243 | 65 |
| 4301 S Miro St | 0.23mi | 3/2.5 | 2,366 (-12%) | 5mo | $615,000 | $260 | 64 |
| 4307 S Miro St | 0.25mi | 3/2.5 | 2,366 (-12%) | 5mo | $560,000 | $237 | 64 |
| 4315 S Miro St | 0.26mi | 3/2.5 | 2,366 (-12%) | 5mo | $600,000 | $254 | 63 |
| 4629 Willow St | 0.67mi | 3/2.5 | 2,549 (-6%) | 4mo | $420,000 | $165 | 56 |
| 5534 S Galvez St | 0.72mi | 3/3.0 | 2,589 (-4%) | 4mo | $465,000 | $180 | 54 |
| 4221 S Robertson St | 0.69mi | 3/2.5 | 2,457 (-9%) | 4mo | $550,000 | $224 | 50 |
| 1643 S Norman Francis Pkwy | 0.73mi | 4/2.5 (+1) | 2,879 (+6%) | 3mo | $570,000 | $198 | 48 |
| 1225 S Dupre St | 0.62mi | 4/2.5 (+1) | 2,424 (-10%) | 2mo | $325,000 | $134 | 47 |
| 3425 Vincennes Pl | 0.71mi | 3/2.0 | 2,361 (-13%) | 2mo | $432,500 | $183 | 42 |
| 3518 Octavia St | 0.62mi | 4/3.0 (+1) | 3,066 (+13%) | 7mo | $570,000 | $186 | 36 |
Match score weights: distance 35% · size 25% · config 20% · recency 20%. Top-matched comps best support the ARV.
Projected returns pro-forma
-3.0% appreciation · 0.73% rent growth · sell at horizon
- IRR
- -7.0%
- Equity multiple
- 0.75×
- Total profit
- $-11,922
- Equity at exit
- $25,348
- IRR
- -1.7%
- Equity multiple
- 0.90×
- Total profit
- $-4,822
- Equity at exit
- $14,698
Cash invested: $47,600 (down + closing). Projections, not guarantees.
Landlord ↔ Tenant lean methodology
- Overall (STATE)
- 90 Strongly Landlord-Friendly
- State Louisiana
- 90 Strongly Landlord-Friendly · R+12
- County
- — inherits STATE
- City
- — inherits STATE
ZIP-level market 70125
- Home prices YoY
- -16.3%
- Rents YoY
- 0.7%
- Active inventory
- 217
- Price-to-rent
- 5.3×
Monthly cashflow live
- Estimated rent
- $2,669 high interval (Pro) →
- Mortgage (P&I)
- −$891
- Tax from tax record
- −$387 /mo · $4,648/yr
- Insurance
- −$71
- Flood insurance flood zone
- −$427 /mo · $5,118/yr
- HOA
- −$0
- Vacancy / Maint / Mgmt
- −$561
- Net cashflow
- $333
Break-even live
UW: 25.0% down · 7.5% · 30yr · 1.5% tax · 5.0% vac · 8.0% maint · 8.0% mgmt
Financing live
Cash to close
- Down payment
- $42,500
- Closing costs
- $5,100
- Reserves months
- —
- Total cash needed
- —
Loan-product check · same deal, 3 products live
Conventional
25% down · 7.5% · 30yr
- Down + closing
- —
- Monthly P&I
- —
- Monthly cashflow
- —
- DSCR
- —
- Eligible?
- —
Personal DTI + credit; lowest rate.
DSCR
20% down · 8.5% · 30yr
- Down + closing
- —
- Monthly P&I
- —
- Monthly cashflow
- —
- DSCR
- —
- Eligible?
- —
No personal income docs; deal must DSCR.
Hard money
10% down · 12.0% · 12mo
- Down + closing
- —
- Monthly P&I
- —
- Monthly cashflow
- —
- DSCR
- —
- Eligible?
- —
Short-term bridge; refi at stabilization.
Rent comps 40 comps
| Address | Beds | Baths | Sqft | Rent | $/sqft | DOM | Units | Dist |
|---|---|---|---|---|---|---|---|---|
| 3200 Washington Ave Unit NA New Orleans, LA | 4.0 | 3.0 | 2490 | $3,400 | $1.37 | 3d | 1 | 0.21mi |
| 3044 Louisiana Avenue Pkwy New Orleans, LA | 3.0 | 2.0 | 1800 | $1,900 | $1.06 | 23d | 1 | 0.27mi |
| 4027 S Derbigny St New Orleans, LA | 3.0 | 2.0 | 2950 | $1,950 | $0.66 | 23d | 1 | 0.28mi |
| 3035 Delachaise St New Orleans, LA | 3.0 | 1.0 | 1968 | $1,750 | $0.89 | 2d | 1 | 0.29mi |
| 4442 S Johnson St Unit 4442 New Orleans, LA | 4.0 | 4.5 | 3000 | $4,500 | $1.50 | 11d | 1 | 0.39mi |
| 3350 Jena St New Orleans, LA | 3.0 | 2.5 | 2200 | $2,500 | $1.14 | 43d | 1 | 0.41mi |
| 2717 Milan St New Orleans, LA | 3.0 | 1.5 | 1850 | $1,650 | $0.89 | 14d | 1 | 0.57mi |
| 2608 Magnolia St New Orleans, LA | 4.0 | 2.5 | 1950 | $3,200 | $1.64 | 43d | 1 | 0.60mi |
| 4120 Erato St New Orleans, LA | 3.0 | 2.0 | 2250 | $1,750 | $0.78 | 23d | 1 | 0.63mi |
| 2600 Peniston St New Orleans, LA | 4.0 | 2.0 | 2342 | $3,500 | $1.49 | 43d | 1 | 0.64mi |
| 3737 Nashville Ave New Orleans, LA | 4.0 | 2.0 | 2000 | $3,400 | $1.70 | 21d | 1 | 0.66mi |
| 5533 S Tonti St New Orleans, LA | 4.0 | 4.0 | 3000 | $3,000 | $1.00 | 14d | 1 | 0.67mi |
| 3816 State Street Dr New Orleans, LA | 2.0 | 2.0 | 2828 | $2,250 | $0.80 | 16d | 1 | 0.77mi |
| 1407 Magnolia St New Orleans, LA | 3.0 | 2.0 | 1824 | $1,500 | $0.82 | 23d | 1 | 0.80mi |
| 2625 Jefferson Ave New Orleans, LA | 4.0 | 2.0 | 2000 | $2,600 | $1.30 | 43d | 1 | 0.85mi |
| 2231 S Liberty St New Orleans, LA | 3.0 | 3.5 | 1752 | $2,000 | $1.14 | 17d | 1 | 0.87mi |
| 5718 Cucullu St New Orleans, LA | 4.0 | 3.0 | 1873 | $2,500 | $1.33 | 17d | 1 | 0.91mi |
| 2308 Jena St New Orleans, LA | 3.0 | 2.5 | 2550 | $3,300 | $1.29 | 43d | 1 | 0.92mi |
| 4435 Loyola Ave New Orleans, LA | 3.0 | 2.0 | 1973 | $2,900 | $1.47 | 16d | 1 | 0.97mi |
| 2824 Calhoun St Unit A New Orleans, LA | 3.0 | 2.0 | 1828 | $3,900 | $2.13 | 43d | 1 | 0.99mi |
| 2738 Calhoun St New Orleans, LA | 4.0 | 2.0 | 1900 | $4,800 | $2.53 | 3d | 1 | 1.01mi |
| 2338 Audubon St New Orleans, LA | 3.0 | 2.0 | 1935 | $2,000 | $1.03 | 3d | 1 | 1.01mi |
| 3212 Danneel St New Orleans, LA | 3.0 | 2.0 | 1945 | $2,000 | $1.03 | 23d | 1 | 1.04mi |
| 5516 S Robertson St Unit A New Orleans, LA | 3.0 | 2.5 | 3614 | $2,800 | $0.77 | 43d | 1 | 1.06mi |
| 5830 Clara St Unit 1 New Orleans, LA | 4.0 | 2.0 | 2100 | $4,500 | $2.14 | 43d | 1 | 1.06mi |
| 2616 Calhoun St New Orleans, LA | 4.0 | 2.5 | 2850 | $2,500 | $0.88 | 43d | 1 | 1.06mi |
| 2217 Jefferson Ave Unit none New Orleans, LA | 3.0 | 2.0 | 2500 | $2,500 | $1.00 | 43d | 1 | 1.07mi |
| 2229 Joseph St New Orleans, LA | 4.0 | 2.0 | 1830 | $4,000 | $2.19 | 17d | 1 | 1.07mi |
| 2306 Octavia St New Orleans, LA | 3.0 | 2.0 | 2254 | $2,650 | $1.18 | 3d | 1 | 1.08mi |
| 2205 Jefferson Ave New Orleans, LA | 3.0 | 2.0 | 1800 | $2,100 | $1.17 | 10d | 1 | 1.08mi |
| 2201 Broadway St Unit 2 New Orleans, LA | 4.0 | 2.0 | 2000 | $3,000 | $1.50 | 43d | 1 | 1.09mi |
| 2322 Nashville Ave New Orleans, LA | 4.0 | 2.0 | 2249 | $2,750 | $1.22 | 43d | 1 | 1.10mi |
| 2503 Calhoun St New Orleans, LA | 3.0 | 2.0 | 1800 | $3,000 | $1.67 | 17d | 1 | 1.10mi |
| 4213 Dryades St New Orleans, LA | 4.0 | 2.0 | 2000 | $2,800 | $1.40 | 23d | 1 | 1.12mi |
| 2301 Dryades St New Orleans, LA | 3.0 | 3.0 | 2070 | $3,000 | $1.45 | 3d | 1 | 1.13mi |
| 1907 Napoleon Ave New Orleans, LA | 4.0 | 2.0 | 2500 | $2,800 | $1.12 | 17d | 1 | 1.14mi |
| 2432 Calhoun St Unit A New Orleans, LA | 3.0 | 2.0 | 1983 | $4,400 | $2.22 | 21d | 1 | 1.14mi |
| 2432 Calhoun St New Orleans, LA | 4.0 | 2.0 | 3300 | $4,400 | $1.33 | 17d | 1 | 1.14mi |
| 2625 Baronne St Unit 1 New Orleans, LA | 3.0 | 1.5 | 2100 | $2,600 | $1.24 | 43d | 1 | 1.15mi |
| 7325 Sycamore St New Orleans, LA | 4.0 | 3.0 | 2500 | $2,350 | $0.94 | 23d | 1 | 1.18mi |
Listing history 18 events
-
2026-06-18days on market $170,000 Active 42 DOM
-
2026-06-17days on market $170,000 Active 41 DOM
-
2026-06-16days on market $170,000 Active 40 DOM
-
2026-06-15days on market $170,000 Active 39 DOM
-
2026-06-13days on market $170,000 Active 37 DOM
-
2026-06-10pricedays on market $170,000 Active 34 DOM
-
2026-06-09days on market $200,000 Active 33 DOM
Show marketing remark (136 chars)
This spacious single family home is ready for some TLC. Featuring 3 Bedroom and 2.5 Baths in an open floor plan with a lot of potential.
-
2026-06-08days on market $200,000 Active 32 DOM
-
2026-06-07days on market $200,000 Active 31 DOM
-
2026-06-05days on market $200,000 Active 28 DOM
-
2026-06-03days on market $200,000 Active 27 DOM
-
2026-06-02days on market $200,000 Active 26 DOM
-
2026-06-01days on market $200,000 Active 25 DOM
-
2026-05-31days on market $200,000 Active 24 DOM
-
2026-05-04$200,000 Active 136-char remark
Show marketing remark (136 chars)
This spacious single family home is ready for some TLC. Featuring 3 Bedroom and 2.5 Baths in an open floor plan with a lot of potential.
-
2026-05-04$200,000 Active 136-char remark
Show marketing remark (136 chars)
This spacious single family home is ready for some TLC. Featuring 3 Bedroom and 2.5 Baths in an open floor plan with a lot of potential.
-
2025-02-10$250,000 Active
-
1990-07-30soldstatus $25,000
ⓘ Source: listings_history table (triggers on properties + properties_extension) + one-shot
backfill from property_details.listing_events for pre-trigger history.
Tax reassessment forecast LA · Resets to sale price
- Current annual tax
- $4,648 · $387/mo
- Projected year-2 tax
- $4,648 · $387/mo
- Expected delta
- $0/yr ($0/mo · 0.0%)
ⓘ Screening estimate from a state-policy table — verify with the county assessor before closing.
Climate risk First Street
- Flood 8/10 Severe FEMA zone AE · 78% chance over 30 yrs
- Wildfire 1/10 Low
- Heat 10/10 Extreme 7 d/yr ≥108°F today · 21 d/yr by 30 yrs out
- Wind 10/10 Extreme 99% chance of damaging wind over 30 yrs
- Air quality 3/10 Moderate 3 unhealthy d/yr today · 4 by 30 yrs out
Nearby sold comps map
Loading sold comps map…
Walkable amenities ~0.75 mi
Loading nearby amenities…
Taxation est. · year 1
- Rental income
- $32,031
- − Mortgage interest
- −$9,523
- − Property taxes
- −$4,648
- − Insurance
- −$5,968
- − Repairs & maintenance
- −$2,562
- − Management
- −$2,562
- − Depreciation
- −$4,945
- Taxable income
- $1,821
- Est. tax owed @ 24.0%
- −$437
- After-tax cash flow
- $3,553/yr
For passive investors: Depreciation is non-cash, so a rental often shows a tax loss while cash-flowing — sheltering income. Rental losses are passive: they offset passive income freely, and up to $25,000/yr can offset ordinary (W-2) income if you actively participate and your MAGI is under $100k (phasing out to $0 by $150k); unused losses carry forward. On sale, claimed depreciation is recaptured at up to 25%, and gains may owe capital-gains tax (a 1031 exchange can defer both). Figures are a year-1 estimate at your 24.0% rate — not tax advice; consult a CPA.
Schools (NCES district)
- District
- Orleans Parish
- NCES district ID
- 2201170
- Math proficiency
- 11% ▼ -52.00%
- Reading proficiency
- 27% ▼ -46.00%
- Median HH income
- $37,011
- Composite
- 15.78/100
- National rank
- #9271
- State rank
- #69 of 98 in LA
Livability — New Orleans
- Score
- 81/100
- State rank
- #3
- US rank
- #1383
Category grades
Schools grade is shown separately in the Schools card above.
Census & demographics
- Census place
- New Orleans, LA
- County
- Orleans Parish · 338,817 people
- City population
- 338,817
- Metro
- New Orleans-Metairie, LA
- Population (ZIP)
- 17,821
- Household income
- $61,174
- Rent vs Own
- Severe rent burden
- 1270.0
Population outlook (Orleans County) Hauer SSP2
- Today (2025)
- 513,025 people
- By 2030
- 575,781 · +12.2%
- By 2040
- 700,174 · +36.5%
- By 2050
- 826,541 · +61.1%
- By 2075
- 1,123,374 · +119.0%
- By 2100
- 1,355,609 · +164.2%
Race, ethnicity, and origin ACS 2023
- Neighborhood character
- Diverse neighborhood (Simpson 0.63)
- Race & ethnicity
- Black 51% White 32% Hispanic / Latino 9% Two or more races 9% Asian 2% Native American 1%
- Hispanic origin (detail)
- Mexican 2%
- Common ancestry
- Lithuanian 8% Romanian 1% Slovak 1%
- Foreign-born
- 7% · Canada, China
- Languages at home
- 90% English-only · Spanish 6% French/Haitian/Cajun 1% Chinese 1%
Political lean MEDSL · Orleans
- 2024 margin
- Solid D (+67.0) · D 82.2% · R 15.2% · Other 2.7%
- 2008→2024 swing
- +6.7pp toward D · 2008: 60.3pp · 2024: 67.0pp
- All cycles
- 2024: D+67.0 2020: D+68.2 2016: D+66.2 2012: D+62.5 2008: D+60.3
Not yet ingested
- Civics
- —
Market trends
- HPI YoY
- ▼ -49.68%
- Current HPI
- 255.5998
- Rent YoY
- ▲ 0.73%
- Metro
- New Orleans-Metairie, LA
- State GDP YoY
- ▲ 3.29%
- F500 in state
- 10
Industry mix (Fortune 500 HQ in LA)
| Industry | F500 HQs | Revenue |
|---|---|---|
| Telecommunications | 2 | $23B |
|
||
| Utilities | 1 | $12B |
|
||
| Wholesale / Distribution | 1 | $5B |
|
||
| Advertising | 1 | $2B |
|
||
Price history
+580.0% since first listed6 events — show timeline
- 2026-06-09 Price Changed $170,000 AcadianaMLS
- 2026-06-09 Price Changed $170,000 GSREIN
- 2026-05-04 Listed $200,000 GSREIN
- 2026-05-04 Listed $200,000 AcadianaMLS
- 2025-02-10 Listed $250,000 AcadianaMLS
- 1990-07-30 Sold (Public Records) $25,000 Public Records
Property tax history
+18.8%/yrLatest (2026): $4,648 · +522.8% YoY. Source: county tax records.
Cash-flow waterfall
monthlySold comps — $/sqft
last 12 mo · ≤1 miLoading sold comps…