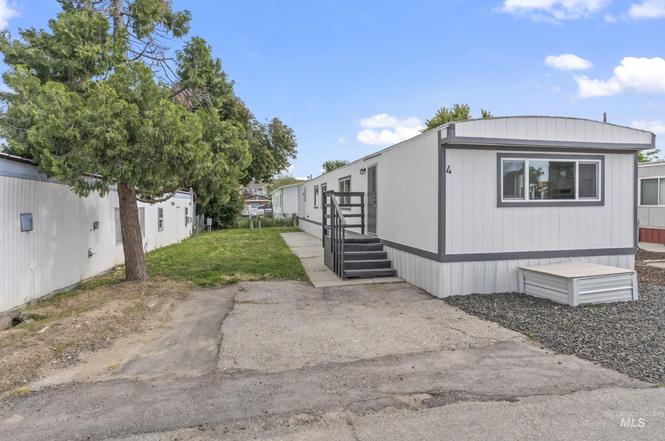
8417 W Fairview Ave #4 · Boise City, ID
Flood risk 1/10 · Minimal
- FEMA flood zone
- X (unshaded)
- Chance of flooding over 30 yrs
- 0.0%
- Est. flood insurance / yr
- $507 – $1,088
Fire risk 1/10 · Minimal
- Est. fire insurance / yr
- $584 – $1,086
Heat risk 5/10 · Moderate
- Hot days now (above 96°F)
- 7 days/yr
- Hot days in 30 yrs
- 18 days/yr
Wind risk 1/10 · Minimal
- Chance of severe wind over 30 yrs
- —
Air-quality risk 8/10 · Major
- Unhealthy air days now
- 14 days/yr
- Unhealthy air days in 30 yrs
- 19 days/yr
Risk factors via First Street. Map © Google.
Why this score? — see what drove the B grade
The composite is a weighted blend of 9 inputs, each scored 0–100. Each bar is that input's sub-score; the figure is the points it added to the 100-point composite (weight × sub-score).
- Cash flow +30.0/30.0
- 1% rule +10.0/10.0
- DSCR +10.0/10.0
- ARV discount +9.5/15.0
- Schools +4.2/10.0
- Rent growth +3.0/5.0
- Livability +2.5/5.0
- Condition / age +2.5/5.0
- Appreciation +0.0/10.0
$75,000
🖨 Deal sheet 📄 Offer letter ✓ Due diligence
Listing remarks
Welcome to this beautifully updated 14x66 Skyline home, built in 1982 and completely renovated to feel brand new! This 3-bedroom, 1-bath gem combines modern finishes with affordable living in a convenient West Boise location. Step inside to find fresh paint, new flooring throughout, and a bright, open layout. The stylish kitchen features updated cabinets, countertops, and stainless steel appliances. Owner carry option available.
Key facts
- Updated mobile home
- Heart of west boise
- Built 1982
Tags
Neighborhood map
What this means for you Summary
Snapshot
- This is a 3-bed/1.0-bath manufactured listed at $75k.
Deal economics
- At list price, monthly cash flow is $807 ($10k/yr) — positive.
- The deal already cash-flows at list — no discount required.
- Meets the 1% rule at list price ($2k rent vs $75k).
- Recommended offer: $66k (12.0% below list) — sets the bar for market timing.
- Cap rate 19.2% vs local median 2.6% in Boise City — top-decile yield for the area; either an underpriced asset or a hidden risk that comps aren't pricing in. Stress-test before assuming the spread holds.
Location & tenants
- Location reads: area grade B — affects rentability + tenant quality, not the cash-flow math above.
- Boise Independent District (urban): math 42% / reading 56% proficiency, ranked #36 of 92 in ID (top 39%) — families likely to look elsewhere, expect single-tenant / working-renter base with shorter leases.
- Zoned schools: Capital Senior High School (math 34% / reading 57%, grade D-, #59 of 169 statewide, top 35%, 1,220 students, 28% FRL).
- Market conditions: Rents rising (+1.9%/yr); 193 active listings in the ZIP; 30 comparable units currently listed for rent nearby; rentals at typical pace (median 15d on market — plan ~3-4 weeks tenant-placement turnaround); 5,129 units permitted in Ada County in 2024 (414 in 5+ unit buildings).
Forward outlook
- Local home prices are declining (-3.0%/yr); year-one equity from $519 of loan paydown is wiped out by about $2k of value loss. Plan a longer hold.
- Ada County population projected at +45% by 2050 — long-run rental-demand tailwind backs the buy-and-hold thesis.
- At projected returns (-3.0% appreciation + 1.9% rent growth), your $21k cash investment doubles in ~3 years — after that, you're playing with house money.
Negotiation context
- It's been on market 340 days — a 12% lower offer ($66k) is reasonable based on typical stale-listing flexibility.
Risks & watch-outs
- Climate carrying-cost: extreme-heat days projected 7→18/yr by 2055 (HVAC capex compounding) — expect insurance premiums to compound above CPI over the hold.
Questions for the listing agent
- It's been on market 340 days. Have you received any prior offers? Is the seller open to a 12% concession, seller financing, or rate buy-down credit?
- Why hasn't it sold? Are there any deal-killer items the seller is aware of (foundation, flood, title, zoning, code violations)?
- Is there a deadline driving the sale (1031 exchange, divorce, estate, relocation)? That informs how much negotiation room exists.
- What's the average days-on-market for RENTAL listings here right now (not sales)? A rising rental-DOM trend means longer vacancies and softer asking-rent achievability than the comps imply.
- What's the recent tenant-quality profile in this submarket — average credit score on applications, eviction rate, late-payment / NSF rate, and stable-employment percentage? A property-management company in the area should have these aggregated.
- How much new for-sale + rental construction is in the pipeline within 1–3 miles? Heavy new supply typically softens prices + rents 12–24 months out; constrained supply supports both.
Investment metrics
- 1% rule
- 2.24% ✓
- Cap rate
- 19.20%
- Cash-on-cash
- 46.10%
- DSCR
- 3.05
- GRM
- 3.7
CMA / ARV
- ARV (on-the-fly)
- $78,540
- Comps found
- 7
Show comp detail 7 sales within ~0.75 mi
| Address | Dist | Beds/Ba | Sqft | Sold | Price | $/sf | Match |
|---|---|---|---|---|---|---|---|
| 8417 W Fairview Ave #4 | 0.00mi | 3/1.0 | 924 (0%) | 1mo | $75,000 | $81 | 99 |
| 8429 W Irving Ln | 0.27mi | 2/1.0 (-1) | 938 (+2%) | 0mo | $55,000 | $59 | 80 |
| 1250 N Sable | 0.16mi | 2/2.0 (-1) | 924 (0%) | 10mo | $90,000 | $97 | 75 |
| 1328 N Arrow Ln | 0.20mi | 3/2.0 | 1,001 (+8%) | 8mo | $85,000 | $85 | 67 |
| 1011 N Fawn Ln | 0.34mi | 3/2.0 | 990 (+7%) | 8mo | $99,500 | $101 | 62 |
| 1083 N Fox Ln | 0.24mi | 2/1.0 (-1) | 882 (-4%) | 24mo | $55,000 | $62 | 57 |
| 1221 N Arrow Ln #106 | 0.25mi | 2/2.0 (-1) | 980 (+6%) | 22mo | $88,500 | $90 | 51 |
Match score weights: distance 35% · size 25% · config 20% · recency 20%. Top-matched comps best support the ARV.
Projected returns pro-forma
-3.0% appreciation · 1.95% rent growth · sell at horizon
- IRR
- 42.1%
- Equity multiple
- 2.79×
- Total profit
- $37,495
- Equity at exit
- $11,183
- IRR
- 47.8%
- Equity multiple
- 5.37×
- Total profit
- $91,864
- Equity at exit
- $6,485
Cash invested: $21,000 (down + closing). Projections, not guarantees.
Landlord ↔ Tenant lean methodology
- Overall (STATE)
- 91 Strongly Landlord-Friendly
- State Idaho
- 91 Strongly Landlord-Friendly · R+18
- County
- — inherits STATE
- City
- — inherits STATE
ZIP-level market 83704
- Rents YoY
- 1.9%
- Active inventory
- 193
- Price-to-rent
- 3.7×
Monthly cashflow live
- Estimated rent
- $1,677 high interval (Pro) →
- Mortgage (P&I)
- −$393
- Tax est. 1.5%
- −$94 /mo · $1,125/yr
- Insurance
- −$31
- HOA
- −$0
- Vacancy / Maint / Mgmt
- −$352
- Net cashflow
- $807
Break-even live
UW: 25.0% down · 7.5% · 30yr · 1.5% tax · 5.0% vac · 8.0% maint · 8.0% mgmt
Financing live
Cash to close
- Down payment
- $18,750
- Closing costs
- $2,250
- Reserves months
- —
- Total cash needed
- —
Loan-product check · same deal, 3 products live
Conventional
25% down · 7.5% · 30yr
- Down + closing
- —
- Monthly P&I
- —
- Monthly cashflow
- —
- DSCR
- —
- Eligible?
- —
Personal DTI + credit; lowest rate.
DSCR
20% down · 8.5% · 30yr
- Down + closing
- —
- Monthly P&I
- —
- Monthly cashflow
- —
- DSCR
- —
- Eligible?
- —
No personal income docs; deal must DSCR.
Hard money
10% down · 12.0% · 12mo
- Down + closing
- —
- Monthly P&I
- —
- Monthly cashflow
- —
- DSCR
- —
- Eligible?
- —
Short-term bridge; refi at stabilization.
Rent comps 30 comps
| Address | Beds | Baths | Sqft | Rent | $/sqft | DOM | Units | Dist |
|---|---|---|---|---|---|---|---|---|
| 930 N Maple Grove Rd Boise, ID | 1.0–3.0 | 1.0–2.0 | 950 | $2,333 | $2.46 | 3d | 14 | 0.38mi |
| 8443 W Rifleman St Unit 8443 Boise, ID | 2.0 | 1.0 | 846 | $1,900 | $2.25 | 3d | 1 | 0.38mi |
| 9130 W Irving St Boise, ID | 2.0 | 1.5 | 952 | $1,575 | $1.65 | 3d | 5 | 0.47mi |
| 9169 W Cory Ln #202 Boise, ID | 2.0 | 1.5 | 968 | $1,395 | $1.44 | 21d | 1 | 0.77mi |
| 2555 N Workland Ln Unit 202 Boise, ID | 2.0 | 1.0 | 800 | $1,325 | $1.66 | 14d | 1 | 0.80mi |
| 1452 N Allumbaugh St Boise, ID | 2.0 | 2.5 | 1100 | $1,525 | $1.39 | 11d | 1 | 1.05mi |
| 7521 W Tottenham Ln Apt 202 Boise, ID | 3.0 | 2.0 | 1113 | $1,595 | $1.43 | 23d | 1 | 1.06mi |
| 10096 W Garverdale Ln Boise, ID | 3.0 | 2.0 | 1113 | $1,600 | $1.44 | 23d | 1 | 1.06mi |
| 10105 W Garverdale Ln Ste 201 Boise, ID | 2.0 | 2.0 | 915 | $1,350 | $1.48 | 14d | 1 | 1.07mi |
| 6739 W Colehaven Dr Boise, ID | 2.0 | 2.0 | 1000 | $1,450 | $1.45 | 23d | 1 | 1.08mi |
| 6724 W Irving St Boise, ID | 2.0 | 2.0 | 1000 | $1,450 | $1.45 | 11d | 1 | 1.10mi |
| 10077 W Rifleman Ln Unit 103 Boise, ID | 2.0 | 2.0 | 860 | $1,395 | $1.62 | 11d | 1 | 1.10mi |
| 6677 W Colehaven Dr Boise, ID | 2.0 | 2.0 | 1000 | $1,450 | $1.45 | 23d | 1 | 1.11mi |
| 950 N Allumbaugh St Boise, ID | 2.0 | 1.0 | 902 | $1,505 | $1.67 | 2d | 2 | 1.11mi |
| 6660 W Colehaven Dr Boise, ID | 2.0 | 2.0 | 1000 | $1,450 | $1.45 | 23d | 1 | 1.13mi |
| 9113 W Ustick Rd Unit 102 Boise, ID | 2.0 | 2.0 | 1000 | $1,525 | $1.52 | 23d | 1 | 1.13mi |
| 1407 N Fry Ln Boise, ID | 2.0 | 2.0 | 1000 | $1,450 | $1.45 | 3d | 1 | 1.13mi |
| 6641 W Colehaven Dr Boise, ID | 2.0 | 2.0 | 1000 | $1,450 | $1.45 | 23d | 1 | 1.14mi |
| 6652 W Irving St Boise, ID | 2.0 | 2.0 | 1000 | $1,450 | $1.45 | 23d | 1 | 1.16mi |
| 1406 N Fry Ln Boise, ID | 2.0 | 2.0 | 1000 | $1,450 | $1.45 | 3d | 1 | 1.16mi |
| 9131 W Ustick Rd Unit 104 Boise, ID | 2.0 | 2.0 | 1000 | $1,595 | $1.59 | 11d | 1 | 1.17mi |
| 6758 W Clinton Ln Boise, ID | 2.0 | 1.0 | 900 | $1,345 | $1.49 | 23d | 1 | 1.22mi |
| 1411 N Liberty St Boise, ID | 2.0–4.0 | 1.5–2.0 | 1630 | $1,620 | $0.99 | 23d | 1 | 1.25mi |
| 9056 W Sigmont Ln Unit 201 Boise, ID | 2.0 | 2.0 | 900 | $1,300 | $1.44 | 14d | 1 | 1.29mi |
| 1105 N Liberty St Boise, ID | 1.0–2.0 | 1.0 | 727 | $1,949 | $2.68 | 14d | 4 | 1.29mi |
| 6315 W Chet Ln Boise, ID | 2.0 | 2.5 | 1050 | $1,750 | $1.67 | 14d | 1 | 1.34mi |
| 657 White Cloud Dr Boise, ID | 2.0 | 1.0 | 950 | $1,345 | $1.42 | 3d | 1 | 1.34mi |
| 6315 W Chet Ln Unit 6307 102 Boise, ID | 2.0 | 2.5 | 1050 | $1,750 | $1.67 | 23d | 1 | 1.35mi |
| 6315 W Chet Ln Unit 6315 102 Boise, ID | 2.0 | 2.5 | 1050 | $1,750 | $1.67 | 3d | 1 | 1.35mi |
| 697 White Cloud Dr Boise, ID | 2.0 | 1.0 | 921 | $1,450 | $1.57 | 23d | 1 | 1.35mi |
Listing history 6 events
-
2026-04-27status Pending
-
2025-12-01price $75,000
-
2025-11-07price $79,999
-
2025-07-17price $89,900
-
2025-06-05price $94,900
-
2025-05-22$99,000 Active
ⓘ Source: listings_history table (triggers on properties + properties_extension) + one-shot
backfill from property_details.listing_events for pre-trigger history.
Climate risk First Street
- Flood 1/10 Low FEMA zone X (unshaded) · 0% chance over 30 yrs
- Wildfire 1/10 Low
- Heat 5/10 Major 7 d/yr ≥96°F today · 18 d/yr by 30 yrs out
- Wind 1/10 Low
- Air quality 8/10 Severe 14 unhealthy d/yr today · 19 by 30 yrs out
Nearby sold comps map
Loading sold comps map…
Walkable amenities ~0.75 mi
Loading nearby amenities…
Taxation est. · year 1
- Rental income
- $20,126
- − Mortgage interest
- −$4,201
- − Property taxes
- −$1,125
- − Insurance
- −$375
- − Repairs & maintenance
- −$1,610
- − Management
- −$1,610
- − Depreciation
- −$2,182
- Taxable income
- $9,023
- Est. tax owed @ 24.0%
- −$2,166
- After-tax cash flow
- $7,514/yr
For passive investors: Depreciation is non-cash, so a rental often shows a tax loss while cash-flowing — sheltering income. Rental losses are passive: they offset passive income freely, and up to $25,000/yr can offset ordinary (W-2) income if you actively participate and your MAGI is under $100k (phasing out to $0 by $150k); unused losses carry forward. On sale, claimed depreciation is recaptured at up to 25%, and gains may owe capital-gains tax (a 1031 exchange can defer both). Figures are a year-1 estimate at your 24.0% rate — not tax advice; consult a CPA.
Schools (NCES district)
- District
- Boise Independent District
- NCES district ID
- 1600360
- Math proficiency
- 42% ▼ -5.00%
- Reading proficiency
- 56% ▼ -1.00%
- Median HH income
- $49,135
- Composite
- 41.82/100
- National rank
- #3388
- State rank
- #36 of 92 in ID
Livability — Boise City
No livability data for this city. (Only ~50 U.S. cities are tracked.)
Census & demographics
- Census place
- Boise City, ID
- County
- Ada County · 522,161 people
- City population
- 152,689
- Metro
- Boise City, ID
- Population (ZIP)
- 42,719
- Household income
- $73,390
- Rent vs Own
- Severe rent burden
- 1415.0
Population outlook (Ada County) Hauer SSP2
- Today (2025)
- 535,818 people
- By 2030
- 585,751 · +9.3%
- By 2040
- 682,435 · +27.4%
- By 2050
- 775,818 · +44.8%
- By 2075
- 994,458 · +85.6%
- By 2100
- 1,148,884 · +114.4%
Race, ethnicity, and origin ACS 2023
- Neighborhood character
- Predominantly White (77%)
- Race & ethnicity
- White 77% Hispanic / Latino 14% Two or more races 9% Asian 2% Native American 2% Black 1%
- Hispanic origin (detail)
- Mexican 10%
- Common ancestry
- Italian 4% Portuguese 3% Slovak 2%
- Foreign-born
- 8% · Canada
- Languages at home
- 87% English-only · Spanish 8% Russian/Polish/Slavic 1% Other Indo-European 1%
Political lean MEDSL · Ada
- 2024 margin
- R (+10.3) · D 43.4% · R 53.8% · Other 2.8%
- 2008→2024 swing
- -4.2pp toward R · 2008: -6.2pp · 2024: -10.3pp
- All cycles
- 2024: R+10.3 2020: R+3.9 2016: R+9.2 2012: R+11.3 2008: R+6.2
Not yet ingested
- Civics
- —
Market trends
- HPI YoY
- ▼ -393.15%
- Current HPI
- 379.0934
- Rent YoY
- ▲ 1.95%
- Metro
- Boise City, ID
- State GDP YoY
- ▲ 4.51%
- F500 in state
- 6
Industry mix (Fortune 500 HQ in ID)
| Industry | F500 HQs | Revenue |
|---|---|---|
| Retail | 1 | $79B |
|
||
| Technology | 1 | $25B |
|
||
| Food / Agriculture | 1 | $6B |
|
||
Price history
-24.2% since first listed6 events — show timeline
- 2026-04-27 Pending — IMLS
- 2025-12-01 Price Changed $75,000 IMLS
- 2025-11-07 Price Changed $79,999 IMLS
- 2025-07-17 Price Changed $89,900 IMLS
- 2025-06-05 Price Changed $94,900 IMLS
- 2025-05-22 Listed $99,000 IMLS
Cash-flow waterfall
monthlySold comps — $/sqft
last 12 mo · ≤1 miLoading sold comps…