25608 Wheat Seed Ln · Elgin, TX
Flood risk No data
- FEMA flood zone
- —
- Chance of flooding over 30 yrs
- —
- Est. flood insurance / yr
- —
Fire risk No data
- Est. fire insurance / yr
- —
Heat risk No data
- Hot days now (above threshold)
- —
- Hot days in 30 yrs
- —
Wind risk No data
- Chance of severe wind over 30 yrs
- —
Air-quality risk No data
- Unhealthy air days now
- —
- Unhealthy air days in 30 yrs
- —
Risk factors via First Street. Map © Google.
Why this score? — see what drove the D grade
The composite is a weighted blend of 9 inputs, each scored 0–100. Each bar is that input's sub-score; the figure is the points it added to the 100-point composite (weight × sub-score).
- Appreciation +10.0/10.0
- ARV discount +9.2/15.0
- Cash flow +8.3/30.0
- Livability +3.7/5.0
- Rent growth +3.3/5.0
- Condition / age +2.5/5.0
- DSCR +2.2/10.0
- Schools +2.0/10.0
- 1% rule +1.9/10.0
$288,990
🖨 Deal sheet (PDF) 📄 Offer letter ✓ Due diligence
Listing remarks MLS
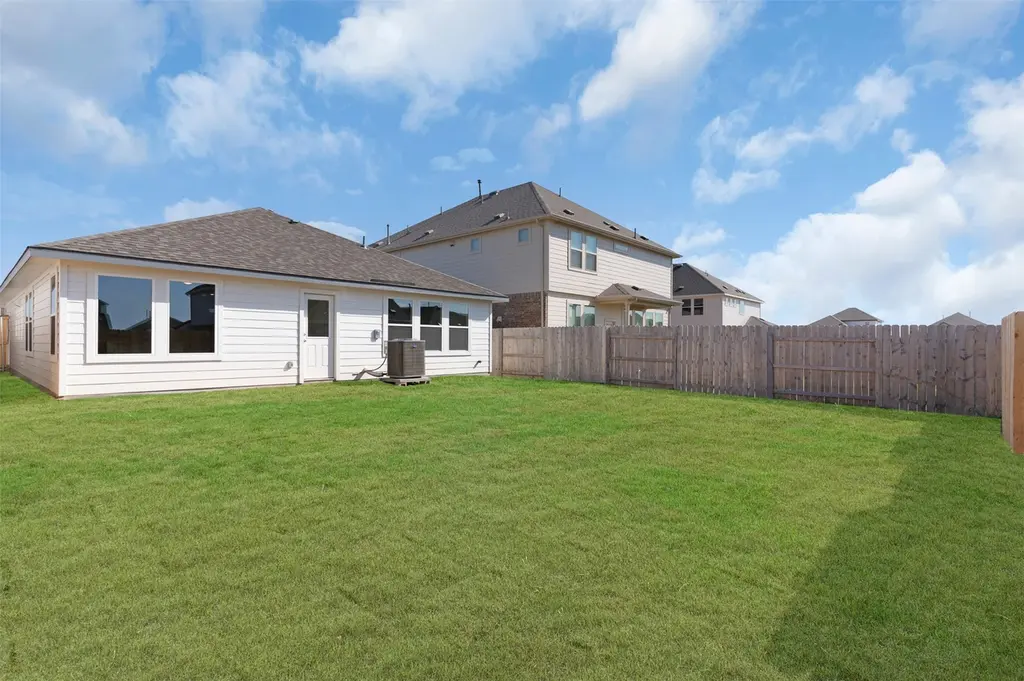
Discover the Kenzo, a beautifully designed 1-story home offering 1,470 sq ft of functional living space. This 3-bedroom, 2-bath gem features an open-concept layout perfect for modern living. The heart of the home is the kitchen, complete with a center island that overlooks a large family roomâ??ideal for entertaining and everyday family life. The primary bedroom offers a peaceful retreat, boasting a spacious walk-in closet, dual sinks, and a luxurious walk-in shower. Two secondary bedrooms share a well-appointed bathroom, providing comfort and privacy for guests or family members. With a 2-car garage and an optional outdoor living patio, this floorplan seamlessly combines indoor and outdoor living. The Kenzo offers both style and practicality, with ample storage and plenty of natural light throughout. Photos representative of floorplan only.
Key facts
- 5,619 sq ft lot
- 2 garage spots
- Community pool
Neighborhood map
What this means for you Summary
Snapshot
- This is a 3-bed/2.0-bath land listed at $289k.
Deal economics
- At list price, monthly cash flow is $-265 ($-3k/yr) — negative.
- To cash-flow at today's rent, offer at most $242k (16.2% below list).
- To meet the 1% rule (rent ≥ 1% of price), the offer needs to be $198k (31.3% below list).
- Recommended offer: $198k (31.3% below list) — sets the bar for 1% rule.
Location & tenants
- Location reads 74/100 on livability (#167 in TX, #4,404 nationally) — a middle-class / working-renter tenant base. Strengths: cost of living A+, housing A+, health & safety A+; Watch: schools F, amenities F, commute F.
- Elgin ISD (rural): math 17% / reading 26% proficiency, ranked #741 of 826 in TX (top 90%) — low school quality limits family demand, transient renter base, plan for 1-2y turnover; 67% free/reduced lunch — lower-income household profile, screen leases tightly.
- Market conditions: Rents rising (+3.1%/yr); 813 active listings in the ZIP; 31 comparable units currently listed for rent nearby; rentals at typical pace (median 16d on market — plan ~3-4 weeks tenant-placement turnaround); solid renter incomes; 17,121 units permitted in Travis County in 2024 (11,963 in 5+ unit buildings).
Forward outlook
- In year one you build about $31k of equity ($2k loan paydown + $29k appreciation (10.0% local appreciation)).
- Travis County population projected at +60% by 2050 — long-run rental-demand tailwind backs the buy-and-hold thesis.
- By year 2, paydown + projected appreciation supports a ~$50k cash-out refi (75% LTV) — recoverable capital for the next deal without selling this one.
Negotiation context
- It's been on market 83 days — a 6% lower offer ($272k) is reasonable based on typical stale-listing flexibility.
- 2 sale attempts with the ask held roughly flat each time — persistent listings suggest the price (not the market) is what's stuck; bring a comps-based counter.
Questions for the listing agent
- What do current leases actually rent for vs. the listed asking? Can we see a recent rent roll and the last 12 months of T-12 income?
- It's been on market 83 days. Have you received any prior offers? Is the seller open to a 31% concession, seller financing, or rate buy-down credit?
- What does the HOA fee cover, when was the last increase, and are there any pending special assessments or reserve-fund shortfalls?
- Why hasn't it sold? Are there any deal-killer items the seller is aware of (foundation, flood, title, zoning, code violations)?
- Is there a deadline driving the sale (1031 exchange, divorce, estate, relocation)? That informs how much negotiation room exists.
- Schools are F-rated, which usually means shorter tenancies and higher turnover. Who's the typical renter profile here, and what's been the actual vacancy rate?
- The area grade is low — what's the realistic commute time and amenity access for the typical tenant pool here? Any planned neighborhood developments (good or bad) we should know about?
- What's the average days-on-market for RENTAL listings here right now (not sales)? A rising rental-DOM trend means longer vacancies and softer asking-rent achievability than the comps imply.
- What's the recent tenant-quality profile in this submarket — average credit score on applications, eviction rate, late-payment / NSF rate, and stable-employment percentage? A property-management company in the area should have these aggregated.
- How much new for-sale + rental construction is in the pipeline within 1–3 miles? Heavy new supply typically softens prices + rents 12–24 months out; constrained supply supports both.
Investment metrics
- 1% rule
- 0.69% ✗
- Cap rate
- 5.19%
- Cash-on-cash
- -3.93%
- DSCR
- 0.82
- GRM
- 12.1
CMA / ARV
- ARV (median comp)
- $299,999
- List price
- $288,990
- Delta
- -3.67%
- Verdict
- FAIR
- Comps
- 20 within 1.0 mi
Projected returns pro-forma
10.0% appreciation · 3.12% rent growth · sell at horizon
- IRR
- 21.5%
- Equity multiple
- 2.74×
- Total profit
- $140,664
- Equity at exit
- $260,345
- IRR
- 19.4%
- Equity multiple
- 6.29×
- Total profit
- $427,868
- Equity at exit
- $561,444
Cash invested: $80,917 (down + closing). Projections, not guarantees.
Landlord ↔ Tenant lean methodology
- Overall (STATE)
- 87 Strongly Landlord-Friendly
- State Texas
- 87 Strongly Landlord-Friendly · R+5
- County
- — inherits STATE
- City
- — inherits STATE
ZIP-level market 78621
- Home prices YoY
- 7.6%
- Rents YoY
- 3.1%
- Active inventory
- 813
- Price-to-rent
- 12.1×
Monthly cashflow live
- Estimated rent
- $1,985 high interval (Pro) →
- Mortgage (P&I)
- −$1,515
- Tax from tax record
- −$102 /mo · $1,218/yr
- Insurance
- −$120
- HOA
- −$96
- Vacancy / Maint / Mgmt
- −$417
- Net cashflow
- $-265
Break-even live
Sensitivity live
| Price | -10% $-102 | -5% $-184 | +0% $-265 | +5% $-347 | +10% $-429 |
|---|---|---|---|---|---|
| Rent | -10% $-422 | -5% $-344 | +0% $-265 | +5% $-187 | +10% $-108 |
| Rate | -1.0pp $-120 | -0.5pp $-192 | base $-265 | +0.5pp $-340 | +1.0pp $-416 |
UW: 25.0% down · 7.5% · 30yr · 1.5% tax · 5.0% vac · 8.0% maint · 8.0% mgmt
Financing live
Cash to close
- Down payment
- $72,248
- Closing costs
- $8,670
- Reserves months
- —
- Total cash needed
- —
Loan-product check · same deal, 3 products live
Conventional
25% down · 7.5% · 30yr
- Down + closing
- —
- Monthly P&I
- —
- Monthly cashflow
- —
- DSCR
- —
- Eligible?
- —
Personal DTI + credit; lowest rate.
DSCR
20% down · 8.5% · 30yr
- Down + closing
- —
- Monthly P&I
- —
- Monthly cashflow
- —
- DSCR
- —
- Eligible?
- —
No personal income docs; deal must DSCR.
Hard money
10% down · 12.0% · 12mo
- Down + closing
- —
- Monthly P&I
- —
- Monthly cashflow
- —
- DSCR
- —
- Eligible?
- —
Short-term bridge; refi at stabilization.
Rent comps 31 comps
| Address | Beds | Baths | Sqft | Rent | $/sqft | DOM | Units | Dist |
|---|---|---|---|---|---|---|---|---|
| 101 Bandara Woods Blvd Elgin, TX | 3.0 | 2.0 | 1499 | $1,769 | $1.18 | 16d | 1 | 0.27mi |
| 401 Bandara Woods Blvd Elgin, TX | 3.0 | 2.0 | 1665 | $1,875 | $1.13 | 45d | 1 | 0.46mi |
| 13817 County Line Rd Elgin, TX | 1.0–3.0 | 1.0–2.0 | 937 | $1,890 | $2.02 | 3d | 6 | 0.53mi |
| 18505 Quiet Range Dr Unit 18505 Elgin, TX | 4.0 | 2.0 | 1794 | $1,785 | $0.99 | 5d | 1 | 0.53mi |
| 18505 Quiet Range Dr Elgin, TX | 4.0 | 2.0 | 1794 | $1,950 | $1.09 | 25d | 1 | 0.53mi |
| 18721 Quiet Range Dr Elgin, TX | 3.0–5.0 | 2.0–3.5 | 1773 | $2,085 | $1.18 | 3d | 1 | 0.53mi |
| 18525 Quiet Range Dr Elgin, TX | 4.0 | 2.0 | 1794 | $1,725 | $0.96 | 19d | 1 | 0.54mi |
| 19405 Bear Grass Dr Elgin, TX | 3.0 | 2.0 | 1495 | $1,760 | $1.18 | 45d | 1 | 0.59mi |
| 18500 Allen Welch Dr Elgin, TX | 3.0 | 2.0 | 1525 | $1,825 | $1.20 | 5d | 1 | 0.63mi |
| 18612 Allen Welch Dr Elgin, TX | 4.0 | 2.0 | 1794 | $1,885 | $1.05 | 5d | 1 | 0.63mi |
| 14300 Boomtown Way Elgin, TX | 4.0 | 2.0 | 1794 | $2,050 | $1.14 | 25d | 1 | 0.69mi |
| 14141 Prospector Way Elgin, TX | 3.0 | 2.0 | 1520 | $1,650 | $1.09 | 45d | 1 | 0.71mi |
| 14421 Prairie Sod Ln Elgin, TX | 3.0 | 2.0 | 1525 | $1,650 | $1.08 | 3d | 1 | 0.76mi |
| 18300 Speculator Ln Elgin, TX | 4.0 | 2.0 | 1794 | $1,995 | $1.11 | 25d | 1 | 0.78mi |
| 18224 Speculator Ln Elgin, TX | 3.0 | 2.5 | 1599 | $1,700 | $1.06 | 45d | 1 | 0.78mi |
| 107 Tillage Rd Elgin, TX | 3.0 | 2.0 | 1548 | $1,775 | $1.15 | 20d | 1 | 0.82mi |
| 14508 Wahlbergs Way Elgin, TX | 3.0 | 2.0 | 1076 | $2,045 | $1.90 | 12d | 1 | 0.86mi |
| 18200 Papuan Cv Elgin, TX | 3.0 | 2.0 | 1402 | $1,900 | $1.36 | 4d | 1 | 0.90mi |
| 234 Heritage Mill Trl Elgin, TX | 3.0 | 2.0 | 1530 | $1,850 | $1.21 | 3d | 1 | 0.91mi |
| 18316 Stellers Sea St Elgin, TX | 3.0 | 2.0 | 1076 | $2,045 | $1.90 | 20d | 1 | 1.00mi |
| 419 Gettysburg Loop Elgin, TX | 3.0 | 2.0 | 1565 | $1,850 | $1.18 | 13d | 1 | 1.06mi |
| 116 Honeybee Ln Elgin, TX | 3.0 | 2.5 | 1782 | $2,000 | $1.12 | 5d | 1 | 1.12mi |
| 242 Barley Ln Elgin, TX | 3.0 | 2.5 | 1782 | $2,150 | $1.21 | 3d | 1 | 1.19mi |
| 14129 Tordillo Dr Elgin, TX | 4.0 | 2.5 | 1874 | $2,675 | $1.43 | 25d | 1 | 1.21mi |
| 14129 Tordillo Dr Unit NA Elgin, TX | 4.0 | 2.5 | 1874 | $2,595 | $1.38 | 5d | 1 | 1.21mi |
| 13804 Knights Branch Dr Elgin, TX | 3.0 | 2.5 | 1427 | $1,900 | $1.33 | 5d | 1 | 1.37mi |
| 13725 Knights Branch Dr Elgin, TX | 4.0 | 2.5 | 1800 | $2,100 | $1.17 | 25d | 1 | 1.40mi |
| 13121 Blackeyed Susan Trl Elgin, TX | 4.0 | 2.0 | 1586 | $1,800 | $1.13 | 19d | 1 | 1.40mi |
| 13604 Menard Way Elgin, TX | 3.0 | 2.0 | 1474 | $1,875 | $1.27 | 25d | 1 | 1.44mi |
| 102 Schuylerville Dr Elgin, TX | 3.0 | 2.0 | 1479 | $1,800 | $1.22 | 45d | 1 | 1.46mi |
| 13520 Knights Branch Dr Elgin, TX | 3.0 | 2.5 | 1600 | $1,850 | $1.16 | 3d | 1 | 1.49mi |
HOA detail
- Monthly dues
- $96 · $1,152/yr
Listing history 16 events
-
2026-06-21days on market $288,990 Active 83 DOM
-
2026-06-18days on market $288,990 Active 80 DOM
-
2026-06-17days on market $288,990 Active 79 DOM
-
2026-06-16days on market $288,990 Active 78 DOM
-
2026-06-15days on market $288,990 Active 77 DOM
-
2026-06-13days on market $288,990 Active 75 DOM
-
2026-06-09days on market $288,990 Active 71 DOM
-
2026-06-08days on market $288,990 Active 70 DOM
-
2026-06-07days on market $288,990 Active 69 DOM
-
2026-06-04days on market $288,990 Active 66 DOM
-
2026-06-03days on market $288,990 Active 65 DOM
-
2026-06-02days on market $288,990 Active 64 DOM
-
2026-06-01days on market $288,990 Active 63 DOM
-
2026-05-31days on market $288,990 Active 62 DOM
-
2026-05-15$299,999 Active 859-char remark
Show marketing remark (859 chars)
Discover the Kenzo, a beautifully designed 1-story home offering 1,470 sq ft of functional living space. This 3-bedroom, 2-bath gem features an open-concept layout perfect for modern living. The heart of the home is the kitchen, complete with a center island that overlooks a large family roomâ??ideal for entertaining and everyday family life. The primary bedroom offers a peaceful retreat, boasting a spacious walk-in closet, dual sinks, and a luxurious walk-in shower. Two secondary bedrooms share a well-appointed bathroom, providing comfort and privacy for guests or family members. With a 2-car garage and an optional outdoor living patio, this floorplan seamlessly combines indoor and outdoor living. The Kenzo offers both style and practicality, with ample storage and plenty of natural light throughout. Photos representative of floorplan only.
-
2026-03-30$299,999 Active 1223-char remark
Show marketing remark (1223 chars)
New Construction | 1-Story | 1,470 Sq Ft | 3 Beds | 2 Baths | Available Summer 2026 | The Kenzo is a thoughtfully designed single-story home offering 1,470 square feet of functional living space with an open-concept layout that supports everyday comfort and ease. The foyer leads to two secondary bedrooms with closets that share a well-appointed full bathroom, creating a practical setup for shared living. Continuing down the hall, you’ll find access to the 2-car garage before the home opens into the kitchen featuring a central island and walk-in pantry. The kitchen flows into the breakfast area, with the utility room conveniently located nearby, keeping daily routines within reach. Just beyond, the spacious family room offers a comfortable place to gather, with natural light enhancing the open feel. The primary bedroom is tucked off the family room and features an ensuite bath with French doors, dual vanities, a walk-in shower, and a walk-in closet, providing a private and relaxing retreat. With its efficient layout, open living spaces, and ample storage throughout, the Kenzo blends style and practicality in a way that’s easy to live in. Visit our model and ask about current buyer incentives!
ⓘ Source: listings_history table (triggers on properties + properties_extension) + one-shot
backfill from property_details.listing_events for pre-trigger history.
Tax reassessment forecast TX · Resets to sale price
- Current annual tax
- $1,218 · $102/mo
- Projected year-2 tax
- $5,289 · $441/mo
- Expected delta
- +$4,070/yr (+$339/mo · 334.1%)
ⓘ Screening estimate from a state-policy table — verify with the county assessor before closing.
Nearby sold comps map
Loading sold comps map…
Walkable amenities ~0.75 mi
Loading nearby amenities…
Taxation est. · year 1
- Rental income
- $23,820
- − Mortgage interest
- −$16,188
- − Property taxes
- −$1,218
- − Insurance
- −$1,445
- − Repairs & maintenance
- −$1,906
- − Management
- −$1,906
- − HOA
- −$1,152
- − Depreciation
- −$8,407
- Taxable loss
- −$8,402
- Est. tax savings @ 24.0%
- +$2,016
- After-tax cash flow
- $-1,167/yr
For passive investors: Depreciation is non-cash, so a rental often shows a tax loss while cash-flowing — sheltering income. Rental losses are passive: they offset passive income freely, and up to $25,000/yr can offset ordinary (W-2) income if you actively participate and your MAGI is under $100k (phasing out to $0 by $150k); unused losses carry forward. On sale, claimed depreciation is recaptured at up to 25%, and gains may owe capital-gains tax (a 1031 exchange can defer both). Figures are a year-1 estimate at your 24.0% rate — not tax advice; consult a CPA.
Schools (NCES district)
- District
- Elgin ISD
- NCES district ID
- 4818360
- Math proficiency
- 17% ▼ -9.00%
- Reading proficiency
- 26% ▼ -5.00%
- Median HH income
- $55,176
- Composite
- 19.62/100
- National rank
- #8749
- State rank
- #741 of 826 in TX
Livability — Elgin
- Score
- 74/100
- State rank
- #167
- US rank
- #4404
Category grades
Schools grade is shown separately in the Schools card above.
Census & demographics
- Census place
- Elgin, TX
- County
- Bastrop County · 68,601 people
- City population
- 27,860
- Metro
- Austin-Round Rock-Georgetown, TX
- Population (ZIP)
- 30,411
- Household income
- $98,534
- Rent vs Own
- Severe rent burden
- 235.0
Population outlook (Travis County) Hauer SSP2
- Today (2025)
- 1,545,133 people
- By 2030
- 1,729,269 · +11.9%
- By 2040
- 2,097,596 · +35.8%
- By 2050
- 2,463,890 · +59.5%
- By 2075
- 3,249,374 · +110.3%
- By 2100
- 3,801,868 · +146.1%
Race, ethnicity, and origin ACS 2023
- Neighborhood character
- Diverse neighborhood (Simpson 0.64)
- Race & ethnicity
- Hispanic / Latino 46% White 38% Two or more races 19% Black 11% Native American 1%
- Hispanic origin (detail)
- Mexican 38%
- Common ancestry
- Slovak 2% Italian 2% Romanian 1%
- Foreign-born
- 17% · Canada, Vietnam
- Languages at home
- 63% English-only · Spanish 36%
Political lean MEDSL · Travis
- 2024 margin
- Solid D (+39.3) · D 68.8% · R 29.4% · Other 1.8%
- 2008→2024 swing
- +9.9pp toward D · 2008: 29.4pp · 2024: 39.3pp
- All cycles
- 2024: D+39.3 2020: D+45.0 2016: D+38.9 2012: D+23.9 2008: D+29.4
Not yet ingested
- Civics
- —
Market trends
- HPI YoY
- ▲ 29.47%
- Current HPI
- 416.87
- Rent YoY
- ▲ 3.12%
- Metro
- Austin-Round Rock-Georgetown, TX
- State GDP YoY
- ▲ 3.95%
- F500 in state
- 110
Industry mix (Fortune 500 HQ in TX)
| Industry | F500 HQs | Revenue |
|---|---|---|
| Energy | 16 | $1,198B |
|
||
| Technology | 5 | $198B |
|
||
| Engineering / Construction | 4 | $72B |
|
||
| Energy Services | 3 | $60B |
|
||
| Utilities | 3 | $41B |
|
||
| Healthcare | 2 | $330B |
|
||
Price history
+0.0% since first listed2 events — show timeline
- 2026-05-15 Listed $299,999 Zillow
- 2026-03-30 Listed $299,999 Unlock MLS
Property tax history
+120.6%/yrLatest (2026): $1,218 · +20.0% YoY. Source: county tax records.
Cash-flow waterfall
monthlySold comps — $/sqft
last 12 mo · ≤1 miLoading sold comps…