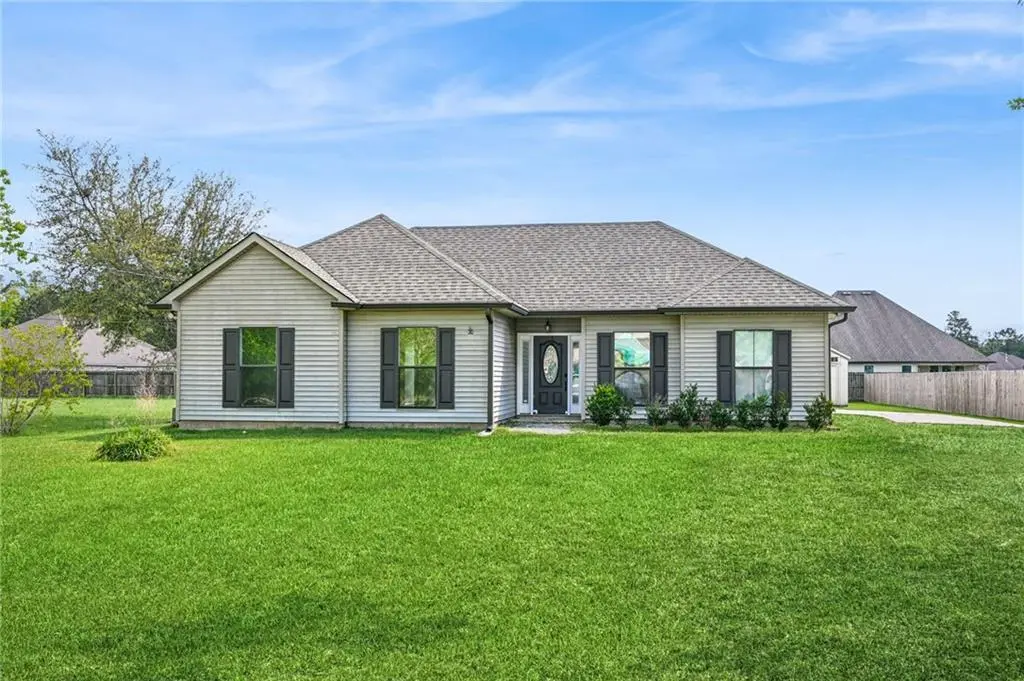
16500 Mp Planche Rd · Covington, LA
Flood risk 4/10 · Minor
- FEMA flood zone
- X
- Chance of flooding over 30 yrs
- 0.22%
- Est. flood insurance / yr
- $507 – $1,088
Fire risk 6/10 · Moderate
- Est. fire insurance / yr
- $1,269 – $2,357
Heat risk 9/10 · Severe
- Hot days now (above 109°F)
- 7 days/yr
- Hot days in 30 yrs
- 22 days/yr
Wind risk 9/10 · Severe
- Chance of severe wind over 30 yrs
- 99.0%
Air-quality risk 2/10 · Minimal
- Unhealthy air days now
- 0 days/yr
- Unhealthy air days in 30 yrs
- 1 days/yr
Risk factors via First Street. Map © Google.
Why this score? — see what drove the C- grade
The composite is a weighted blend of 9 inputs, each scored 0–100. Each bar is that input's sub-score; the figure is the points it added to the 100-point composite (weight × sub-score).
- Cash flow +18.7/30.0
- ARV discount +13.1/15.0
- DSCR +5.9/10.0
- Schools +4.3/10.0
- 1% rule +4.2/10.0
- Livability +3.8/5.0
- Rent growth +2.5/5.0
- Condition / age +2.5/5.0
- Appreciation +0.0/10.0
$250,000
🖨 Deal sheet 📄 Offer letter ✓ Due diligence
Listing remarks MLS
3 Bed, 2 Bath home on half acre lot in just outside of Covington city limits. Open kitchen, living, and dining area. Wood laminate floors in living area, and in bedrooms. Attached carport which can double as entertaining space. Refrigerator, washer and dryer included. All electric. Water is on well so no added water bill.
Key facts
- Attached carport
- Water on well
- Wood laminate floors
Tags
Neighborhood map
What this means for you Summary
Snapshot
- This is a 3-bed/2.0-bath single-family listed at $250k.
Deal economics
- At list price, monthly cash flow is $247 ($3k/yr) — positive.
- The deal already cash-flows at list — no discount required.
- To meet the 1% rule (rent ≥ 1% of price), the offer needs to be $231k (7.7% below list).
- Recommended offer: $231k (7.7% below list) — sets the bar for 1% rule.
- Cap rate 7.5% vs local median 3.9% in Covington — top-decile yield for the area; either an underpriced asset or a hidden risk that comps aren't pricing in. Stress-test before assuming the spread holds.
Location & tenants
- Location reads 75/100 on livability (#17 in LA, #3,876 nationally) — a middle-class / working-renter tenant base. Strengths: employment A+, housing A+, health & safety A+; Watch: amenities F, commute F.
- St. Tammany Parish (suburban): math 43% / reading 55% proficiency, ranked #11 of 98 in LA (top 11%) — families likely to look elsewhere, expect single-tenant / working-renter base with shorter leases.
- Market conditions: 365 active listings in the ZIP; 2 comparable units currently listed for rent nearby; solid renter incomes; 1,064 units permitted in St. Tammany Parish in 2024 (0 in 5+ unit buildings).
- This rent runs 34% of the median local income ($81k/yr) — at the standard rent-burdened threshold; future hikes will face affordability resistance.
Forward outlook
- Local home prices are declining (-3.0%/yr); year-one equity from $2k of loan paydown is wiped out by about $8k of value loss. Plan a longer hold.
- St. Tammany County population projected at +27% by 2050 — long-run rental-demand tailwind backs the buy-and-hold thesis.
Negotiation context
- It's been on market 79 days — a 6% lower offer ($235k) is reasonable based on typical stale-listing flexibility.
- 11 sale attempts since 12y ago with the ask held roughly flat each time — persistent listings suggest the price (not the market) is what's stuck; bring a comps-based counter.
Risks & watch-outs
- Climate carrying-cost: severe wind risk, 99% chance of damaging wind over 30y; major wildfire risk; extreme-heat days projected 7→22/yr by 2055 (HVAC capex compounding) — expect insurance premiums to compound above CPI over the hold.
Questions for the listing agent
- It's been on market 79 days. Have you received any prior offers? Is the seller open to a 8% concession, seller financing, or rate buy-down credit?
- Why hasn't it sold? Are there any deal-killer items the seller is aware of (foundation, flood, title, zoning, code violations)?
- Is there a deadline driving the sale (1031 exchange, divorce, estate, relocation)? That informs how much negotiation room exists.
- Schools are B-rated — typically a magnet for longer-tenancy family renters. What's the average tenant stay here, and is there a school-zone premium baked into asking?
- What's the average days-on-market for RENTAL listings here right now (not sales)? A rising rental-DOM trend means longer vacancies and softer asking-rent achievability than the comps imply.
- What's the recent tenant-quality profile in this submarket — average credit score on applications, eviction rate, late-payment / NSF rate, and stable-employment percentage? A property-management company in the area should have these aggregated.
- How much new for-sale + rental construction is in the pipeline within 1–3 miles? Heavy new supply typically softens prices + rents 12–24 months out; constrained supply supports both.
Investment metrics
- 1% rule
- 0.92% ✗
- Cap rate
- 7.48%
- Cash-on-cash
- 4.23%
- DSCR
- 1.19
- GRM
- 9.0
CMA / ARV
- ARV (median comp)
- $285,671
- List price
- $250,000
- Delta
- -12.49%
- Verdict
- UNDERPRICED
- Comps
- 20 within 1.0 mi
Show comp detail 12 sales within ~0.75 mi
| Address | Dist | Beds/Ba | Sqft | Sold | Price | $/sf | Match |
|---|---|---|---|---|---|---|---|
| 75705 Rickelin Dr | 0.05mi | 3/2.0 | 1,470 (-1%) | 4mo | $262,000 | $178 | 92 |
| 16518 Mp Planche Rd | 0.04mi | 3/2.0 | 1,574 (+6%) | 6mo | $315,000 | $200 | 84 |
| 16937 River Park Dr | 0.30mi | 3/2.0 | 1,522 (+2%) | 14mo | $254,745 | $167 | 70 |
| 72421 Victoria Dr | 0.19mi | 3/2.0 | 1,601 (+7%) | 12mo | $257,755 | $161 | 69 |
| 16925 River Park Dr | 0.32mi | 3/2.0 | 1,522 (+2%) | 20mo | $251,580 | $165 | 65 |
| 75616 Sylvia Dr | 0.10mi | 3/2.0 | 1,300 (-13%) | 11mo | $240,000 | $185 | 65 |
| 75425 Victoria Dr | 0.22mi | 3/2.0 | 1,629 (+9%) | 14mo | $262,395 | $161 | 62 |
| 16713 Highland Heights Dr | 0.20mi | 3/2.0 | 1,292 (-13%) | 11mo | $230,000 | $178 | 59 |
| 75312 Sydney Dr | 0.25mi | 3/2.0 | 1,629 (+9%) | 19mo | $259,595 | $159 | 57 |
| 75416 Victoria Dr | 0.19mi | 3/2.0 | 1,689 (+13%) | 15mo | $269,075 | $159 | 57 |
| 75424 Victoria Dr | 0.20mi | 3/2.0 | 1,689 (+13%) | 15mo | $266,200 | $158 | 56 |
| 75436 Victoria Dr | 0.23mi | 3/2.0 | 1,689 (+13%) | 19mo | $265,565 | $157 | 51 |
Match score weights: distance 35% · size 25% · config 20% · recency 20%. Top-matched comps best support the ARV.
Projected returns pro-forma
-3.0% appreciation · 3.0% rent growth · sell at horizon
- IRR
- -9.7%
- Equity multiple
- 0.65×
- Total profit
- $-24,845
- Equity at exit
- $37,276
- IRR
- -0.3%
- Equity multiple
- 0.98×
- Total profit
- $-1,627
- Equity at exit
- $21,615
Cash invested: $70,000 (down + closing). Projections, not guarantees.
Landlord ↔ Tenant lean methodology
- Overall (STATE)
- 90 Strongly Landlord-Friendly
- State Louisiana
- 90 Strongly Landlord-Friendly · R+12
- County
- — inherits STATE
- City
- — inherits STATE
ZIP-level market 70435
- Home prices YoY
- -27.3%
- Active inventory
- 365
- Price-to-rent
- 9.0×
Monthly cashflow live
- Estimated rent
- $2,307 medium interval (Pro) →
- Mortgage (P&I)
- −$1,311
- Tax from tax record
- −$160 /mo · $1,922/yr
- Insurance
- −$104
- HOA
- −$0
- Vacancy / Maint / Mgmt
- −$484
- Net cashflow
- $247
Break-even live
UW: 25.0% down · 7.5% · 30yr · 1.5% tax · 5.0% vac · 8.0% maint · 8.0% mgmt
Financing live
Cash to close
- Down payment
- $62,500
- Closing costs
- $7,500
- Reserves months
- —
- Total cash needed
- —
Loan-product check · same deal, 3 products live
Conventional
25% down · 7.5% · 30yr
- Down + closing
- —
- Monthly P&I
- —
- Monthly cashflow
- —
- DSCR
- —
- Eligible?
- —
Personal DTI + credit; lowest rate.
DSCR
20% down · 8.5% · 30yr
- Down + closing
- —
- Monthly P&I
- —
- Monthly cashflow
- —
- DSCR
- —
- Eligible?
- —
No personal income docs; deal must DSCR.
Hard money
10% down · 12.0% · 12mo
- Down + closing
- —
- Monthly P&I
- —
- Monthly cashflow
- —
- DSCR
- —
- Eligible?
- —
Short-term bridge; refi at stabilization.
Rent comps 2 comps
| Address | Beds | Baths | Sqft | Rent | $/sqft | DOM | Units | Dist |
|---|---|---|---|---|---|---|---|---|
| 75736 Rickelin Dr Covington, LA | 3.0 | 2.0 | 1781 | $2,095 | $1.18 | 43d | 1 | 0.13mi |
| 75533 Joyce Dr Covington, LA | 3.0 | 2.0 | 1825 | $2,150 | $1.18 | 43d | 1 | 0.18mi |
Listing history 38 events
-
2026-06-18days on market $250,000 Active 79 DOM
-
2026-06-17days on market $250,000 Active 78 DOM
-
2026-06-16days on market $250,000 Active 77 DOM
-
2026-06-15days on market $250,000 Active 76 DOM
-
2026-06-13days on market $250,000 Active 74 DOM
-
2026-06-10days on market $250,000 Active 71 DOM
-
2026-06-09days on market $250,000 Active 70 DOM
-
2026-06-08days on market $250,000 Active 69 DOM
-
2026-06-07pricedays on market $250,000 Active 68 DOM
-
2026-06-03days on market $255,000 Active 64 DOM
-
2026-06-02days on market $255,000 Active 63 DOM
-
2026-06-01days on market $255,000 Active 62 DOM
-
2026-05-31days on market $255,000 Active 61 DOM
-
2026-04-20price $255,000 323-char remark
Show marketing remark (323 chars)
3 Bed, 2 Bath home on half acre lot in just outside of Covington city limits. Open kitchen, living, and dining area. Wood laminate floors in living area, and in bedrooms. Attached carport which can double as entertaining space. Refrigerator, washer and dryer included. All electric. Water is on well so no added water bill.
-
2026-03-31$260,000 Active 323-char remark
Show marketing remark (323 chars)
3 Bed, 2 Bath home on half acre lot in just outside of Covington city limits. Open kitchen, living, and dining area. Wood laminate floors in living area, and in bedrooms. Attached carport which can double as entertaining space. Refrigerator, washer and dryer included. All electric. Water is on well so no added water bill.
-
2025-06-17historical $1,750
-
2025-06-12$1,750
-
2021-08-16soldstatus $235,000
-
2021-08-13soldstatus $235,000 Closed
-
2021-07-20status Pending
-
2021-07-13$235,000 Active
-
2021-07-13$235,000
-
2020-09-14soldstatus $175,000
-
2020-09-11soldstatus $175,000 Closed
-
2020-07-10status Pending
-
2020-07-07$169,900
-
2020-07-07$169,900 Active
-
2016-10-14soldstatus $147,500 Sold
-
2016-10-11status Under Contract
-
2016-09-22historical Pending Continue to Show
-
2016-09-07price $159,900
-
2016-07-20$166,500 Active
-
2016-07-20$159,900
-
2014-08-14soldstatus $130,000
-
2014-04-18$128,500
-
2014-04-18$128,500
ⓘ Source: listings_history table (triggers on properties + properties_extension) + one-shot
backfill from property_details.listing_events for pre-trigger history.
Tax reassessment forecast LA · Resets to sale price
- Current annual tax
- $1,922 · $160/mo
- Projected year-2 tax
- $1,922 · $160/mo
- Expected delta
- $0/yr ($0/mo · 0.0%)
ⓘ Screening estimate from a state-policy table — verify with the county assessor before closing.
Climate risk First Street
- Flood 4/10 Moderate FEMA zone X · 22% chance over 30 yrs
- Wildfire 6/10 Major
- Heat 9/10 Extreme 7 d/yr ≥109°F today · 22 d/yr by 30 yrs out
- Wind 9/10 Extreme 99% chance of damaging wind over 30 yrs
- Air quality 2/10 Low 0 unhealthy d/yr today · 1 by 30 yrs out
Nearby sold comps map
Loading sold comps map…
Walkable amenities ~0.75 mi
Loading nearby amenities…
Taxation est. · year 1
- Rental income
- $27,680
- − Mortgage interest
- −$14,004
- − Property taxes
- −$1,922
- − Insurance
- −$1,250
- − Repairs & maintenance
- −$2,214
- − Management
- −$2,214
- − Depreciation
- −$7,273
- Taxable loss
- −$1,198
- Est. tax savings @ 24.0%
- +$287
- After-tax cash flow
- $3,250/yr
For passive investors: Depreciation is non-cash, so a rental often shows a tax loss while cash-flowing — sheltering income. Rental losses are passive: they offset passive income freely, and up to $25,000/yr can offset ordinary (W-2) income if you actively participate and your MAGI is under $100k (phasing out to $0 by $150k); unused losses carry forward. On sale, claimed depreciation is recaptured at up to 25%, and gains may owe capital-gains tax (a 1031 exchange can defer both). Figures are a year-1 estimate at your 24.0% rate — not tax advice; consult a CPA.
Schools (NCES district)
- District
- St. Tammany Parish
- NCES district ID
- 2201650
- Math proficiency
- 43% ▼ -32.00%
- Reading proficiency
- 55% ▼ -26.00%
- Median HH income
- $61,752
- Composite
- 43.04/100
- National rank
- #3098
- State rank
- #11 of 98 in LA
Livability — Covington
- Score
- 75/100
- State rank
- #17
- US rank
- #3876
Category grades
Schools grade is shown separately in the Schools card above.
Census & demographics
- County
- Saint Tammany Parish · 228,296 people
- City population
- 64,351
- Metro
- New Orleans-Metairie, LA
- Population (ZIP)
- 22,475
- Household income
- $80,926
- Rent vs Own
- Severe rent burden
- 296.0
Population outlook (St. Tammany County) Hauer SSP2
- Today (2025)
- 286,725 people
- By 2030
- 304,175 · +6.1%
- By 2040
- 336,203 · +17.3%
- By 2050
- 364,590 · +27.2%
- By 2075
- 433,362 · +51.1%
- By 2100
- 470,333 · +64.0%
Race, ethnicity, and origin ACS 2023
- Neighborhood character
- Predominantly White (84%)
- Race & ethnicity
- White 84% Black 9% Two or more races 4% Hispanic / Latino 3% Pacific Islander 2%
- Common ancestry
- Lithuanian 15% Serbian 1% Slovak 1%
- Foreign-born
- 2% · Canada
- Languages at home
- 97% English-only · Spanish 1% French/Haitian/Cajun 1%
Political lean MEDSL · St. Tammany
- 2024 margin
- Solid R (+43.8) · D 27.3% · R 71.1% · Other 1.6%
- 2008→2024 swing
- +9.6pp toward D · 2008: -53.4pp · 2024: -43.8pp
- All cycles
- 2024: R+43.8 2020: R+44.2 2016: R+50.8 2012: R+52.2 2008: R+53.4
Not yet ingested
- Civics
- —
Market trends
- HPI YoY
- ▼ -76.03%
- Current HPI
- 202.0458
- Rent YoY
- —
- Metro
- New Orleans-Metairie, LA
- State GDP YoY
- ▲ 3.29%
- F500 in state
- 10
Industry mix (Fortune 500 HQ in LA)
| Industry | F500 HQs | Revenue |
|---|---|---|
| Telecommunications | 2 | $23B |
|
||
| Utilities | 1 | $12B |
|
||
| Wholesale / Distribution | 1 | $5B |
|
||
| Advertising | 1 | $2B |
|
||
Price history
+98.4% since first listed25 events — show timeline
- 2026-04-20 Price Changed $255,000 AcadianaMLS
- 2026-04-20 Price Changed $255,000 GSREIN
- 2026-03-31 Listed $260,000 GSREIN
- 2026-03-31 Listed $260,000 AcadianaMLS
- 2025-06-17 Rental Removed $1,750 GSREIN
- 2025-06-12 Listed for Rent $1,750 GSREIN
- 2021-08-16 Sold (Public Records) $235,000 Public Records
- 2021-08-13 Sold (MLS) $235,000 GSREIN
- 2021-07-20 Pending — GSREIN
- 2021-07-13 Listed $235,000 AcadianaMLS
- 2021-07-13 Listed $235,000 GSREIN
- 2020-09-14 Sold (Public Records) $175,000 Public Records
- 2020-09-11 Sold (MLS) $175,000 GSREIN
- 2020-07-10 Pending — GSREIN
- 2020-07-07 Listed $169,900 GSREIN
- 2020-07-07 Listed $169,900 AcadianaMLS
- 2016-10-14 Sold (MLS) $147,500 GSREIN
- 2016-10-11 Pending — GSREIN
- 2016-09-22 Contingent — GSREIN
- 2016-09-07 Price Changed $159,900 GSREIN
- 2016-07-20 Listed $166,500 GSREIN
- 2016-07-20 Listed $159,900 AcadianaMLS
- 2014-08-14 Sold (MLS) $130,000 GSREIN
- 2014-04-18 Listed $128,500 AcadianaMLS
- 2014-04-18 Listed $128,500 GSREIN
Property tax history
+1.9%/yrLatest (2025): $1,922 · +71.2% YoY. Source: county tax records.
Cash-flow waterfall
monthlySold comps — $/sqft
last 12 mo · ≤1 miLoading sold comps…