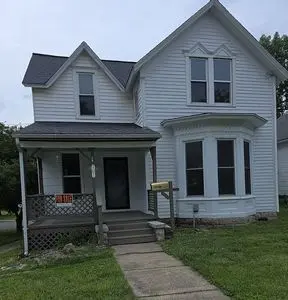
701 N Main St · Brookfield, MO
Flood risk 1/10 · Minimal
- FEMA flood zone
- X (unshaded)
- Chance of flooding over 30 yrs
- 0.0%
- Est. flood insurance / yr
- $473 – $860
Fire risk 3/10 · Minor
- Est. fire insurance / yr
- $1,054 – $1,958
Heat risk 4/10 · Minor
- Hot days now (above 106°F)
- 7 days/yr
- Hot days in 30 yrs
- 16 days/yr
Wind risk 2/10 · Minimal
- Chance of severe wind over 30 yrs
- —
Air-quality risk 1/10 · Minimal
- Unhealthy air days now
- 0 days/yr
- Unhealthy air days in 30 yrs
- 0 days/yr
Risk factors via First Street. Map © Google.
Why this score? — see what drove the C- grade
The composite is a weighted blend of 9 inputs, each scored 0–100. Each bar is that input's sub-score; the figure is the points it added to the 100-point composite (weight × sub-score).
- Cash flow +16.0/30.0
- ARV discount +7.5/15.0
- Appreciation +6.5/10.0
- DSCR +5.0/10.0
- Schools +4.2/10.0
- Livability +3.2/5.0
- 1% rule +3.1/10.0
- Rent growth +2.5/5.0
- Condition / age +2.5/5.0
$125,000
🖨 Deal sheet 📄 Offer letter ✓ Due diligence
Listing remarks
4 Bdrm, 1 bath home on N. Main St, in Brookfield, MO. This 100 year old home, built during a time when homes were built by craftsmen, has been totally renovated to include a new kitchen, new flooring throughout, new paint throughout the home. The hardwood floors upstairs have been refinished. The updated bathroom has a new shower surround, new flooring, and a new toilet (but we kept the great cast iron tub that you can& apos; t find anymore!) New gas stove with microwave above in the kitchen. New kitchen cabinets. Nice sized first floor laundry room. New windows throughout the home. New Central Air has just been installed. 1 year-old gas furnace. Electric has been updated throughout the
Key facts
- New kitchen
- New flooring
- New gas stove
Tags
Neighborhood map
What this means for you Summary
Snapshot
- This is a 3-bed/1.0-bath single-family listed at $125k.
Deal economics
- At list price, monthly cash flow is $62 ($748/yr) — positive.
- The deal already cash-flows at list — no discount required.
- To meet the 1% rule (rent ≥ 1% of price), the offer needs to be $102k (18.5% below list).
- Recommended offer: $102k (18.5% below list) — sets the bar for 1% rule.
Location & tenants
- Location reads 65/100 on livability (#278 in MO) — a middle-class / working-renter tenant base. Strengths: crime A+, cost of living A+, housing A+; Watch: employment D+, schools D, amenities F.
- Brookfield R-III (rural): math 46% / reading 55% proficiency, ranked #45 of 324 in MO (top 14%) — acceptable for families but not a draw, mixed tenant base, ~2y average lease.
- Market conditions: 41 active listings in the ZIP; 4 units permitted in Linn County in 2024 (0 in 5+ unit buildings).
Forward outlook
- In year one you build about $4k of equity ($864 loan paydown + $4k appreciation (2.9% local appreciation)).
- Linn County population projected at -21% by 2050 — secular population decline; favor cash flow + early exit over multi-decade hold.
- At projected returns (2.9% appreciation + 3.0% rent growth), your $35k cash investment doubles in ~6 years — after that, you're playing with house money.
- By year 8, paydown + projected appreciation supports a ~$33k cash-out refi (75% LTV) — recoverable capital for the next deal without selling this one.
Negotiation context
- It's been on market 16 days — a 2% lower offer ($123k) is reasonable based on typical stale-listing flexibility.
Risks & watch-outs
- Watch-outs: built in 1910 — expect roof / HVAC / electrical / plumbing capex.
Questions for the listing agent
- Built in 1910 — when were the roof, HVAC, electrical panel, plumbing, and water heater last replaced?
- Is there a deadline driving the sale (1031 exchange, divorce, estate, relocation)? That informs how much negotiation room exists.
- Schools are D-rated, which usually means shorter tenancies and higher turnover. Who's the typical renter profile here, and what's been the actual vacancy rate?
- What's the average days-on-market for RENTAL listings here right now (not sales)? A rising rental-DOM trend means longer vacancies and softer asking-rent achievability than the comps imply.
- What's the recent tenant-quality profile in this submarket — average credit score on applications, eviction rate, late-payment / NSF rate, and stable-employment percentage? A property-management company in the area should have these aggregated.
- How much new for-sale + rental construction is in the pipeline within 1–3 miles? Heavy new supply typically softens prices + rents 12–24 months out; constrained supply supports both.
Investment metrics
- 1% rule
- 0.81% ✗
- Cap rate
- 6.89%
- Cash-on-cash
- 2.14%
- DSCR
- 1.10
- GRM
- 10.2
CMA / ARV
- ARV (on-the-fly)
- $79,170
- Comps found
- 3
Show comp detail 3 sales within ~0.75 mi
| Address | Dist | Beds/Ba | Sqft | Sold | Price | $/sf | Match |
|---|---|---|---|---|---|---|---|
| 1301 N Main St | 0.48mi | 2/2.5 (-1) | 1,229 (+1%) | 13mo | $128,900 | $105 | 55 |
| 417 Laclede Ave | 0.30mi | 2/1.0 (-1) | 1,040 (-15%) | 3mo | $68,000 | $65 | 54 |
| 215 Market St | 0.69mi | 2/1.0 (-1) | 1,067 (-12%) | 10mo | $34,900 | $33 | 34 |
Match score weights: distance 35% · size 25% · config 20% · recency 20%. Top-matched comps best support the ARV.
Projected returns pro-forma
2.91% appreciation · 3.0% rent growth · sell at horizon
- IRR
- 9.2%
- Equity multiple
- 1.52×
- Total profit
- $18,342
- Equity at exit
- $55,541
- IRR
- 11.7%
- Equity multiple
- 2.73×
- Total profit
- $60,452
- Equity at exit
- $85,083
Cash invested: $35,000 (down + closing). Projections, not guarantees.
Landlord ↔ Tenant lean methodology
- Overall (STATE)
- 81 Strongly Landlord-Friendly
- State Missouri
- 81 Strongly Landlord-Friendly · R+10
- County
- — inherits STATE
- City
- — inherits STATE
ZIP-level market 64628
- Home prices YoY
- 1.3%
- Active inventory
- 41
- Price-to-rent
- 10.2×
Monthly cashflow live
- Estimated rent
- $1,019 medium interval (Pro) →
- Mortgage (P&I)
- −$656
- Tax from tax record
- −$35 /mo · $418/yr
- Insurance
- −$52
- HOA
- −$0
- Vacancy / Maint / Mgmt
- −$214
- Net cashflow
- $62
Break-even live
UW: 25.0% down · 7.5% · 30yr · 1.5% tax · 5.0% vac · 8.0% maint · 8.0% mgmt
Financing live
Cash to close
- Down payment
- $31,250
- Closing costs
- $3,750
- Reserves months
- —
- Total cash needed
- —
Loan-product check · same deal, 3 products live
Conventional
25% down · 7.5% · 30yr
- Down + closing
- —
- Monthly P&I
- —
- Monthly cashflow
- —
- DSCR
- —
- Eligible?
- —
Personal DTI + credit; lowest rate.
DSCR
20% down · 8.5% · 30yr
- Down + closing
- —
- Monthly P&I
- —
- Monthly cashflow
- —
- DSCR
- —
- Eligible?
- —
No personal income docs; deal must DSCR.
Hard money
10% down · 12.0% · 12mo
- Down + closing
- —
- Monthly P&I
- —
- Monthly cashflow
- —
- DSCR
- —
- Eligible?
- —
Short-term bridge; refi at stabilization.
Listing history 12 events
-
2026-06-16days on market $125,000 Active 16 DOM
-
2026-06-15days on market $125,000 Active 15 DOM
-
2026-06-13days on market $125,000 Active 13 DOM
-
2026-06-12days on market $125,000 Active 12 DOM
-
2026-06-09days on market $125,000 Active 9 DOM
-
2026-06-08days on market $125,000 Active 8 DOM
-
2026-06-07days on market $125,000 Active 7 DOM
-
2026-06-07days on market $125,000 Active 6 DOM
-
2026-06-04days on market $125,000 Active 3 DOM
-
2026-06-02days on market $125,000 Active 2 DOM
-
2026-06-01remarks 695-char remark
-
2026-06-01$125,000 Active 1 DOM
ⓘ Source: listings_history table (triggers on properties + properties_extension) + one-shot
backfill from property_details.listing_events for pre-trigger history.
Tax reassessment forecast MO · Resets to sale price
- Current annual tax
- $418 · $35/mo
- Projected year-2 tax
- $1,212 · $101/mo
- Expected delta
- +$795/yr (+$66/mo · 190.1%)
ⓘ Screening estimate from a state-policy table — verify with the county assessor before closing.
Climate risk First Street
- Flood 1/10 Low FEMA zone X (unshaded) · 0% chance over 30 yrs
- Wildfire 3/10 Moderate
- Heat 4/10 Moderate 7 d/yr ≥106°F today · 16 d/yr by 30 yrs out
- Wind 2/10 Low
- Air quality 1/10 Low 0 unhealthy d/yr today · 0 by 30 yrs out
Nearby sold comps map
Loading sold comps map…
Walkable amenities ~0.75 mi
Loading nearby amenities…
Taxation est. · year 1
- Rental income
- $12,224
- − Mortgage interest
- −$7,002
- − Property taxes
- −$418
- − Insurance
- −$625
- − Repairs & maintenance
- −$978
- − Management
- −$978
- − Depreciation
- −$3,636
- Taxable loss
- −$1,413
- Est. tax savings @ 24.0%
- +$339
- After-tax cash flow
- $1,087/yr
For passive investors: Depreciation is non-cash, so a rental often shows a tax loss while cash-flowing — sheltering income. Rental losses are passive: they offset passive income freely, and up to $25,000/yr can offset ordinary (W-2) income if you actively participate and your MAGI is under $100k (phasing out to $0 by $150k); unused losses carry forward. On sale, claimed depreciation is recaptured at up to 25%, and gains may owe capital-gains tax (a 1031 exchange can defer both). Figures are a year-1 estimate at your 24.0% rate — not tax advice; consult a CPA.
Schools (NCES district)
- District
- Brookfield R-III
- NCES district ID
- 2905940
- Math proficiency
- 46% ▼ -1.00%
- Reading proficiency
- 55% ▲ 4.00%
- Median HH income
- $37,022
- Composite
- 41.93/100
- National rank
- #3355
- State rank
- #45 of 324 in MO
Livability — Brookfield
- Score
- 65/100
- State rank
- #278
- US rank
- #13057
Category grades
Schools grade is shown separately in the Schools card above.
Census & demographics
- Census place
- Brookfield, MO
- Population (ZIP)
- 5,602
Population outlook (Linn County) Hauer SSP2
- Today (2025)
- 11,437 people
- By 2030
- 10,946 · -4.3%
- By 2040
- 9,969 · -12.8%
- By 2050
- 9,056 · -20.8%
- By 2075
- 7,342 · -35.8%
- By 2100
- 5,656 · -50.5%
Race, ethnicity, and origin ACS 2023
- Neighborhood character
- Predominantly White (93%)
- Race & ethnicity
- White 93% Two or more races 4% Hispanic / Latino 3%
- Common ancestry
- Lithuanian 2% Serbian 1% Italian 1%
- Foreign-born
- 1% · Canada
Political lean MEDSL · Linn
- 2024 margin
- Solid R (+57.2) · D 20.8% · R 78.1% · Other 1.1%
- 2008→2024 swing
- -48.8pp toward R · 2008: -8.5pp · 2024: -57.2pp
- All cycles
- 2024: R+57.2 2020: R+53.9 2016: R+51.1 2012: R+23.5 2008: R+8.5
Not yet ingested
- Civics
- —
Market trends
- HPI YoY
- ▲ 2.91%
- Current HPI
- 219.7856
- Rent YoY
- —
- Metro
- —
- State GDP YoY
- ▲ 1.84%
- F500 in state
- 20
Industry mix (Fortune 500 HQ in MO)
| Industry | F500 HQs | Revenue |
|---|---|---|
| Healthcare | 1 | $163B |
|
||
| Insurance | 1 | $21B |
|
||
| Industrial Technology | 1 | $17B |
|
||
| Retail | 1 | $16B |
|
||
| Industrial Distribution | 1 | $10B |
|
||
| Utilities | 1 | $9B |
|
||
Price history
2 events — show timeline
- 2026-06-01 Listed $125,000 FSBO.com
- 1997-02-10 Sold (Public Records) — Public Records
Property tax history
+1.4%/yrLatest (2025): $418 · +4.2% YoY. Source: county tax records.
Cash-flow waterfall
monthlySold comps — $/sqft
last 12 mo · ≤1 miLoading sold comps…