212 Orland St #19 · Las Vegas, NV
Flood risk No data
- FEMA flood zone
- —
- Chance of flooding over 30 yrs
- —
- Est. flood insurance / yr
- —
Fire risk No data
- Est. fire insurance / yr
- —
Heat risk No data
- Hot days now (above threshold)
- —
- Hot days in 30 yrs
- —
Wind risk No data
- Chance of severe wind over 30 yrs
- —
Air-quality risk No data
- Unhealthy air days now
- —
- Unhealthy air days in 30 yrs
- —
Risk factors via First Street. Map © Google.
Why this score? — see what drove the D grade
The composite is a weighted blend of 9 inputs, each scored 0–100. Each bar is that input's sub-score; the figure is the points it added to the 100-point composite (weight × sub-score).
- Cash flow +13.3/30.0
- ARV discount +7.5/15.0
- 1% rule +6.0/10.0
- DSCR +4.0/10.0
- Livability +4.0/5.0
- Schools +2.6/10.0
- Condition / age +2.5/5.0
- Rent growth +2.2/5.0
- Appreciation +0.0/10.0
$105,000
🖨 Deal sheet (PDF) 📄 Offer letter ✓ Due diligence
Listing remarks MLS
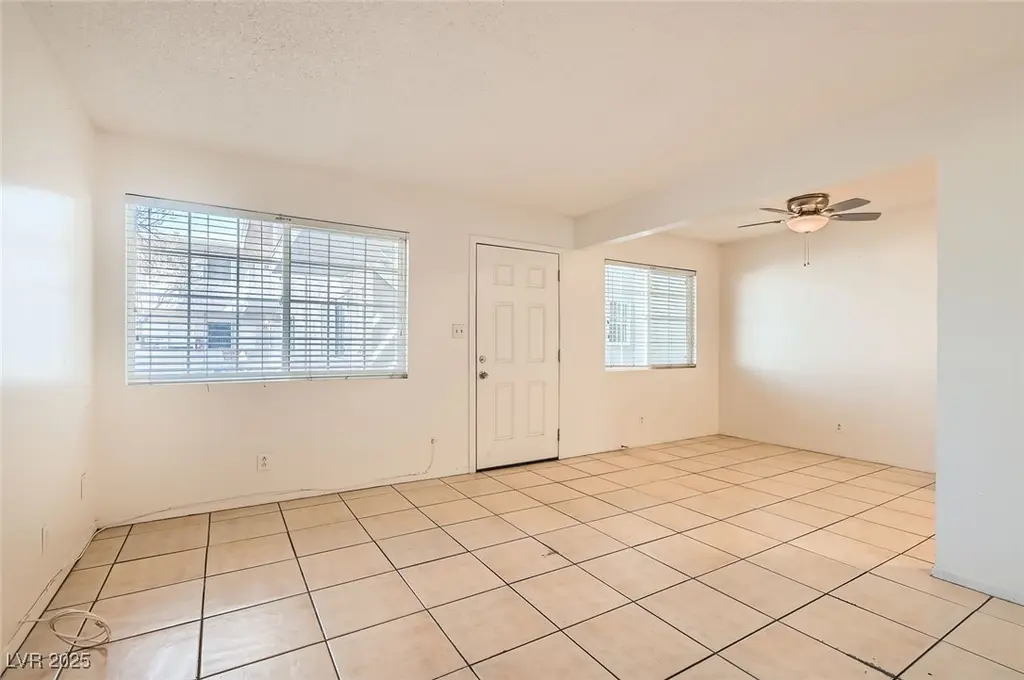
HUGE REDUCTION! Welcome Home! This charming 1-bedroom, 1-bathroom home offers a smart layout with plenty of storage space. Conveniently located on the ground floor at the heart of the community, you'll enjoy easy access to freeway and shopping. Relax by the sparkling community pool or stroll through the neighborhood. Could be a great investment opportunity or just simple, convenient way of living Close to shopping, dining and the Fabulous Las Vegas Strip!
Key facts
- Smart layout
- Community pool
- Ground floor
Tags
Neighborhood map
What this means for you Summary
Snapshot
- This is a 1-bed/1.0-bath condo listed at $105k.
Deal economics
- At list price, monthly cash flow is $0 ($-3/yr) — negative.
- To cash-flow at today's rent, offer at most $105k (0.0% below list).
- Meets the 1% rule at list price ($1k rent vs $105k).
- Recommended offer: $92k (12.0% below list) — sets the bar for market timing.
Location & tenants
- Location reads 80/100 on livability (#2 in NV, #1,723 nationally) — a professional / high-income tenant draw. Strengths: amenities A+, commute A+, housing A+; Watch: crime F.
- Clark County School District (urban): math 21% / reading 39% proficiency, ranked #11 of 17 in NV (top 65%) — families likely to look elsewhere, expect single-tenant / working-renter base with shorter leases.
- Zoned schools: Mcwilliams J T Es (math 12% / reading 23%, grade F, #307 of 402 statewide, top 77%, 684 students, 100% FRL); Gibson Robert O Ms Leadership Academy (math 12% / reading 26%, grade F, #80 of 109 statewide, top 73%, 1,195 students, 100% FRL); Western Hs (math 3% / reading 13%, grade F, #129 of 131 statewide, top 98%, 2,949 students, 100% FRL) — zoned schools average 100% FRL vs 52% district-wide (48 pts higher); higher-poverty schools than district average — tighter screening recommended.
- Zoned-school proficiency averages 15% at this address vs 30% district-wide (-15 pts) — the specific schools serving this property underperform the Clark County School District average; the district grade overstates school quality for this exact location.
- Market conditions: Rents soft (-1.1%/yr); 148 active listings in the ZIP; 17 comparable units currently listed for rent nearby; rentals lingering (median 46d on market — plan ~5-8 weeks vacancy on turnover, expect pricing pressure); 100% of comp listings sitting > 30 days — soft ceiling on asking rent; 14,754 units permitted in Clark County in 2024 (2,301 in 5+ unit buildings).
Forward outlook
- Local home prices are declining (-3.0%/yr); year-one equity from $726 of loan paydown is wiped out by about $3k of value loss. Plan a longer hold.
- Clark County population projected at +36% by 2050 — long-run rental-demand tailwind backs the buy-and-hold thesis.
Negotiation context
- It's been on market 419 days — a 12% lower offer ($92k) is reasonable based on typical stale-listing flexibility.
- 7 sale attempts since 18y ago; this cycle's ask has dropped $30k (22%) from the opening price — seller is motivated, your offer sets the floor, not the list.
Risks & watch-outs
- Watch-outs: HOA is 25% of rent.
Questions for the listing agent
- What do current leases actually rent for vs. the listed asking? Can we see a recent rent roll and the last 12 months of T-12 income?
- It's been on market 419 days. Have you received any prior offers? Is the seller open to a 12% concession, seller financing, or rate buy-down credit?
- Built in 1963 — when were the roof, HVAC, electrical panel, plumbing, and water heater last replaced?
- What does the HOA fee cover, when was the last increase, and are there any pending special assessments or reserve-fund shortfalls?
- Any open or pending special assessments — roof, HVAC, plumbing, elevator, façade? What's the per-unit balance and payoff schedule, and is the seller paying it off at close or rolling it to the buyer?
- Why hasn't it sold? Are there any deal-killer items the seller is aware of (foundation, flood, title, zoning, code violations)?
- Is there a deadline driving the sale (1031 exchange, divorce, estate, relocation)? That informs how much negotiation room exists.
- Crime grade is F in this area — have there been break-ins, vandalism, or insurance claims at this property in the last 3 years? What carrier currently insures it and at what premium?
- The area grade is low — what's the realistic commute time and amenity access for the typical tenant pool here? Any planned neighborhood developments (good or bad) we should know about?
- What's the average days-on-market for RENTAL listings here right now (not sales)? A rising rental-DOM trend means longer vacancies and softer asking-rent achievability than the comps imply.
- What's the recent tenant-quality profile in this submarket — average credit score on applications, eviction rate, late-payment / NSF rate, and stable-employment percentage? A property-management company in the area should have these aggregated.
- How much new apartment / multifamily construction is in the pipeline within 1–3 miles? Heavy new supply (>2% of stock underway) typically softens rents 12–24 months out; light construction supports rent growth.
Investment metrics
- 1% rule
- 1.10% ✓
- Cap rate
- 6.29%
- Cash-on-cash
- -0.01%
- DSCR
- 1.00
- GRM
- 7.6
CMA / ARV
No comps found within radius.
Projected returns pro-forma
-3.0% appreciation · 0.0% rent growth · sell at horizon
- IRR
- -20.5%
- Equity multiple
- 0.31×
- Total profit
- $-20,290
- Equity at exit
- $15,656
- IRR
- -25.7%
- Equity multiple
- -0.03×
- Total profit
- $-30,265
- Equity at exit
- $9,078
Cash invested: $29,400 (down + closing). Projections, not guarantees.
Landlord ↔ Tenant lean methodology
- Overall (STATE)
- 71 Landlord-Friendly
- State Nevada
- 71 Landlord-Friendly · R+1
- County
- — inherits STATE
- City
- — inherits STATE
ZIP-level market 89107
- Rents YoY
- -1.1%
- Active inventory
- 148
- Price-to-rent
- 7.6×
Monthly cashflow live
- Estimated rent
- $1,159 high interval (Pro) →
- Mortgage (P&I)
- −$551
- Tax from tax record
- −$26 /mo · $315/yr
- Insurance
- −$44
- HOA
- −$295
- Vacancy / Maint / Mgmt
- −$243
- Net cashflow
- $-0
Break-even live
Sensitivity live
| Price | -10% $59 | -5% $29 | +0% $0 | +5% $-30 | +10% $-60 |
|---|---|---|---|---|---|
| Rent | -10% $-92 | -5% $-46 | +0% $0 | +5% $46 | +10% $91 |
| Rate | -1.0pp $53 | -0.5pp $26 | base $0 | +0.5pp $-27 | +1.0pp $-55 |
UW: 25.0% down · 7.5% · 30yr · 1.5% tax · 5.0% vac · 8.0% maint · 8.0% mgmt
Financing live
Cash to close
- Down payment
- $26,250
- Closing costs
- $3,150
- Reserves months
- —
- Total cash needed
- —
Loan-product check · same deal, 3 products live
Conventional
25% down · 7.5% · 30yr
- Down + closing
- —
- Monthly P&I
- —
- Monthly cashflow
- —
- DSCR
- —
- Eligible?
- —
Personal DTI + credit; lowest rate.
DSCR
20% down · 8.5% · 30yr
- Down + closing
- —
- Monthly P&I
- —
- Monthly cashflow
- —
- DSCR
- —
- Eligible?
- —
No personal income docs; deal must DSCR.
Hard money
10% down · 12.0% · 12mo
- Down + closing
- —
- Monthly P&I
- —
- Monthly cashflow
- —
- DSCR
- —
- Eligible?
- —
Short-term bridge; refi at stabilization.
Rent comps 17 comps
| Address | Beds | Baths | Sqft | Rent | $/sqft | DOM | Units | Dist |
|---|---|---|---|---|---|---|---|---|
| 212 Orland St #28 Las Vegas, NV | 2.0 | 1.0 | 748 | $1,250 | $1.67 | 45d | 1 | 0.01mi |
| 304 Orland St #38 Las Vegas, NV | 1.0 | 1.0 | 612 | $1,190 | $1.94 | 45d | 1 | 0.02mi |
| 204 Orland St #7 Las Vegas, NV | 1.0 | 1.0 | 612 | $1,005 | $1.64 | 45d | 1 | 0.04mi |
| 6363 Clarice Ave Las Vegas, NV | 1.0–2.0 | 1.0–2.0 | 752 | $1,024 | $1.36 | 45d | 6 | 0.60mi |
| 6250 Hargrove Ave Las Vegas, NV | 1.0–2.0 | 1.0–2.0 | 762 | $1,130 | $1.48 | 45d | 8 | 0.60mi |
| 240 Mission Catalina Ln #206 Las Vegas, NV | 1.0 | 1.0 | 660 | $1,100 | $1.67 | 45d | 1 | 0.62mi |
| 6020 Carmen Blvd Las Vegas, NV | 1.0 | 1.0 | 576 | $1,150 | $2.00 | 45d | 1 | 0.64mi |
| 300 Promenade Blvd Las Vegas, NV | 1.0 | 1.0 | 540 | $1,008 | $1.87 | 45d | 7 | 0.69mi |
| 500 N Decatur Blvd Unit 2 Las Vegas, NV | 1.0 | 1.0 | 475 | $1,068 | $2.25 | 45d | 1 | 0.77mi |
| 5800 W Charleston Blvd Las Vegas, NV | 1.0–3.0 | 1.0–2.0 | 950 | $1,400 | $1.47 | 45d | 1 | 1.07mi |
| 4480 Meadows Ln Las Vegas, NV | 2.0 | 1.0–2.0 | 791 | $1,709 | $2.16 | 45d | 28 | 1.11mi |
| 1901 N Jones Blvd Las Vegas, NV | 1.0–3.0 | 1.0–2.0 | 825 | $989 | $1.20 | 45d | 1 | 1.17mi |
| 6666 W Washington Ave Las Vegas, NV | 2.0 | 1.0–2.0 | 645 | $1,220 | $1.89 | 45d | 48 | 1.20mi |
| 6661 Silverstream Ave Las Vegas, NV | 1.0–2.0 | 1.0–2.0 | 881 | $1,261 | $1.43 | 45d | 7 | 1.20mi |
| 1799 N Decatur Blvd Las Vegas, NV | 1.0–2.0 | 1.0–2.0 | 892 | $1,180 | $1.32 | 45d | 13 | 1.28mi |
| 1951 N Jones Blvd Las Vegas, NV | 1.0–3.0 | 1.0–2.0 | 950 | $1,060 | $1.12 | 45d | 1 | 1.30mi |
| 5800 W Lake Mead Blvd Las Vegas, NV | 1.0–2.0 | 1.0–2.0 | 689 | $1,127 | $1.63 | 45d | 14 | 1.41mi |
HOA detail condo
- Monthly dues
- $295 · $3,540/yr
- Likely covers
- gaspool
- Assessments
- None detected in remarks — confirm with the listing agent.
Listing history 41 events
-
2026-06-21days on market $105,000 Active 419 DOM
-
2026-06-18days on market $105,000 Active 416 DOM
-
2026-06-17days on market $105,000 Active 415 DOM
-
2026-06-16days on market $105,000 Active 414 DOM
-
2026-06-15days on market $105,000 Active 413 DOM
-
2026-06-13days on market $105,000 Active 411 DOM
-
2026-06-09days on market $105,000 Active 407 DOM
-
2026-06-08days on market $105,000 Active 406 DOM
-
2026-06-08days on market $105,000 Active 405 DOM
-
2026-06-03days on market $105,000 Active 401 DOM
-
2026-06-02days on market $105,000 Active 400 DOM
-
2026-06-01days on market $105,000 Active 399 DOM
-
2026-05-31days on market $105,000 Active 398 DOM
-
2025-12-23price $105,000 461-char remark
Show marketing remark (461 chars)
HUGE REDUCTION! Welcome Home! This charming 1-bedroom, 1-bathroom home offers a smart layout with plenty of storage space. Conveniently located on the ground floor at the heart of the community, you'll enjoy easy access to freeway and shopping. Relax by the sparkling community pool or stroll through the neighborhood. Could be a great investment opportunity or just simple, convenient way of living Close to shopping, dining and the Fabulous Las Vegas Strip!
-
2025-09-16price $110,000 461-char remark
Show marketing remark (461 chars)
HUGE REDUCTION! Welcome Home! This charming 1-bedroom, 1-bathroom home offers a smart layout with plenty of storage space. Conveniently located on the ground floor at the heart of the community, you'll enjoy easy access to freeway and shopping. Relax by the sparkling community pool or stroll through the neighborhood. Could be a great investment opportunity or just simple, convenient way of living Close to shopping, dining and the Fabulous Las Vegas Strip!
-
2025-04-28$135,000 Active 461-char remark
Show marketing remark (461 chars)
HUGE REDUCTION! Welcome Home! This charming 1-bedroom, 1-bathroom home offers a smart layout with plenty of storage space. Conveniently located on the ground floor at the heart of the community, you'll enjoy easy access to freeway and shopping. Relax by the sparkling community pool or stroll through the neighborhood. Could be a great investment opportunity or just simple, convenient way of living Close to shopping, dining and the Fabulous Las Vegas Strip!
-
2024-12-27soldstatus $134,000 Closed 292-char remark
Show marketing remark (292 chars)
Welcome Home! This cozy 1 Bedroom 1 Bath home has a great layout and plenty of storage! Home is located on the ground floor right in the middle of the community. Sparkling Blue community Pool, Manicured Landscaping and Coin Operated Laundry are among the many features this home has to offer.
-
2024-12-27soldstatus $134,000
Show marketing remark (292 chars)
Welcome Home! This cozy 1 Bedroom 1 Bath home has a great layout and plenty of storage! Home is located on the ground floor right in the middle of the community. Sparkling Blue community Pool, Manicured Landscaping and Coin Operated Laundry are among the many features this home has to offer.
-
2024-10-10status Pending 292-char remark
Show marketing remark (292 chars)
Welcome Home! This cozy 1 Bedroom 1 Bath home has a great layout and plenty of storage! Home is located on the ground floor right in the middle of the community. Sparkling Blue community Pool, Manicured Landscaping and Coin Operated Laundry are among the many features this home has to offer.
-
2024-04-26price $134,000 292-char remark
Show marketing remark (292 chars)
Welcome Home! This cozy 1 Bedroom 1 Bath home has a great layout and plenty of storage! Home is located on the ground floor right in the middle of the community. Sparkling Blue community Pool, Manicured Landscaping and Coin Operated Laundry are among the many features this home has to offer.
-
2023-10-02$135,000 Active 292-char remark
Show marketing remark (292 chars)
Welcome Home! This cozy 1 Bedroom 1 Bath home has a great layout and plenty of storage! Home is located on the ground floor right in the middle of the community. Sparkling Blue community Pool, Manicured Landscaping and Coin Operated Laundry are among the many features this home has to offer.
-
2022-06-23soldstatus $120,000 Closed
-
2022-06-23soldstatus $120,000
-
2022-05-24status Pending
-
2022-05-16$120,000 Active
-
2021-10-08historical
-
2021-06-09$120,000 Active
-
2017-10-24soldstatus $50,000 Sold
-
2017-10-24soldstatus $50,000
-
2017-10-06historical Contingent Offer
-
2017-09-22$55,000 Active
-
2014-05-21soldstatus $26,500 Sold
-
2014-05-21soldstatus $26,500
-
2014-04-21status Pending
-
2014-01-28$28,500 Exclusive Right
-
2010-02-03historical
-
2010-02-03soldstatus $19,999
-
2008-12-10$19,999
-
1995-01-13soldstatus $32,500
-
1991-12-26soldstatus $32,500
-
1983-10-10soldstatus $33,000
ⓘ Source: listings_history table (triggers on properties + properties_extension) + one-shot
backfill from property_details.listing_events for pre-trigger history.
Tax reassessment forecast NV · Resets to sale price
- Current annual tax
- $315 · $26/mo
- Projected year-2 tax
- $620 · $52/mo
- Expected delta
- +$305/yr (+$25/mo · 96.9%)
ⓘ Screening estimate from a state-policy table — verify with the county assessor before closing.
Nearby sold comps map
Loading sold comps map…
Walkable amenities ~0.75 mi
Loading nearby amenities…
Taxation est. · year 1
- Rental income
- $13,904
- − Mortgage interest
- −$5,882
- − Property taxes
- −$315
- − Insurance
- −$525
- − Repairs & maintenance
- −$1,112
- − Management
- −$1,112
- − HOA
- −$3,540
- − Depreciation
- −$3,055
- Taxable loss
- −$1,636
- Est. tax savings @ 24.0%
- +$393
- After-tax cash flow
- $390/yr
For passive investors: Depreciation is non-cash, so a rental often shows a tax loss while cash-flowing — sheltering income. Rental losses are passive: they offset passive income freely, and up to $25,000/yr can offset ordinary (W-2) income if you actively participate and your MAGI is under $100k (phasing out to $0 by $150k); unused losses carry forward. On sale, claimed depreciation is recaptured at up to 25%, and gains may owe capital-gains tax (a 1031 exchange can defer both). Figures are a year-1 estimate at your 24.0% rate — not tax advice; consult a CPA.
Schools (NCES district)
- District
- Clark County School District
- NCES district ID
- 3200060
- Math proficiency
- 21% ▼ -13.00%
- Reading proficiency
- 39% ▼ -8.00%
- Median HH income
- $53,611
- Composite
- 26.48/100
- National rank
- #7211
- State rank
- #11 of 17 in NV
Livability — Las Vegas
- Score
- 80/100
- State rank
- #2
- US rank
- #1723
Category grades
Schools grade is shown separately in the Schools card above.
Census & demographics
- Census place
- Las Vegas, NV
- County
- Clark County · 2,306,105 people
- City population
- 1,643,591
- Metro
- Las Vegas-Henderson-Paradise, NV
- Population (ZIP)
- 37,063
- Household income
- $59,571
- Rent vs Own
- Severe rent burden
- 1325.0
Population outlook (Clark County) Hauer SSP2
- Today (2025)
- 2,504,101 people
- By 2030
- 2,693,770 · +7.6%
- By 2040
- 3,061,208 · +22.2%
- By 2050
- 3,400,072 · +35.8%
- By 2075
- 4,139,522 · +65.3%
- By 2100
- 4,596,916 · +83.6%
Race, ethnicity, and origin ACS 2023
- Neighborhood character
- Diverse neighborhood (Simpson 0.64)
- Race & ethnicity
- Hispanic / Latino 53% White 26% Two or more races 19% Black 10% Asian 5% Pacific Islander 1%
- Hispanic origin (detail)
- Mexican 41% Puerto Rican 2% Cuban 3%
- Common ancestry
- Romanian 1% Italian 1% Serbian 1%
- Foreign-born
- 28% · Canada, China, Vietnam
- Languages at home
- 52% English-only · Spanish 42% Tagalog/Filipino 2% Chinese 1%
Political lean MEDSL · Clark
- 2024 margin
- Toss-up / Even · D 50.4% · R 47.8% · Other 1.7%
- 2008→2024 swing
- -16.5pp toward R · 2008: 19.1pp · 2024: 2.6pp
- All cycles
- 2024: D+2.6 2020: D+9.3 2016: D+10.7 2012: D+14.5 2008: D+19.1
Not yet ingested
- Civics
- —
Market trends
- HPI YoY
- ▼ -204.15%
- Current HPI
- 305.9419
- Rent YoY
- ▼ -1.08%
- Metro
- Las Vegas-Henderson-Paradise, NV
- State GDP YoY
- ▲ 3.08%
- F500 in state
- 6
Industry mix (Fortune 500 HQ in NV)
| Industry | F500 HQs | Revenue |
|---|---|---|
| Hotels / Casinos | 3 | $36B |
|
||
Price history
+218.2% since first listed28 events — show timeline
- 2025-12-23 Price Changed $105,000 GLVAR
- 2025-09-16 Price Changed $110,000 GLVAR
- 2025-04-28 Listed $135,000 GLVAR
- 2024-12-27 Sold (Public Records) $134,000 Public Records
- 2024-12-27 Sold (MLS) $134,000 GLVAR
- 2024-10-10 Pending — GLVAR
- 2024-04-26 Price Changed $134,000 GLVAR
- 2023-10-02 Listed $135,000 GLVAR
- 2022-06-23 Sold (Public Records) $120,000 Public Records
- 2022-06-23 Sold (MLS) $120,000 GLVAR
- 2022-05-24 Pending — GLVAR
- 2022-05-16 Listed $120,000 GLVAR
- 2021-10-08 Listing Removed — GLVAR
- 2021-06-09 Listed $120,000 GLVAR
- 2017-10-24 Sold (Public Records) $50,000 Public Records
- 2017-10-24 Sold (MLS) $50,000 GLVAR
- 2017-10-06 Contingent — GLVAR
- 2017-09-22 Listed $55,000 GLVAR
- 2014-05-21 Sold (Public Records) $26,500 Public Records
- 2014-05-21 Sold (MLS) $26,500 GLVAR
- 2014-04-21 Pending — GLVAR
- 2014-01-28 Listed $28,500 GLVAR
- 2010-02-03 Sold (MLS) $19,999 GLVAR
- 2010-02-03 Listing Removed — GLVAR
- 2008-12-10 Listed $19,999 GLVAR
- 1995-01-13 Sold (Public Records) $32,500 Public Records
- 1991-12-26 Sold (Public Records) $32,500 Public Records
- 1983-10-10 Sold (Public Records) $33,000 Public Records
Property tax history
-1.0%/yrLatest (2025): $315 · +7.0% YoY. Source: county tax records.
Cash-flow waterfall
monthlySold comps — $/sqft
last 12 mo · ≤1 miLoading sold comps…