5422 Portland Rd NE #122 · Salem, OR
Flood risk 1/10 · Minimal
- FEMA flood zone
- X (unshaded)
- Chance of flooding over 30 yrs
- 0.0%
- Est. flood insurance / yr
- $507 – $1,088
Fire risk 1/10 · Minimal
- Est. fire insurance / yr
- $498 – $926
Heat risk 3/10 · Minor
- Hot days now (above 92°F)
- 7 days/yr
- Hot days in 30 yrs
- 14 days/yr
Wind risk 1/10 · Minimal
- Chance of severe wind over 30 yrs
- —
Air-quality risk 10/10 · Severe
- Unhealthy air days now
- 13 days/yr
- Unhealthy air days in 30 yrs
- 14 days/yr
Risk factors via First Street. Map © Google.
Why this score? — see what drove the C- grade
The composite is a weighted blend of 9 inputs, each scored 0–100. Each bar is that input's sub-score; the figure is the points it added to the 100-point composite (weight × sub-score).
- Cash flow +15.0/30.0
- ARV discount +15.0/15.0
- 1% rule +5.0/10.0
- DSCR +5.0/10.0
- Livability +4.0/5.0
- Schools +3.7/10.0
- Rent growth +2.5/5.0
- Condition / age +2.5/5.0
- Appreciation +0.0/10.0
$39,900
🖨 Deal sheet (PDF) 📄 Offer letter ✓ Due diligence
Listing remarks
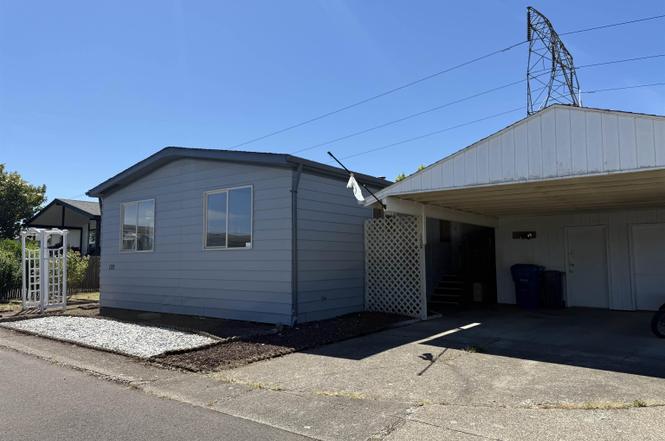
Welcome to this 2-bedroom, 2-bath home in desirable Arrowhead 55+ park. Conveniently located near Keizer Station shopping, dining & amenities. Enjoy a spacious open floor plan w/ built in hutch, new flooring, updated toilets. Fenced yard, workshop, storage area providing space for hobbies and storage. Comfortable living in great location.
Key facts
- Open floor plan
- Built in hutch
- Fenced yard
Tags
Property features AI
Finance
- Other: No assessments/liens reported
- HOA & community: Located in Arrowhead 55+ park; Home warranty negotiable
Exterior
- Parking: One garage space; Carport
- Utilities: City water; City sewer; Electric water heater; Electric power
- Home design: Double wide manufactured home (Fleetwood Glenbrook); 24' wide; Entry and main living areas on main level; Light grey exterior color; Composition roof; Vinyl siding
- Construction: Built in 1980; Pier foundation
- Exterior features: Fenced yard; Landscaped; Workshop (bonus room); Shed
Interior
- Kitchen: Dishwasher; Electric range; Range and refrigerator included
- Bedrooms: Master bedroom on the main level; Second bedroom on the main level
- Flooring: Carpet; Vinyl
- Bathrooms: Two bathrooms on the main level; Updated toilets
- Heating & cooling: Electric forced air heating
- Interior features: Built-in hutch; Disposal; High-speed communication available
- Laundry & utility: Utility room on the main level; Electric water heater
Neighborhood map
What this means for you Summary
Snapshot
- This is a 2-bed/2.0-bath manufactured listed at $40k.
Deal economics
- At list price, monthly cash flow is $1k ($14k/yr) — positive.
- The deal already cash-flows at list — no discount required.
- Meets the 1% rule at list price ($2k rent vs $40k).
- Cap rate 42.0% vs local median 2.9% in Salem — top-decile yield for the area; either an underpriced asset or a hidden risk that comps aren't pricing in. Stress-test before assuming the spread holds.
Location & tenants
- Location reads 79/100 on livability (#59 in OR, #2,084 nationally) — a middle-class / working-renter tenant base. Strengths: amenities A+, commute A+, housing A+; Watch: crime F.
- Salem-Keizer SD 24J (urban): math 34% / reading 47% proficiency, ranked #103 of 183 in OR (top 56%) — families likely to look elsewhere, expect single-tenant / working-renter base with shorter leases.
- Zoned schools: Clear Lake Elementary School (336 students, 57% FRL); Mcnary High School (2,081 students, 92% FRL) — zoned schools average 74% FRL vs 53% district-wide (22 pts higher); higher-poverty schools than district average — tighter screening recommended.
- Market conditions: 177 active listings in the ZIP; 15 comparable units currently listed for rent nearby; rentals at typical pace (median 25d on market — plan ~3-4 weeks tenant-placement turnaround); 47% of comp listings sitting > 30 days — soft ceiling on asking rent; 1,591 units permitted in Marion County in 2024 (716 in 5+ unit buildings).
Forward outlook
- Local home prices are declining (-3.0%/yr); year-one equity from $276 of loan paydown is wiped out by about $1k of value loss. Plan a longer hold.
- Marion County population projected at +17% by 2050 — long-run rental-demand tailwind backs the buy-and-hold thesis.
- At projected returns (-3.0% appreciation + 3.0% rent growth), your $11k cash investment doubles in ~1 year — after that, you're playing with house money.
Negotiation context
- Only 3 days on market — expect competitive offers; lowballing is unlikely to land.
- 6 sale attempts since 11y ago with the ask held roughly flat each time — persistent listings suggest the price (not the market) is what's stuck; bring a comps-based counter.
Questions for the listing agent
- Is there a deadline driving the sale (1031 exchange, divorce, estate, relocation)? That informs how much negotiation room exists.
- Schools are D-rated, which usually means shorter tenancies and higher turnover. Who's the typical renter profile here, and what's been the actual vacancy rate?
- Crime grade is F in this area — have there been break-ins, vandalism, or insurance claims at this property in the last 3 years? What carrier currently insures it and at what premium?
- What's the average days-on-market for RENTAL listings here right now (not sales)? A rising rental-DOM trend means longer vacancies and softer asking-rent achievability than the comps imply.
- What's the recent tenant-quality profile in this submarket — average credit score on applications, eviction rate, late-payment / NSF rate, and stable-employment percentage? A property-management company in the area should have these aggregated.
- How much new for-sale + rental construction is in the pipeline within 1–3 miles? Heavy new supply typically softens prices + rents 12–24 months out; constrained supply supports both.
Investment metrics
- 1% rule
- 4.70% ✓
- Cap rate
- 42.03%
- Cash-on-cash
- 127.65%
- DSCR
- 6.68
- GRM
- 1.8
CMA / ARV
- ARV (on-the-fly)
- $57,408
- Comps found
- 12
Show comp detail 12 sales within ~0.75 mi
| Address | Dist | Beds/Ba | Sqft | Sold | Price | $/sf | Match |
|---|---|---|---|---|---|---|---|
| 5422 Portland Rd #120 | 0.00mi | 2/2.0 | 1,248 (0%) | 8mo | $57,500 | $46 | 94 |
| 5422 Portland Rd NE #143 | 0.00mi | 2/2.0 | 1,248 (0%) | 8mo | $49,900 | $40 | 93 |
| 5422 Portland Rd NE #37 | 0.00mi | 3/2.0 (+1) | 1,296 (+4%) | 4mo | $39,000 | $30 | 85 |
| 5422 Portland Rd NE #56 | 0.00mi | 2/2.0 | 1,152 (-8%) | 3mo | $38,500 | $33 | 85 |
| 5422 Portland Rd NE Unit 22 | 0.00mi | 3/2.0 (+1) | 1,296 (+4%) | 7mo | $122,000 | $94 | 83 |
| 4230 Hazelgreen Rd NE #52 | 0.19mi | 2/2.0 | 1,200 (-4%) | 3mo | $32,000 | $27 | 83 |
| 5422 Portland Rd NE #80 | 0.00mi | 3/2.0 (+1) | 1,344 (+8%) | 1mo | $81,000 | $60 | 82 |
| 5422 Portland Rd NE #47 | 0.00mi | 3/2.0 (+1) | 1,344 (+8%) | 4mo | $35,000 | $26 | 79 |
| 4293 Lemon St NE | 0.16mi | 2/2.0 | 1,152 (-8%) | 3mo | $60,000 | $52 | 77 |
| 5422 Portland Rd NE #33 | 0.00mi | 2/2.0 | 1,080 (-14%) | 2mo | $60,000 | $56 | 76 |
| 5422 Portland Rd #35 | 0.00mi | 3/2.0 (+1) | 1,404 (+12%) | 7mo | $73,000 | $52 | 68 |
| 4353 Lemon St NE | 0.18mi | 3/2.0 (+1) | 1,386 (+11%) | 4mo | $57,500 | $41 | 65 |
Match score weights: distance 35% · size 25% · config 20% · recency 20%. Top-matched comps best support the ARV.
Projected returns pro-forma
-3.0% appreciation · 3.0% rent growth · sell at horizon
- IRR
- —
- Equity multiple
- 7.20×
- Total profit
- $69,263
- Equity at exit
- $5,949
- IRR
- —
- Equity multiple
- 15.14×
- Total profit
- $157,935
- Equity at exit
- $3,450
Cash invested: $11,172 (down + closing). Projections, not guarantees.
Landlord ↔ Tenant lean methodology
- Overall (STATE)
- 28 Tenant-Leaning
- State Oregon
- 28 Tenant-Leaning · D+6
- County
- — inherits STATE
- City
- — inherits STATE
ZIP-level market 97305
- Active inventory
- 177
- Price-to-rent
- 1.8×
Monthly cashflow live
- Estimated rent
- $1,877 high interval (Pro) →
- Mortgage (P&I)
- −$209
- Tax from tax record
- −$68 /mo · $820/yr
- Insurance
- −$17
- HOA
- −$0
- Vacancy / Maint / Mgmt
- −$394
- Net cashflow
- $1,188
Break-even live
Sensitivity live
| Price | -10% $1,211 | -5% $1,200 | +0% $1,188 | +5% $1,177 | +10% $1,166 |
|---|---|---|---|---|---|
| Rent | -10% $1,040 | -5% $1,114 | +0% $1,188 | +5% $1,263 | +10% $1,337 |
| Rate | -1.0pp $1,208 | -0.5pp $1,199 | base $1,188 | +0.5pp $1,178 | +1.0pp $1,168 |
UW: 25.0% down · 7.5% · 30yr · 1.5% tax · 5.0% vac · 8.0% maint · 8.0% mgmt
Financing live
Cash to close
- Down payment
- $9,975
- Closing costs
- $1,197
- Reserves months
- —
- Total cash needed
- —
Loan-product check · same deal, 3 products live
Conventional
25% down · 7.5% · 30yr
- Down + closing
- —
- Monthly P&I
- —
- Monthly cashflow
- —
- DSCR
- —
- Eligible?
- —
Personal DTI + credit; lowest rate.
DSCR
20% down · 8.5% · 30yr
- Down + closing
- —
- Monthly P&I
- —
- Monthly cashflow
- —
- DSCR
- —
- Eligible?
- —
No personal income docs; deal must DSCR.
Hard money
10% down · 12.0% · 12mo
- Down + closing
- —
- Monthly P&I
- —
- Monthly cashflow
- —
- DSCR
- —
- Eligible?
- —
Short-term bridge; refi at stabilization.
Rent comps 15 comps
| Address | Beds | Baths | Sqft | Rent | $/sqft | DOM | Units | Dist |
|---|---|---|---|---|---|---|---|---|
| 5115 Countryside St NE Salem, OR | 3.0 | 1.0–2.0 | 876 | $1,958 | $2.23 | 15d | 20 | 0.35mi |
| 4115 Geranium Loop NE Salem, OR | 3.0 | 2.5 | 1316 | $2,250 | $1.71 | 15d | 1 | 0.64mi |
| 4828 Lancaster Dr NE Salem, OR | 2.0 | 1.0 | 832 | $1,435 | $1.72 | 15d | 5 | 0.73mi |
| 4823 Settlers Dr NE Salem, OR | 3.0 | 2.0 | 1228 | $2,395 | $1.95 | 45d | 1 | 0.78mi |
| 5034 Armstrong Ave NE Salem, OR | 3.0 | 2.5 | 1400 | $2,550 | $1.82 | 45d | 1 | 0.82mi |
| 4040 Hayesville Dr NE Salem, OR | 1.0–3.0 | 1.0–2.0 | 927 | $1,695 | $1.83 | 15d | 25 | 0.92mi |
| 4624 Lancaster Dr NE Salem, OR | 2.0–3.0 | 2.0–2.5 | 963 | $1,495 | $1.55 | 15d | 10 | 1.05mi |
| 4473 47th Ave NE Salem, OR | 3.0 | 1.0 | 1244 | $2,200 | $1.77 | 45d | 1 | 1.25mi |
| 4007 Iberis St NE Unit 4007 Salem, OR | 2.0 | 1.0 | 850 | $1,195 | $1.41 | 45d | 1 | 1.42mi |
| 3942 Ward Dr NE Salem, OR | 1.0–2.0 | 1.0–2.0 | 775 | $1,550 | $2.00 | 45d | 3 | 1.44mi |
| 4334 Ward Pl NE Unit 1 Salem, OR | 3.0 | 1.5 | 1250 | $1,775 | $1.42 | 45d | 1 | 1.44mi |
| 3875 Iberis St NE Salem, OR | 2.0 | 1.0 | 707 | $1,295 | $1.83 | 24d | 1 | 1.47mi |
| 4375 Falcon View Way NE Salem, OR | 2.0 | 1.0 | 842 | $1,395 | $1.66 | 45d | 1 | 1.48mi |
| 3813 Iberis St NE Salem, OR | 2.0 | 1.0 | 868 | $1,295 | $1.49 | 15d | 1 | 1.49mi |
| 3807 Iberis St NE Salem, OR | 2.0 | 1.0 | 868 | $1,295 | $1.49 | 24d | 1 | 1.49mi |
Listing history 3 events
-
2026-06-21days on market $39,900 Active 3 DOM
-
2026-06-19remarks 342-char remark
-
2026-06-19$39,900 Active 1 DOM
ⓘ Source: listings_history table (triggers on properties + properties_extension) + one-shot
backfill from property_details.listing_events for pre-trigger history.
Tax reassessment forecast OR · Resets to sale price
- Current annual tax
- $820 · $68/mo
- Projected year-2 tax
- $820 · $68/mo
- Expected delta
- $0/yr ($0/mo · 0.0%)
ⓘ Screening estimate from a state-policy table — verify with the county assessor before closing.
Climate risk First Street
- Flood 1/10 Low FEMA zone X (unshaded) · 0% chance over 30 yrs
- Wildfire 1/10 Low
- Heat 3/10 Moderate 7 d/yr ≥92°F today · 14 d/yr by 30 yrs out
- Wind 1/10 Low
- Air quality 10/10 Extreme 13 unhealthy d/yr today · 14 by 30 yrs out
Nearby sold comps map
Loading sold comps map…
Walkable amenities ~0.75 mi
Loading nearby amenities…
Taxation est. · year 1
- Rental income
- $22,521
- − Mortgage interest
- −$2,235
- − Property taxes
- −$820
- − Insurance
- −$200
- − Repairs & maintenance
- −$1,802
- − Management
- −$1,802
- − Depreciation
- −$1,161
- Taxable income
- $14,502
- Est. tax owed @ 24.0%
- −$3,480
- After-tax cash flow
- $10,780/yr
For passive investors: Depreciation is non-cash, so a rental often shows a tax loss while cash-flowing — sheltering income. Rental losses are passive: they offset passive income freely, and up to $25,000/yr can offset ordinary (W-2) income if you actively participate and your MAGI is under $100k (phasing out to $0 by $150k); unused losses carry forward. On sale, claimed depreciation is recaptured at up to 25%, and gains may owe capital-gains tax (a 1031 exchange can defer both). Figures are a year-1 estimate at your 24.0% rate — not tax advice; consult a CPA.
Schools (NCES district)
- District
- Salem-Keizer SD 24J
- NCES district ID
- 4110820
- Math proficiency
- 34% ▼ -1.00%
- Reading proficiency
- 47% ▼ -2.00%
- Median HH income
- $48,632
- Composite
- 37.16/100
- National rank
- #9017
- State rank
- #103 of 183 in OR
Livability — Salem
- Score
- 79/100
- State rank
- #59
- US rank
- #2084
Category grades
Schools grade is shown separately in the Schools card above.
Census & demographics
- Census place
- Salem, OR
- City population
- 193,601
- Population (ZIP)
- 45,044
Population outlook (Marion County) Hauer SSP2
- Today (2025)
- 360,940 people
- By 2030
- 375,178 · +3.9%
- By 2040
- 400,914 · +11.1%
- By 2050
- 422,187 · +17.0%
- By 2075
- 460,305 · +27.5%
- By 2100
- 464,025 · +28.6%
Race, ethnicity, and origin ACS 2023
- Neighborhood character
- Diverse neighborhood (Simpson 0.61)
- Race & ethnicity
- Hispanic / Latino 44% White 44% Two or more races 16% Asian 3% Pacific Islander 3% Native American 3% Black 1%
- Hispanic origin (detail)
- Mexican 41%
- Common ancestry
- Italian 2% Slovak 2% Scotch-Irish 2%
- Foreign-born
- 23% · Canada, China
- Languages at home
- 57% English-only · Spanish 35% Other Asian/Pacific 3% Russian/Polish/Slavic 2%
Political lean MEDSL · Marion
- 2024 margin
- Toss-up / Even · D 47.5% · R 49.5% · Other 3.0%
- 2008→2024 swing
- -4.2pp toward R · 2008: 2.2pp · 2024: -2.0pp
- All cycles
- 2024: R+2.0 2020: D+1.1 2016: R+5.0 2012: R+3.5 2008: D+2.2
Not yet ingested
- Civics
- —
Market trends
- HPI YoY
- ▼ -328.50%
- Current HPI
- 296.3428
- Rent YoY
- —
- Metro
- —
- State GDP YoY
- ▲ 2.05%
- F500 in state
- 2
Industry mix (Fortune 500 HQ in OR)
| Industry | F500 HQs | Revenue |
|---|---|---|
| Consumer Goods | 1 | $51B |
|
||
Price history
+73.5% since first listed20 events — show timeline
- 2026-06-18 Listed $39,900 WVMLS
- 2025-10-22 Price Changed $10,000 WVMLS
- 2025-09-30 Price Changed $17,500 WVMLS
- 2025-09-16 Price Changed $25,000 WVMLS
- 2025-09-04 Price Changed $30,000 WVMLS
- 2025-09-02 Price Changed $35,000 WVMLS
- 2021-06-04 Sold (MLS) $40,000 WVMLS
- 2021-05-24 Contingent — WVMLS
- 2021-05-20 Listed $35,000 WVMLS
- 2020-12-03 Listing Removed — WVMLS
- 2020-12-02 Listed $59,500 WVMLS
- 2020-09-22 Listing Removed — WVMLS
- 2020-09-15 Price Changed $49,999 WVMLS
- 2020-08-07 Listed $55,000 WVMLS
- 2020-08-03 Listing Removed — WVMLS
- 2020-07-06 Listed $55,000 WVMLS
- 2015-12-01 Sold (MLS) $16,500 WVMLS
- 2015-11-14 Pending — WVMLS
- 2015-11-12 Price Changed $18,900 WVMLS
- 2015-10-15 Listed $23,000 WVMLS
Property tax history
+11.8%/yrLatest (2025): $820 · +7.6% YoY. Source: county tax records.
Cash-flow waterfall
monthlySold comps — $/sqft
last 12 mo · ≤1 miLoading sold comps…