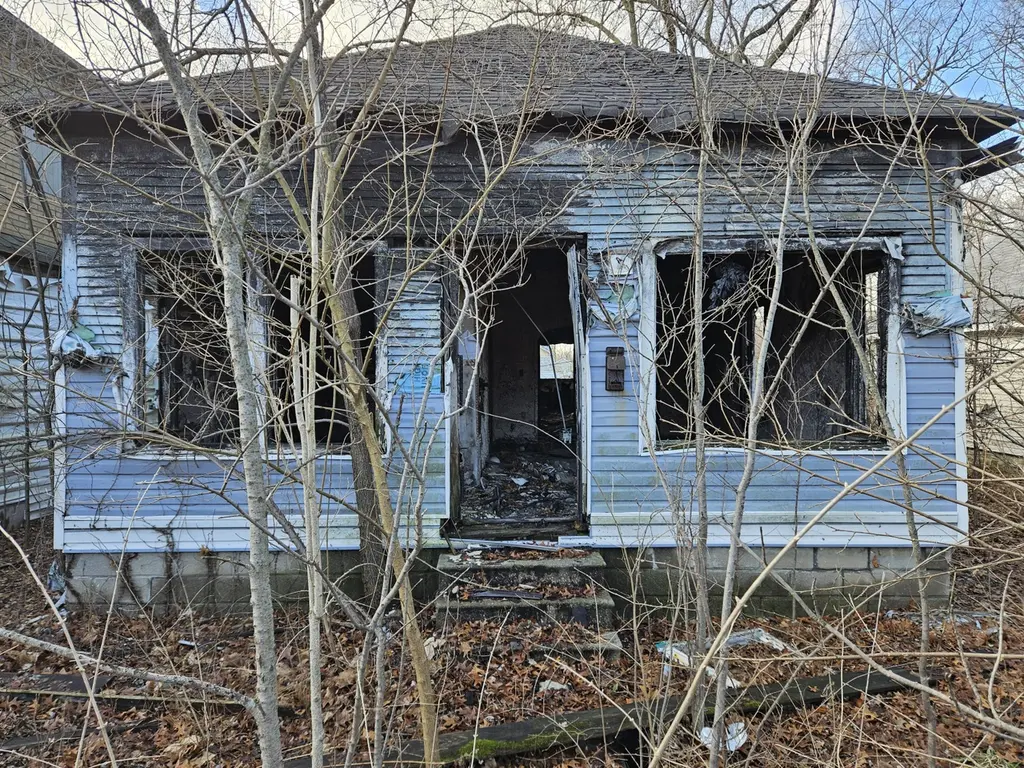
3980 Madison St · Gary, IN
Flood risk 1/10 · Minimal
- FEMA flood zone
- X (unshaded)
- Chance of flooding over 30 yrs
- 0.0%
- Est. flood insurance / yr
- $473 – $860
Fire risk 1/10 · Minimal
- Est. fire insurance / yr
- $717 – $1,331
Heat risk 2/10 · Minimal
- Hot days now (above 102°F)
- 7 days/yr
- Hot days in 30 yrs
- 15 days/yr
Wind risk 2/10 · Minimal
- Chance of severe wind over 30 yrs
- 0.0%
Air-quality risk 3/10 · Minor
- Unhealthy air days now
- 2 days/yr
- Unhealthy air days in 30 yrs
- 3 days/yr
Risk factors via First Street. Map © Google.
Why this score? — see what drove the D grade
The composite is a weighted blend of 9 inputs, each scored 0–100. Each bar is that input's sub-score; the figure is the points it added to the 100-point composite (weight × sub-score).
- Cash flow +15.0/30.0
- ARV discount +7.5/15.0
- 1% rule +5.0/10.0
- DSCR +5.0/10.0
- Livability +3.7/5.0
- Rent growth +2.5/5.0
- Condition / age +2.5/5.0
- Schools +0.5/10.0
- Appreciation +0.0/10.0
$8,500
🖨 Deal sheet 📄 Offer letter ✓ Due diligence
Listing remarks MLS
Investor Special - Massive Potential & Solid Bones This home is the ultimate blank canvas for your next project. If you are looking for a property with "good bones" that can be reimagined into a much larger residence, this is it. Key Features: Full Basement: providing massive potential to double your usable square footage or add extra bedrooms. Flexible Layout: The interior is ready to be reconfigured. With 1,000 sq. ft. to work with, you can easily open up the floor plan to create a more spacious, modern living area. This house needs a total renovation.
Key facts
- Flexible layout
- Full basement
- 4,704 sq ft lot
Tags
Neighborhood map
What this means for you Summary
Snapshot
- This is a 3-bed/1.0-bath single-family listed at $8k.
Deal economics
- At list price, monthly cash flow is $1k ($12k/yr) — positive.
- The deal already cash-flows at list — no discount required.
- Meets the 1% rule at list price ($1k rent vs $8k).
- Recommended offer: $8k (9.0% below list) — sets the bar for market timing.
- Cap rate 149.2% vs local median 9.1% in Gary — top-decile yield for the area; either an underpriced asset or a hidden risk that comps aren't pricing in. Stress-test before assuming the spread holds.
Location & tenants
- Location reads 73/100 on livability (#105 in IN) — a middle-class / working-renter tenant base. Strengths: commute A+, cost of living A+, housing A+; Watch: schools F, crime F, employment F.
- Gary Community School Corporation (urban): math 3% / reading 11% proficiency, ranked #299 of 301 in IN (top 99%) — low school quality limits family demand, transient renter base, plan for 1-2y turnover; 80% free/reduced lunch — lower-income household profile, screen leases tightly.
- Market conditions: 102 active listings in the ZIP; 22 comparable units currently listed for rent nearby; rentals leasing fast (median 7d on market — plan ~1-2 weeks tenant-placement turnaround); 1,642 units permitted in Lake County in 2024 (14 in 5+ unit buildings).
- This rent runs 35% of the median local income ($47k/yr) — at the standard rent-burdened threshold; future hikes will face affordability resistance.
Forward outlook
- Local home prices are declining (-3.0%/yr); year-one equity from $59 of loan paydown is wiped out by about $255 of value loss. Plan a longer hold.
- Lake County population projected to shrink 7% by 2050 — rents likely to lag national; underwrite the cash flow, not the appreciation.
- At projected returns (-3.0% appreciation + 3.0% rent growth), your $2k cash investment doubles in ~1 year — after that, you're playing with house money.
Negotiation context
- It's been on market 119 days — a 9% lower offer ($8k) is reasonable based on typical stale-listing flexibility.
- 7 sale attempts since 22y ago; this cycle's ask has dropped $4k (29%) from the opening price — seller is motivated, your offer sets the floor, not the list.
Risks & watch-outs
- Watch-outs: property tax is 3.0% of price; built in 1917 — expect roof / HVAC / electrical / plumbing capex.
Questions for the listing agent
- It's been on market 119 days. Have you received any prior offers? Is the seller open to a 9% concession, seller financing, or rate buy-down credit?
- Built in 1917 — when were the roof, HVAC, electrical panel, plumbing, and water heater last replaced?
- Property tax is high relative to price — has the assessment been appealed recently, and will the sale trigger a re-assessment?
- Why hasn't it sold? Are there any deal-killer items the seller is aware of (foundation, flood, title, zoning, code violations)?
- Is there a deadline driving the sale (1031 exchange, divorce, estate, relocation)? That informs how much negotiation room exists.
- Schools are F-rated, which usually means shorter tenancies and higher turnover. Who's the typical renter profile here, and what's been the actual vacancy rate?
- Crime grade is F in this area — have there been break-ins, vandalism, or insurance claims at this property in the last 3 years? What carrier currently insures it and at what premium?
- The area grade is low — what's the realistic commute time and amenity access for the typical tenant pool here? Any planned neighborhood developments (good or bad) we should know about?
- What's the average days-on-market for RENTAL listings here right now (not sales)? A rising rental-DOM trend means longer vacancies and softer asking-rent achievability than the comps imply.
- What's the recent tenant-quality profile in this submarket — average credit score on applications, eviction rate, late-payment / NSF rate, and stable-employment percentage? A property-management company in the area should have these aggregated.
- How much new for-sale + rental construction is in the pipeline within 1–3 miles? Heavy new supply typically softens prices + rents 12–24 months out; constrained supply supports both.
Investment metrics
- 1% rule
- 16.11% ✓
- Cap rate
- 149.17%
- Cash-on-cash
- 510.26%
- DSCR
- 23.70
- GRM
- 0.5
CMA / ARV
- ARV (median comp)
- $42,052
- List price
- $8,500
- Delta
- -79.79%
- Verdict
- UNDERPRICED
- Comps
- 20 within 1.0 mi
Show comp detail 12 sales within ~0.75 mi
| Address | Dist | Beds/Ba | Sqft | Sold | Price | $/sf | Match |
|---|---|---|---|---|---|---|---|
| 3980 Tyler St | 0.32mi | 3/1.0 | 1,042 (+4%) | 5mo | $128,000 | $123 | 74 |
| 4088 Monroe St | 0.15mi | 2/2.0 (-1) | 956 (-4%) | 10mo | $139,000 | $145 | 68 |
| 4115 Fillmore St | 0.44mi | 2/1.0 (-1) | 950 (-5%) | 6mo | $51,000 | $54 | 61 |
| 4016 Connecticut St | 0.38mi | 2/1.0 (-1) | 920 (-8%) | 4mo | $25,000 | $27 | 60 |
| 3737 Fillmore St | 0.52mi | 3/1.0 | 1,080 (+8%) | 5mo | $175,500 | $163 | 59 |
| 3540 Pennsylvania St | 0.69mi | 3/1.5 | 1,035 (+4%) | 3mo | $68,000 | $66 | 58 |
| 4181 Fillmore St | 0.48mi | 2/1.0 (-1) | 1,080 (+8%) | 3mo | $22,000 | $20 | 57 |
| 3679 Buchanan St | 0.66mi | 3/1.0 | 918 (-8%) | 0mo | $112,000 | $122 | 55 |
| 3724 Tyler St | 0.46mi | 2/1.0 (-1) | 870 (-13%) | 4mo | $48,000 | $55 | 48 |
| 4019 Pennsylvania St | 0.47mi | 2/— (-1) | 856 (-14%) | 4mo | $36,500 | $43 | 46 |
| 4525 Tyler St | 0.74mi | 3/1.0 | 875 (-12%) | 1mo | $136,000 | $155 | 44 |
| 4217 Maryland St | 0.67mi | 2/1.0 (-1) | 864 (-14%) | 3mo | $49,900 | $58 | 39 |
Match score weights: distance 35% · size 25% · config 20% · recency 20%. Top-matched comps best support the ARV.
Projected returns pro-forma
-3.0% appreciation · 3.0% rent growth · sell at horizon
- IRR
- —
- Equity multiple
- 27.52×
- Total profit
- $63,106
- Equity at exit
- $1,267
- IRR
- —
- Equity multiple
- 59.01×
- Total profit
- $138,061
- Equity at exit
- $735
Cash invested: $2,380 (down + closing). Projections, not guarantees.
Landlord ↔ Tenant lean methodology
- Overall (STATE)
- 90 Strongly Landlord-Friendly
- State Indiana
- 90 Strongly Landlord-Friendly · R+11
- County
- — inherits STATE
- City
- — inherits STATE
ZIP-level market 46408
- Home prices YoY
- -31.6%
- Active inventory
- 102
- Price-to-rent
- 0.5×
Monthly cashflow live
- Estimated rent
- $1,369 high interval (Pro) →
- Mortgage (P&I)
- −$45
- Tax from tax record
- −$22 /mo · $258/yr
- Insurance
- −$4
- HOA
- −$0
- Vacancy / Maint / Mgmt
- −$288
- Net cashflow
- $1,012
Break-even live
UW: 25.0% down · 7.5% · 30yr · 1.5% tax · 5.0% vac · 8.0% maint · 8.0% mgmt
Financing live
Cash to close
- Down payment
- $2,125
- Closing costs
- $255
- Reserves months
- —
- Total cash needed
- —
Loan-product check · same deal, 3 products live
Conventional
25% down · 7.5% · 30yr
- Down + closing
- —
- Monthly P&I
- —
- Monthly cashflow
- —
- DSCR
- —
- Eligible?
- —
Personal DTI + credit; lowest rate.
DSCR
20% down · 8.5% · 30yr
- Down + closing
- —
- Monthly P&I
- —
- Monthly cashflow
- —
- DSCR
- —
- Eligible?
- —
No personal income docs; deal must DSCR.
Hard money
10% down · 12.0% · 12mo
- Down + closing
- —
- Monthly P&I
- —
- Monthly cashflow
- —
- DSCR
- —
- Eligible?
- —
Short-term bridge; refi at stabilization.
Rent comps 22 comps
| Address | Beds | Baths | Sqft | Rent | $/sqft | DOM | Units | Dist |
|---|---|---|---|---|---|---|---|---|
| 4208 Jackson St Gary, IN | 3.0 | 1.0 | 1411 | $1,350 | $0.96 | 44d | 1 | 0.32mi |
| 4018 Tyler St Gary, IN | 3.0 | 1.0 | 880 | $1,350 | $1.53 | 1d | 1 | 0.34mi |
| 3708 Harrison St Gary, IN | 3.0 | 1.5 | 904 | $1,400 | $1.55 | 2d | 1 | 0.45mi |
| 4040 Fillmore St Gary, IN | 2.0 | 1.0 | 1000 | $1,000 | $1.00 | 10d | 1 | 0.47mi |
| 4170 Fillmore St Gary, IN | 2.0 | 1.0 | 720 | $950 | $1.32 | 19d | 1 | 0.52mi |
| 624 W 44th Pl Gary, IN | 3.0 | 1.0 | 836 | $1,250 | $1.50 | 7d | 1 | 0.58mi |
| 4430 Broadway Gary, IN | 3.0 | 1.0 | 1200 | $1,250 | $1.04 | 1d | 1 | 0.60mi |
| 4456 Connecticut St Gary, IN | 3.0 | 1.0 | 1044 | $1,300 | $1.25 | 3d | 1 | 0.69mi |
| 3777 Lincoln St Gary, IN | 2.0 | 1.0 | 800 | $1,150 | $1.44 | 1d | 1 | 0.69mi |
| 3788 Lincoln St Gary, IN | 3.0 | 2.0 | 1398 | $1,400 | $1.00 | 10d | 1 | 0.71mi |
| 4364 Buchanan St Gary, IN | 3.0 | 1.0 | 900 | $1,500 | $1.67 | 1d | 1 | 0.75mi |
| 3395 Pennsylvania St Gary, IN | 3.0 | 1.0 | 1300 | $1,495 | $1.15 | 1d | 1 | 0.86mi |
| 3449 Buchanan St Gary, IN | 3.0 | 1.0 | 1301 | $1,395 | $1.07 | 43d | 1 | 0.90mi |
| 4009 Kentucky St Gary, IN | 4.0 | 1.0 | 1307 | $1,595 | $1.22 | 43d | 1 | 0.95mi |
| 4748 Monroe St Gary, IN | 3.0 | 1.0 | 1074 | $1,695 | $1.58 | 1d | 1 | 0.96mi |
| 816 E 35th Ct Gary, IN | 2.0 | 1.0 | 810 | $1,075 | $1.33 | 1d | 1 | 0.96mi |
| 4416 Vermont Ct Gary, IN | 3.0 | 1.0 | 1162 | $1,350 | $1.16 | 43d | 1 | 1.05mi |
| 4816 Massachusetts St Gary, IN | 3.0 | 1.0 | 1024 | $1,350 | $1.32 | 15d | 1 | 1.08mi |
| 801 E 32nd Ave Unit 2 Gary, IN | 2.0 | 1.0 | 850 | $1,300 | $1.53 | 1d | 1 | 1.20mi |
| 2410 W 45th Ave #2 Gary, IN | 2.0 | 1.0 | 850 | $950 | $1.12 | 22d | 1 | 1.46mi |
| 2410 W 45th Ave Unit 1 Gary, IN | 2.0 | 1.0 | 850 | $895 | $1.05 | 22d | 1 | 1.46mi |
| 5001 Carolina St Gary, IN | 3.0 | 1.0 | 875 | $1,350 | $1.54 | 2d | 1 | 1.46mi |
Listing history 14 events
-
2026-05-12status Pending 576-char remark
Show marketing remark (576 chars)
Investor Special - Massive Potential & Solid Bones This home is the ultimate blank canvas for your next project. If you are looking for a property with "good bones" that can be reimagined into a much larger residence, this is it. Key Features: Full Basement: providing massive potential to double your usable square footage or add extra bedrooms. Flexible Layout: The interior is ready to be reconfigured. With 1,000 sq. ft. to work with, you can easily open up the floor plan to create a more spacious, modern living area. This house needs a total renovation.
-
2026-03-20price $8,500 576-char remark
Show marketing remark (576 chars)
Investor Special - Massive Potential & Solid Bones This home is the ultimate blank canvas for your next project. If you are looking for a property with "good bones" that can be reimagined into a much larger residence, this is it. Key Features: Full Basement: providing massive potential to double your usable square footage or add extra bedrooms. Flexible Layout: The interior is ready to be reconfigured. With 1,000 sq. ft. to work with, you can easily open up the floor plan to create a more spacious, modern living area. This house needs a total renovation.
-
2026-02-19price $9,000 576-char remark
Show marketing remark (576 chars)
Investor Special - Massive Potential & Solid Bones This home is the ultimate blank canvas for your next project. If you are looking for a property with "good bones" that can be reimagined into a much larger residence, this is it. Key Features: Full Basement: providing massive potential to double your usable square footage or add extra bedrooms. Flexible Layout: The interior is ready to be reconfigured. With 1,000 sq. ft. to work with, you can easily open up the floor plan to create a more spacious, modern living area. This house needs a total renovation.
-
2026-01-28price $10,000 576-char remark
Show marketing remark (576 chars)
Investor Special - Massive Potential & Solid Bones This home is the ultimate blank canvas for your next project. If you are looking for a property with "good bones" that can be reimagined into a much larger residence, this is it. Key Features: Full Basement: providing massive potential to double your usable square footage or add extra bedrooms. Flexible Layout: The interior is ready to be reconfigured. With 1,000 sq. ft. to work with, you can easily open up the floor plan to create a more spacious, modern living area. This house needs a total renovation.
-
2026-01-12$12,000 Active 576-char remark
Show marketing remark (576 chars)
Investor Special - Massive Potential & Solid Bones This home is the ultimate blank canvas for your next project. If you are looking for a property with "good bones" that can be reimagined into a much larger residence, this is it. Key Features: Full Basement: providing massive potential to double your usable square footage or add extra bedrooms. Flexible Layout: The interior is ready to be reconfigured. With 1,000 sq. ft. to work with, you can easily open up the floor plan to create a more spacious, modern living area. This house needs a total renovation.
-
2007-04-17historical
-
2006-11-15$75,000
-
2006-10-26historical
-
2006-10-04$60,000
-
2006-06-19$49,500
-
2006-02-01$21,900
-
2004-06-16$67,000
-
2004-06-15historical
-
2004-01-13$60,000
ⓘ Source: listings_history table (triggers on properties + properties_extension) + one-shot
backfill from property_details.listing_events for pre-trigger history.
Tax reassessment forecast IN · Partial reset (capped growth)
- Current annual tax
- $258 · $22/mo
- Projected year-2 tax
- $258 · $22/mo
- Expected delta
- $0/yr ($0/mo · 0.0%)
ⓘ Screening estimate from a state-policy table — verify with the county assessor before closing.
Climate risk First Street
- Flood 1/10 Low FEMA zone X (unshaded) · 0% chance over 30 yrs
- Wildfire 1/10 Low
- Heat 2/10 Low 7 d/yr ≥102°F today · 15 d/yr by 30 yrs out
- Wind 2/10 Low 0% chance of damaging wind over 30 yrs
- Air quality 3/10 Moderate 2 unhealthy d/yr today · 3 by 30 yrs out
Nearby sold comps map
Loading sold comps map…
Walkable amenities ~0.75 mi
Loading nearby amenities…
Taxation est. · year 1
- Rental income
- $16,430
- − Mortgage interest
- −$476
- − Property taxes
- −$258
- − Insurance
- −$42
- − Repairs & maintenance
- −$1,314
- − Management
- −$1,314
- − Depreciation
- −$247
- Taxable income
- $12,777
- Est. tax owed @ 24.0%
- −$3,067
- After-tax cash flow
- $9,078/yr
For passive investors: Depreciation is non-cash, so a rental often shows a tax loss while cash-flowing — sheltering income. Rental losses are passive: they offset passive income freely, and up to $25,000/yr can offset ordinary (W-2) income if you actively participate and your MAGI is under $100k (phasing out to $0 by $150k); unused losses carry forward. On sale, claimed depreciation is recaptured at up to 25%, and gains may owe capital-gains tax (a 1031 exchange can defer both). Figures are a year-1 estimate at your 24.0% rate — not tax advice; consult a CPA.
Schools (NCES district)
- District
- Gary Community School Corporation
- NCES district ID
- 1803870
- Math proficiency
- 3% ▼ -10.00%
- Reading proficiency
- 11% ▼ -6.00%
- Median HH income
- $27,739
- Composite
- 4.98/100
- National rank
- #10039
- State rank
- #299 of 301 in IN
Livability — Gary
- Score
- 73/100
- State rank
- #105
- US rank
- #5592
Category grades
Schools grade is shown separately in the Schools card above.
Census & demographics
- Census place
- Gary, IN
- County
- Lake County · 422,878 people
- City population
- 63,701
- Metro
- Chicago-Naperville-Elgin, IL-IN-WI
- Population (ZIP)
- 15,747
- Household income
- $47,453
- Rent vs Own
- Severe rent burden
- 619.0
Population outlook (Lake County) Hauer SSP2
- Today (2025)
- 484,026 people
- By 2030
- 478,091 · -1.2%
- By 2040
- 462,974 · -4.3%
- By 2050
- 449,894 · -7.1%
- By 2075
- 436,169 · -9.9%
- By 2100
- 426,607 · -11.9%
Race, ethnicity, and origin ACS 2023
- Neighborhood character
- Diverse neighborhood (Simpson 0.68)
- Race & ethnicity
- Black 41% White 32% Hispanic / Latino 22% Two or more races 12%
- Hispanic origin (detail)
- Mexican 14% Puerto Rican 7%
- Common ancestry
- Romanian 5% Iranian 1% Slovak 1%
- Foreign-born
- 4% · Canada, China
- Languages at home
- 87% English-only · Spanish 12% Chinese 1%
Political lean MEDSL · Lake
- 2024 margin
- Lean D (+5.6) · D 52.1% · R 46.5% · Other 1.5%
- 2008→2024 swing
- -28.6pp toward R · 2008: 34.3pp · 2024: 5.6pp
- All cycles
- 2024: D+5.6 2020: D+15.1 2016: D+20.6 2012: D+31.0 2008: D+34.3
Not yet ingested
- Civics
- —
Market trends
- HPI YoY
- ▼ -72.08%
- Current HPI
- 155.6238
- Rent YoY
- —
- Metro
- Chicago-Naperville-Elgin, IL-IN-WI
- State GDP YoY
- ▲ 2.90%
- F500 in state
- 18
Industry mix (Fortune 500 HQ in IN)
| Industry | F500 HQs | Revenue |
|---|---|---|
| Industrial Machinery | 2 | $37B |
|
||
| Healthcare | 1 | $177B |
|
||
| Pharmaceuticals | 1 | $45B |
|
||
| Metals / Steel | 1 | $18B |
|
||
| Agriculture | 1 | $17B |
|
||
| Packaging | 1 | $12B |
|
||
Price history
-85.8% since first listed14 events — show timeline
- 2026-05-12 Pending — NIRA MLS as Distributed by MLS Grid
- 2026-03-20 Price Changed $8,500 NIRA MLS as Distributed by MLS Grid
- 2026-02-19 Price Changed $9,000 NIRA MLS as Distributed by MLS Grid
- 2026-01-28 Price Changed $10,000 NIRA MLS as Distributed by MLS Grid
- 2026-01-12 Listed $12,000 NIRA MLS as Distributed by MLS Grid
- 2007-04-17 Listing Removed — NIRA MLS as Distributed by MLS Grid
- 2006-11-15 Listed $75,000 NIRA MLS as Distributed by MLS Grid
- 2006-10-26 Listing Removed — NIRA MLS as Distributed by MLS Grid
- 2006-10-04 Listed $60,000 NIRA MLS as Distributed by MLS Grid
- 2006-06-19 Listed $49,500 NIRA MLS as Distributed by MLS Grid
- 2006-02-01 Listed $21,900 NIRA MLS as Distributed by MLS Grid
- 2004-06-16 Listed $67,000 NIRA MLS as Distributed by MLS Grid
- 2004-06-15 Listing Removed — NIRA MLS as Distributed by MLS Grid
- 2004-01-13 Listed $60,000 NIRA MLS as Distributed by MLS Grid
Property tax history
-19.7%/yrLatest (2024): $258 · +3.5% YoY. Source: county tax records.
Cash-flow waterfall
monthlySold comps — $/sqft
last 12 mo · ≤1 miLoading sold comps…