 Multi-family
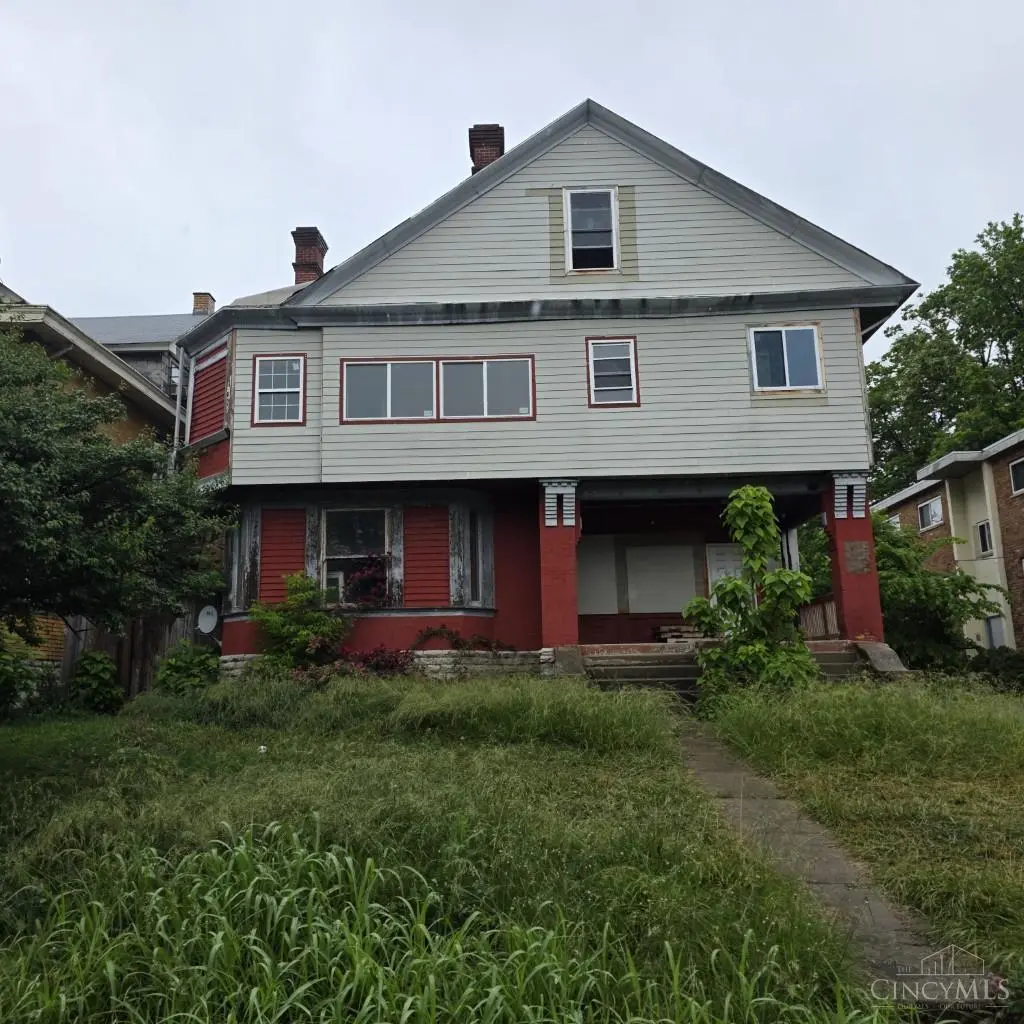
840 Lexington Ave · Cincinnati, OH
Flood risk 1/10 · Minimal
- FEMA flood zone
- X (unshaded)
- Chance of flooding over 30 yrs
- 0.0%
- Est. flood insurance / yr
- $473 – $860
Fire risk 1/10 · Minimal
- Est. fire insurance / yr
- $713 – $1,323
Heat risk 4/10 · Minor
- Hot days now (above 103°F)
- 7 days/yr
- Hot days in 30 yrs
- 19 days/yr
Wind risk 2/10 · Minimal
- Chance of severe wind over 30 yrs
- 1.0%
Air-quality risk 3/10 · Minor
- Unhealthy air days now
- 2 days/yr
- Unhealthy air days in 30 yrs
- 3 days/yr
Risk factors via First Street. Map © Google.
Why this score? — see what drove the B grade
The composite is a weighted blend of 9 inputs, each scored 0–100. Each bar is that input's sub-score; the figure is the points it added to the 100-point composite (weight × sub-score).
- Cash flow +30.0/30.0
- 1% rule +10.0/10.0
- DSCR +10.0/10.0
- ARV discount +7.5/15.0
- Livability +4.0/5.0
- Rent growth +3.9/5.0
- Schools +2.5/10.0
- Condition / age +2.5/5.0
- Appreciation +0.0/10.0
$190,000
🖨 Deal sheet (PDF) 📄 Offer letter ✓ Due diligence
Multi-family units
County records classify this as Multi-Family (5+ Unit). Listing-text estimate: 1 unit. estimate disagrees with records
5+ unit building — per-unit beds/baths from public records are typically unavailable; the breakdown below (if shown) is an estimate from the listing text.
Listing remarks MLS
investors ! Ideally located 5 unit building in the heart of North Avondale with excellent income opportunity . This property has been taken down to the studs, framing , plumbing , wiring completed , All you need to do is finishing touches,Third level has 2 units with 2 bedrooms 1 bath, second floor one bedroom 1 bath, first floor 2 bedroom 1 bath units, Selling as is , Seller prefers cash , quick close .
Key facts
- Strong rental demand
- Custom living space
- Thoughtful updates
Tags
Property features AI
Exterior
- Parking: Off-street parking via driveway
- Utilities: Public water; Public sewer; Natural gas
- Home design: Three or more levels
- Construction: Stone foundation
- Exterior features: Shingle roof; Brick exterior; Other window features; Lot of about 0.185 acres (8,059 sq ft)
Interior
- Interior features: Full basement
Neighborhood map
What this means for you Summary
Snapshot
- This is a 5-bed/8.0-bath multifamily listed at $190k.
Deal economics
- At list price, monthly cash flow is $3k ($35k/yr) — positive.
- The deal already cash-flows at list — no discount required.
- Meets the 1% rule at list price ($5k rent vs $190k).
- Cap rate 24.5% vs local median 3.9% in Cincinnati — top-decile yield for the area; either an underpriced asset or a hidden risk that comps aren't pricing in. Stress-test before assuming the spread holds.
Location & tenants
- Location reads 80/100 on livability (#130 in OH, #1,856 nationally) — a professional / high-income tenant draw. Strengths: amenities A+, commute A+, cost of living A+; Watch: employment D, crime F.
- Cincinnati Public Schools (urban): math 25% / reading 36% proficiency, ranked #581 of 656 in OH (top 89%) — families likely to look elsewhere, expect single-tenant / working-renter base with shorter leases; 70% free/reduced lunch — lower-income household profile, screen leases tightly.
- Zoned schools: Sands Montessori School (math 70% / reading 77%, grade A, #311 of 1,584 statewide, top 20%, 683 students, 22% FRL); Hartwell School (math 17% / reading 31%, grade F, #593 of 654 statewide, top 91%, 447 students, 0% FRL); Walnut Hills High School (math 79% / reading 89%, grade A, #17 of 781 statewide, top 2%, 2,582 students, 14% FRL) — zoned schools average 12% FRL vs 70% district-wide (59 pts lower); this property's tenant base skews higher-income than the district average.
- Zoned-school proficiency averages 60% at this address vs 30% district-wide (+30 pts) — the actual schools serving this property are materially stronger than the Cincinnati Public Schools average implies; a family-tenant draw the district grade alone would hide.
- Market conditions: Rents rising fast (+5.5%/yr); 49 active listings in the ZIP; 3 comparable units currently listed for rent nearby; rentals leasing fast (median 0d on market — plan ~1-2 weeks tenant-placement turnaround); lower-income renter base — watch delinquency; 801 units permitted in Hamilton County in 2024 (190 in 5+ unit buildings).
- At $5,458/mo this rent would consume 203% of the median local household income ($32k/yr) (locally 1730% of renters already pay >50% of income on rent) — very limited rent-growth headroom before tenants either downsize or default.
Forward outlook
- Local home prices are declining (-3.0%/yr); year-one equity from $1k of loan paydown is wiped out by about $6k of value loss. Plan a longer hold.
- At projected returns (-3.0% appreciation + 5.5% rent growth), your $53k cash investment doubles in ~2 years — after that, you're playing with house money.
Negotiation context
- Only 14 days on market — expect competitive offers; lowballing is unlikely to land.
- 13 sale attempts since 20y ago with the ask held roughly flat each time — persistent listings suggest the price (not the market) is what's stuck; bring a comps-based counter.
- Current owner paid $145k; 31% above their basis — modest negotiation headroom, anchor on the comps not their cost.
Risks & watch-outs
- Watch-outs: built in 1900 — expect roof / HVAC / electrical / plumbing capex.
Questions for the listing agent
- Built in 1900 — when were the roof, HVAC, electrical panel, plumbing, and water heater last replaced?
- Is there a deadline driving the sale (1031 exchange, divorce, estate, relocation)? That informs how much negotiation room exists.
- Schools are B-rated — typically a magnet for longer-tenancy family renters. What's the average tenant stay here, and is there a school-zone premium baked into asking?
- Crime grade is F in this area — have there been break-ins, vandalism, or insurance claims at this property in the last 3 years? What carrier currently insures it and at what premium?
- What's the average days-on-market for RENTAL listings here right now (not sales)? A rising rental-DOM trend means longer vacancies and softer asking-rent achievability than the comps imply.
- What's the recent tenant-quality profile in this submarket — average credit score on applications, eviction rate, late-payment / NSF rate, and stable-employment percentage? A property-management company in the area should have these aggregated.
- How much new apartment / multifamily construction is in the pipeline within 1–3 miles? Heavy new supply (>2% of stock underway) typically softens rents 12–24 months out; light construction supports rent growth.
Investment metrics
- 1% rule
- 2.87% ✓
- Cap rate
- 24.51%
- Cash-on-cash
- 65.06%
- DSCR
- 3.89
- GRM
- 2.9
CMA / ARV
- ARV (on-the-fly)
- $404,683
- Comps found
- 2
Show comp detail 2 sales within ~0.75 mi
| Address | Dist | Beds/Ba | Sqft | Sold | Price | $/sf | Match |
|---|---|---|---|---|---|---|---|
| 1041 Dana Ave | 0.42mi | 5/4.0 | 4,265 (-6%) | 21mo | $379,900 | $89 | 37 |
| 3474 Harvey Ave | 0.55mi | 5/2.0 | 4,288 (-6%) | 13mo | $126,000 | $29 | 34 |
Match score weights: distance 35% · size 25% · config 20% · recency 20%. Top-matched comps best support the ARV.
Projected returns pro-forma
-3.0% appreciation · 5.55% rent growth · sell at horizon
- IRR
- 67.2%
- Equity multiple
- 4.15×
- Total profit
- $167,437
- Equity at exit
- $28,330
- IRR
- 72.2%
- Equity multiple
- 9.37×
- Total profit
- $445,071
- Equity at exit
- $16,428
Cash invested: $53,200 (down + closing). Projections, not guarantees.
Landlord ↔ Tenant lean methodology
- Overall (STATE)
- 73 Landlord-Friendly
- State Ohio
- 73 Landlord-Friendly · R+6
- County
- — inherits STATE
- City
- — inherits STATE
ZIP-level market 45229
- Home prices YoY
- -24.0%
- Rents YoY
- 5.5%
- Active inventory
- 49
- Price-to-rent
- 14.2×
Monthly cashflow live
- Estimated rent
- $5,458 high interval (Pro) →
- Mortgage (P&I)
- −$996
- Tax from tax record
- −$352 /mo · $4,222/yr
- Insurance
- −$79
- HOA
- −$0
- Lot rent
- −$0
- Vacancy / Maint / Mgmt
- −$1,146
- Net cashflow
- $2,884
Break-even live
Sensitivity live
| Price | -10% $2,992 | -5% $2,938 | +0% $2,884 | +5% $2,831 | +10% $2,777 |
|---|---|---|---|---|---|
| Rent | -10% $2,453 | -5% $2,669 | +0% $2,884 | +5% $3,100 | +10% $3,316 |
| Rate | -1.0pp $2,980 | -0.5pp $2,933 | base $2,884 | +0.5pp $2,835 | +1.0pp $2,785 |
5-unit breakdown (identical units grouped — click to expand)
| Units | Beds | Baths | Est. rent |
|---|---|---|---|
| 4× units | 2 | 1 | $4,448 |
| #1 | 2 | 1 | $1,112 |
| #2 | 2 | 1 | $1,112 |
| #4 | 2 | 1 | $1,112 |
| #5 | 2 | 1 | $1,112 |
| 1× unit | 1 | 1 | $1,009 |
| Total (5 units) | $5,458 | ||
UW: 25.0% down · 7.5% · 30yr · 1.5% tax · 5.0% vac · 8.0% maint · 8.0% mgmt
Financing live
Cash to close
- Down payment
- $47,500
- Closing costs
- $5,700
- Reserves months
- —
- Total cash needed
- —
Loan-product check · same deal, 3 products live
Conventional
25% down · 7.5% · 30yr
- Down + closing
- —
- Monthly P&I
- —
- Monthly cashflow
- —
- DSCR
- —
- Eligible?
- —
Personal DTI + credit; lowest rate.
DSCR
20% down · 8.5% · 30yr
- Down + closing
- —
- Monthly P&I
- —
- Monthly cashflow
- —
- DSCR
- —
- Eligible?
- —
No personal income docs; deal must DSCR.
Hard money
10% down · 12.0% · 12mo
- Down + closing
- —
- Monthly P&I
- —
- Monthly cashflow
- —
- DSCR
- —
- Eligible?
- —
Short-term bridge; refi at stabilization.
Rent comps 3 comps
| Address | Beds | Baths | Sqft | Rent | $/sqft | DOM | Units | Dist |
|---|---|---|---|---|---|---|---|---|
| 907 Lexington Ave Unit A Cincinnati, OH | 6.0 | 2.0 | 6500 | $2,900 | $0.45 | 17d | 1 | 0.17mi |
| 907 Lexington Ave Unit A Cincinnati, OH | 6.0 | 2.0 | 6500 | $2,580 | $0.40 | 0d | 1 | 0.17mi |
| 907 Lexington Ave Cincinnati, OH | 6.0 | 2.0 | 6000 | $2,550 | $0.42 | 0d | 1 | 0.17mi |
Listing history 10 events
-
2026-06-22days on market $190,000 Active 14 DOM
-
2026-06-21days on market $190,000 Active 13 DOM
-
2026-06-18days on market $190,000 Active 10 DOM
-
2026-06-17days on market $190,000 Active 9 DOM
-
2026-06-16days on market $190,000 Active 8 DOM
-
2026-06-15days on market $190,000 Active 7 DOM
-
2026-06-13days on market $190,000 Active 5 DOM
-
2026-06-13days on market $190,000 Active 4 DOM
-
2026-06-08remarks 699-char remark
-
2026-06-08$190,000 Active 1 DOM
ⓘ Source: listings_history table (triggers on properties + properties_extension) + one-shot
backfill from property_details.listing_events for pre-trigger history.
Tax reassessment forecast OH · Partial reset (capped growth)
- Current annual tax
- $4,222 · $352/mo
- Projected year-2 tax
- $4,222 · $352/mo
- Expected delta
- $0/yr ($0/mo · 0.0%)
ⓘ Screening estimate from a state-policy table — verify with the county assessor before closing.
Climate risk First Street
- Flood 1/10 Low FEMA zone X (unshaded) · 0% chance over 30 yrs
- Wildfire 1/10 Low
- Heat 4/10 Moderate 7 d/yr ≥103°F today · 19 d/yr by 30 yrs out
- Wind 2/10 Low 100% chance of damaging wind over 30 yrs
- Air quality 3/10 Moderate 2 unhealthy d/yr today · 3 by 30 yrs out
Nearby sold comps map
Loading sold comps map…
Walkable amenities ~0.75 mi
Loading nearby amenities…
Taxation est. · year 1
- Rental income
- $65,496
- − Mortgage interest
- −$10,643
- − Property taxes
- −$4,222
- − Insurance
- −$950
- − Repairs & maintenance
- −$5,240
- − Management
- −$5,240
- − Depreciation
- −$5,527
- Taxable income
- $33,675
- Est. tax owed @ 24.0%
- −$8,082
- After-tax cash flow
- $26,532/yr
For passive investors: Depreciation is non-cash, so a rental often shows a tax loss while cash-flowing — sheltering income. Rental losses are passive: they offset passive income freely, and up to $25,000/yr can offset ordinary (W-2) income if you actively participate and your MAGI is under $100k (phasing out to $0 by $150k); unused losses carry forward. On sale, claimed depreciation is recaptured at up to 25%, and gains may owe capital-gains tax (a 1031 exchange can defer both). Figures are a year-1 estimate at your 24.0% rate — not tax advice; consult a CPA.
Schools (NCES district)
- District
- Cincinnati Public Schools
- NCES district ID
- 3904375
- Math proficiency
- 25% ▼ -19.00%
- Reading proficiency
- 36% ▼ -14.00%
- Median HH income
- $35,743
- Composite
- 25.21/100
- National rank
- #7508
- State rank
- #581 of 656 in OH
Livability — Cincinnati
- Score
- 80/100
- State rank
- #130
- US rank
- #1856
Category grades
Schools grade is shown separately in the Schools card above.
Census & demographics
- Census place
- Cincinnati, OH
- County
- Hamilton County · 701,295 people
- City population
- 505,555
- Metro
- Cincinnati, OH-KY-IN
- Population (ZIP)
- 13,529
- Household income
- $32,263
- Rent vs Own
- Severe rent burden
- 1730.0
Population outlook (Hamilton County) Hauer SSP2
- Today (2025)
- 826,054 people
- By 2030
- 830,947 · +0.6%
- By 2040
- 832,319 · +0.8%
- By 2050
- 822,428 · -0.4%
- By 2075
- 788,688 · -4.5%
- By 2100
- 710,674 · -14.0%
Race, ethnicity, and origin ACS 2023
- Neighborhood character
- Predominantly Black (65%)
- Race & ethnicity
- Black 65% White 24% Two or more races 5% Hispanic / Latino 4% Asian 1%
- Common ancestry
- Italian 2% Iranian 1% Lithuanian 1%
- Foreign-born
- 5% · Canada
- Languages at home
- 93% English-only · Spanish 4% Russian/Polish/Slavic 1% Other Indo-European 1%
Political lean MEDSL · Hamilton
- 2024 margin
- D (+14.9) · D 57.0% · R 42.1%
- 2008→2024 swing
- +7.9pp toward D · 2008: 7.0pp · 2024: 14.9pp
- All cycles
- 2024: D+14.9 2020: D+15.9 2016: D+9.5 2012: D+4.9 2008: D+7.0
Not yet ingested
- Civics
- —
Market trends
- HPI YoY
- ▼ -80.34%
- Current HPI
- 254.492
- Rent YoY
- ▲ 5.55%
- Metro
- Cincinnati, OH-KY-IN
- State GDP YoY
- ▲ 1.98%
- F500 in state
- 48
Industry mix (Fortune 500 HQ in OH)
| Industry | F500 HQs | Revenue |
|---|---|---|
| Insurance | 3 | $145B |
|
||
| Industrial Machinery | 3 | $49B |
|
||
| Financial Services | 3 | $24B |
|
||
| Consumer Goods | 2 | $93B |
|
||
| Aerospace / Defense | 2 | $47B |
|
||
| Utilities | 2 | $33B |
|
||
Price history
+123.5% since first listed43 events — show timeline
- 2026-06-08 Listed $190,000 Cincy MLS
- 2025-04-14 Listing Removed — Cincy MLS
- 2025-01-22 Relisted — Cincy MLS
- 2025-01-20 Listing Removed — Cincy MLS
- 2024-11-21 Price Changed $310,000 Cincy MLS
- 2024-11-05 Price Changed $345,000 Cincy MLS
- 2024-10-19 Price Changed $355,000 Cincy MLS
- 2024-09-26 Listed $375,000 Cincy MLS
- 2022-05-06 Sold (MLS) $145,000 Cincy MLS
- 2022-04-18 Contingent — Cincy MLS
- 2022-04-09 Listed $155,000 Cincy MLS
- 2021-02-23 Sold (Public Records) $65,000 Public Records
- 2021-02-05 Sold (MLS) $65,000 Cincy MLS
- 2020-12-30 Contingent — Cincy MLS
- 2020-11-06 Price Changed $85,000 Cincy MLS
- 2020-09-18 Listed $99,900 Cincy MLS
- 2016-04-15 Sold (Public Records) $39,500 Public Records
- 2016-03-17 Sold (MLS) $39,500 Cincy MLS
- 2016-03-03 Contingent — Cincy MLS
- 2015-12-01 Listed $30,000 Cincy MLS
- 2015-11-22 Listing Removed — Cincy MLS
- 2015-07-02 Relisted — Cincy MLS
- 2015-06-23 Contingent — Cincy MLS
- 2015-05-27 Listed $30,000 Cincy MLS
- 2015-02-13 Listing Removed — Cincy MLS
- 2015-02-13 Sold (Public Records) $15,000 Public Records
- 2015-02-12 Sold (MLS) $15,000 Cincy MLS
- 2015-01-09 Listing Removed — Cincy MLS
- 2014-12-12 Listed $17,000 Cincy MLS
- 2008-06-27 Sold (Public Records) $90,000 Public Records
- 2008-06-13 Sold (MLS) $90,000 Cincy MLS
- 2008-03-11 Listed $110,926 Cincy MLS
- 2008-02-28 Listing Removed — Cincy MLS
- 2007-08-27 Listed $126,000 Cincy MLS
- 2007-08-08 Listing Removed — Cincy MLS
- 2006-12-06 Listed $138,900 Cincy MLS
- 2006-10-10 Sold (Public Records) $78,500 Public Records
- 2006-08-31 Sold (MLS) $78,500 Cincy MLS
- 2006-05-19 Listed $79,000 Cincy MLS
- 2006-04-12 Sold (Public Records) $76,000 Public Records
- 2006-04-07 Sold (Public Records) $76,000 Public Records
- 2000-09-27 Sold (Public Records) $115,000 Public Records
- 1997-11-05 Sold (Public Records) $85,000 Public Records
Property tax history
+8.0%/yrLatest (2025): $4,222 · +0.7% YoY. Source: county tax records.
Cash-flow waterfall
monthlySold comps — $/sqft
last 12 mo · ≤1 miLoading sold comps…