 Multi-family
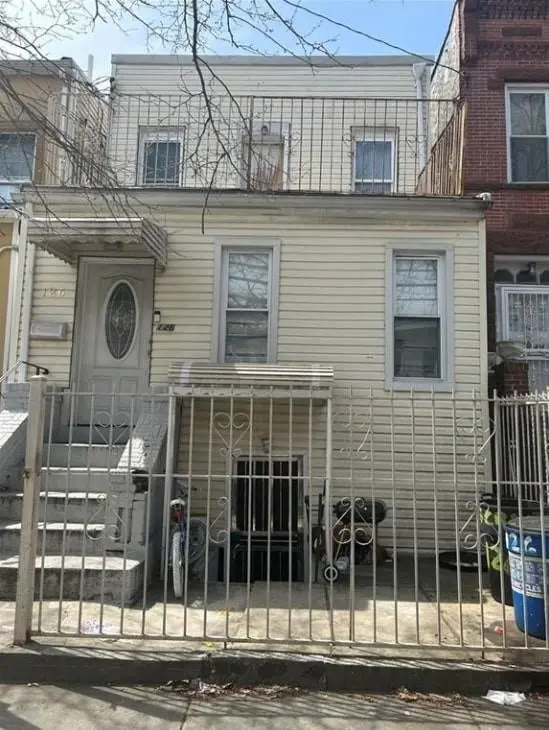
126 Crystal St · New York, NY
Flood risk 1/10 · Minimal
- FEMA flood zone
- X (unshaded)
- Chance of flooding over 30 yrs
- 0.0%
- Est. flood insurance / yr
- $507 – $1,088
Fire risk 1/10 · Minimal
- Est. fire insurance / yr
- $691 – $1,283
Heat risk 7/10 · Major
- Hot days now (above 99°F)
- 7 days/yr
- Hot days in 30 yrs
- 15 days/yr
Wind risk 6/10 · Moderate
- Chance of severe wind over 30 yrs
- 49.0%
Air-quality risk 5/10 · Moderate
- Unhealthy air days now
- 6 days/yr
- Unhealthy air days in 30 yrs
- 8 days/yr
Risk factors via First Street. Map © Google.
Why this score? — see what drove the B grade
The composite is a weighted blend of 9 inputs, each scored 0–100. Each bar is that input's sub-score; the figure is the points it added to the 100-point composite (weight × sub-score).
- Cash flow +30.0/30.0
- DSCR +10.0/10.0
- 1% rule +8.0/10.0
- ARV discount +7.5/15.0
- Schools +5.0/10.0
- Rent growth +4.0/5.0
- Livability +3.8/5.0
- Condition / age +2.5/5.0
- Appreciation +0.0/10.0
$300,000
🖨 Deal sheet (PDF) 📄 Offer letter ✓ Due diligence
Multi-family units
County records classify this as Multi-Family (2-4 Unit). Listing-text estimate: 1 unit. estimate disagrees with records
Listing remarks
Introducing a single-family property located in East New York. This residence offers a total of four well-appointed bedrooms and a full finished basement. The property is being sold as is. Kindly note that the current tenants are not to be disturbed during the sale process.
Key facts
- 2,000 sq ft lot
- Built 1925
- Listed 531 days
Tags
Property features AI
Finance
- Financial info: Financing options considered: exchange, bank mortgage, or cash
Exterior
- Parking: No parking
- Utilities: Electric: 110V with circuit breakers; Gas for heating and hot water
- Home design: Detached residential building; 2-story layout
- Construction: Asphalt/tar roof; Poured concrete foundation
- Exterior features: Front yard; Back yard; Vinyl siding
Interior
- Kitchen: Includes refrigerator and stove
- Bedrooms: One bedroom on the first floor; Three bedrooms on the second floor
- Flooring: Hardwood floors
- Bathrooms: Two full bathrooms (one on first floor, one on second floor)
- Heating & cooling: Steam/radiator heat; Gas hot water; No AC units reported
- Interior features: Finished basement; Refrigerator; Stove
- Laundry & utility: No central air conditioning
Neighborhood map
What this means for you Summary
Snapshot
- This is a 4-bed/2.0-bath multifamily listed at $300k.
Deal economics
- At list price, monthly cash flow is $1k ($14k/yr) — positive.
- The deal already cash-flows at list — no discount required.
- Meets the 1% rule at list price ($4k rent vs $300k).
- Recommended offer: $264k (12.0% below list) — sets the bar for market timing.
- Cap rate 11.1% vs local median 2.6% in New York — top-decile yield for the area; either an underpriced asset or a hidden risk that comps aren't pricing in. Stress-test before assuming the spread holds.
Location & tenants
- Location reads 75/100 on livability (#268 in NY, #4,188 nationally) — a middle-class / working-renter tenant base. Strengths: amenities A+, commute A+, health & safety A; Watch: crime F, cost of living F.
- Zoned schools: Elm Tree Elementary School (math 27% / reading 52%, grade F, #1,444 of 2,108 statewide, top 71%, 806 students, 94% FRL); Jhs 383 Philippa Schuyler (math 32% / reading 67%, grade C, #280 of 729 statewide, top 40%, 822 students, 85% FRL); Midwood High School (math 94% / reading 96%, grade A+, #83 of 1,100 statewide, top 8%, 4,062 students, 73% FRL).
- Market conditions: Rents rising fast (+6.1%/yr); 193 active listings in the ZIP; 13 comparable units currently listed for rent nearby; rentals at typical pace (median 26d on market — plan ~3-4 weeks tenant-placement turnaround); 10,063 units permitted in Kings County in 2024 (9,789 in 5+ unit buildings).
- At $3,914/mo this rent would consume 76% of the median local household income ($62k/yr) (locally 7574% of renters already pay >50% of income on rent) — very limited rent-growth headroom before tenants either downsize or default.
Forward outlook
- Local home prices are declining (-3.0%/yr); year-one equity from $2k of loan paydown is wiped out by about $9k of value loss. Plan a longer hold.
- Kings County population projected at +13% by 2050 — modest demand growth; plan on rents tracking national, not racing it.
- At projected returns (-3.0% appreciation + 6.1% rent growth), your $84k cash investment doubles in ~6 years — after that, you're playing with house money.
Negotiation context
- It's been on market 531 days — a 12% lower offer ($264k) is reasonable based on typical stale-listing flexibility.
- 3 sale attempts since 2y ago; this cycle's ask has dropped $420k (58%) from the opening price — seller is motivated, your offer sets the floor, not the list.
Risks & watch-outs
- Watch-outs: built in 1925 — expect roof / HVAC / electrical / plumbing capex.
- Climate carrying-cost: major wind risk, 49% chance of damaging wind over 30y; extreme-heat days projected 7→15/yr by 2055 (HVAC capex compounding) — expect insurance premiums to compound above CPI over the hold.
Questions for the listing agent
- It's been on market 531 days. Have you received any prior offers? Is the seller open to a 12% concession, seller financing, or rate buy-down credit?
- Built in 1925 — when were the roof, HVAC, electrical panel, plumbing, and water heater last replaced?
- Why hasn't it sold? Are there any deal-killer items the seller is aware of (foundation, flood, title, zoning, code violations)?
- Is there a deadline driving the sale (1031 exchange, divorce, estate, relocation)? That informs how much negotiation room exists.
- Schools are B-rated — typically a magnet for longer-tenancy family renters. What's the average tenant stay here, and is there a school-zone premium baked into asking?
- Crime grade is F in this area — have there been break-ins, vandalism, or insurance claims at this property in the last 3 years? What carrier currently insures it and at what premium?
- What's the average days-on-market for RENTAL listings here right now (not sales)? A rising rental-DOM trend means longer vacancies and softer asking-rent achievability than the comps imply.
- What's the recent tenant-quality profile in this submarket — average credit score on applications, eviction rate, late-payment / NSF rate, and stable-employment percentage? A property-management company in the area should have these aggregated.
- How much new apartment / multifamily construction is in the pipeline within 1–3 miles? Heavy new supply (>2% of stock underway) typically softens rents 12–24 months out; light construction supports rent growth.
Investment metrics
- 1% rule
- 1.30% ✓
- Cap rate
- 11.07%
- Cash-on-cash
- 17.05%
- DSCR
- 1.76
- GRM
- 6.4
CMA / ARV
- ARV (on-the-fly)
- $653,592
- Comps found
- 3
Show comp detail 3 sales within ~0.75 mi
| Address | Dist | Beds/Ba | Sqft | Sold | Price | $/sf | Match |
|---|---|---|---|---|---|---|---|
| 125 Crystal St | 0.03mi | 5/2.0 (+1) | 1,224 (-10%) | 1mo | $650,000 | $531 | 77 |
| 3344 Atlantic Ave | 0.39mi | 3/3.0 (-1) | 1,400 (+3%) | 12mo | $675,000 | $482 | 58 |
| 477 Ridgewood Ave | 0.73mi | 4/2.0 | 1,416 (+4%) | 3mo | $473,000 | $334 | 56 |
Match score weights: distance 35% · size 25% · config 20% · recency 20%. Top-matched comps best support the ARV.
Projected returns pro-forma
-3.0% appreciation · 6.14% rent growth · sell at horizon
- IRR
- 11.6%
- Equity multiple
- 1.48×
- Total profit
- $40,106
- Equity at exit
- $44,731
- IRR
- 22.9%
- Equity multiple
- 3.24×
- Total profit
- $188,439
- Equity at exit
- $25,939
Cash invested: $84,000 (down + closing). Projections, not guarantees.
Landlord ↔ Tenant lean methodology
- Overall (CITY)
- 0 Strongly Tenant-Friendly
- State New York
- 15 Strongly Tenant-Friendly · D+10
- County
- — inherits STATE
- City New York
- 0 Strongly Tenant-Friendly · D+34
ZIP-level market 11208
- Rents YoY
- 6.1%
- Active inventory
- 193
- Price-to-rent
- 6.4×
Monthly cashflow live
- Estimated rent
- $3,914 high interval (Pro) →
- Mortgage (P&I)
- −$1,573
- Tax from tax record
- −$201 /mo · $2,409/yr
- Insurance
- −$125
- HOA
- −$0
- Vacancy / Maint / Mgmt
- −$822
- Net cashflow
- $1,193
Break-even live
Sensitivity live
| Price | -10% $1,363 | -5% $1,278 | +0% $1,193 | +5% $1,109 | +10% $1,024 |
|---|---|---|---|---|---|
| Rent | -10% $884 | -5% $1,039 | +0% $1,193 | +5% $1,348 | +10% $1,503 |
| Rate | -1.0pp $1,345 | -0.5pp $1,270 | base $1,193 | +0.5pp $1,116 | +1.0pp $1,037 |
UW: 25.0% down · 7.5% · 30yr · 1.5% tax · 5.0% vac · 8.0% maint · 8.0% mgmt
Financing live
Cash to close
- Down payment
- $75,000
- Closing costs
- $9,000
- Reserves months
- —
- Total cash needed
- —
Loan-product check · same deal, 3 products live
Conventional
25% down · 7.5% · 30yr
- Down + closing
- —
- Monthly P&I
- —
- Monthly cashflow
- —
- DSCR
- —
- Eligible?
- —
Personal DTI + credit; lowest rate.
DSCR
20% down · 8.5% · 30yr
- Down + closing
- —
- Monthly P&I
- —
- Monthly cashflow
- —
- DSCR
- —
- Eligible?
- —
No personal income docs; deal must DSCR.
Hard money
10% down · 12.0% · 12mo
- Down + closing
- —
- Monthly P&I
- —
- Monthly cashflow
- —
- DSCR
- —
- Eligible?
- —
Short-term bridge; refi at stabilization.
Rent comps 13 comps
| Address | Beds | Baths | Sqft | Rent | $/sqft | DOM | Units | Dist |
|---|---|---|---|---|---|---|---|---|
| 294 Ridgewood Ave Brooklyn, NY | 4.0 | 2.0 | 1200 | $3,500 | $2.92 | 26d | 1 | 0.57mi |
| 90-18 77th St Unit 2 Jamaica, NY | 3.0 | 1.0 | 913 | $3,295 | $3.61 | 26d | 1 | 0.96mi |
| 8825 75th St Woodhaven, NY | 4.0 | 1.5 | 1140 | $4,000 | $3.51 | 9d | 1 | 1.00mi |
| 8825 75th St Woodhaven, NY | 4.0 | 1.5 | 1140 | $4,000 | $3.51 | 26d | 1 | 1.00mi |
| 13214 81st St Ozone Park, NY | 3.0 | 1.0 | 1280 | $4,100 | $3.20 | 13d | 1 | 1.02mi |
| 8836 77th St Woodhaven, NY | 4.0 | 2.0 | 1500 | $4,200 | $2.80 | 26d | 1 | 1.03mi |
| 132-13 81st St #1 Jamaica, NY | 3.0 | 1.0 | 1280 | $4,100 | $3.20 | 4d | 1 | 1.05mi |
| 88-18 77th St Unit 2 Jamaica, NY | 3.0 | 1.0 | 913 | $3,295 | $3.61 | 26d | 1 | 1.06mi |
| 76-09 88th Ave Unit 1 Woodhaven, NY | 3.0 | 2.0 | 960 | $3,700 | $3.85 | 21d | 1 | 1.09mi |
| 14912 83rd St Howard Beach, NY | 3.0 | 2.0 | 1250 | $3,200 | $2.56 | 26d | 1 | 1.30mi |
| 88-23 85th St Unit 1L Jamaica, NY | 3.0 | 1.0 | 1000 | $3,300 | $3.30 | 26d | 1 | 1.32mi |
| 10541 90th St Ozone Park, NY | 3.0 | 2.0 | 1264 | $4,111 | $3.25 | 26d | 1 | 1.43mi |
| 156-49 76th St Unit 2 Jamaica, NY | 3.0 | 2.0 | 1250 | $3,300 | $2.64 | 18d | 1 | 1.45mi |
Listing history 17 events
-
2026-05-14status Pending
-
2026-05-12price $300,000
-
2026-05-12status Active
-
2025-12-15status Pending
-
2024-12-02status Active
-
2024-12-01historical
-
2024-07-01$720,000 Active
-
2010-06-18soldstatus $336,500
-
2010-04-30soldstatus $136,890
-
2006-09-05soldstatus $550,000
-
2006-03-23soldstatus $435,000
-
2005-05-06soldstatus $310,000
-
2005-02-04soldstatus $265,000
-
2001-07-02soldstatus $127,000
-
1991-06-24soldstatus $129,000
-
1989-10-11soldstatus $63,500
-
1981-02-01soldstatus $12,727
ⓘ Source: listings_history table (triggers on properties + properties_extension) + one-shot
backfill from property_details.listing_events for pre-trigger history.
Tax reassessment forecast NY · Partial reset (capped growth)
- Current annual tax
- $2,409 · $201/mo
- Projected year-2 tax
- $3,739 · $312/mo
- Expected delta
- +$1,331/yr (+$111/mo · 55.2%)
ⓘ Screening estimate from a state-policy table — verify with the county assessor before closing.
Climate risk First Street
- Flood 1/10 Low FEMA zone X (unshaded) · 0% chance over 30 yrs
- Wildfire 1/10 Low
- Heat 7/10 Severe 7 d/yr ≥99°F today · 15 d/yr by 30 yrs out
- Wind 6/10 Major 49% chance of damaging wind over 30 yrs
- Air quality 5/10 Major 6 unhealthy d/yr today · 8 by 30 yrs out
Nearby sold comps map
Loading sold comps map…
Walkable amenities ~0.75 mi
Loading nearby amenities…
Taxation est. · year 1
- Rental income
- $46,973
- − Mortgage interest
- −$16,805
- − Property taxes
- −$2,409
- − Insurance
- −$1,500
- − Repairs & maintenance
- −$3,758
- − Management
- −$3,758
- − Depreciation
- −$8,727
- Taxable income
- $10,017
- Est. tax owed @ 24.0%
- −$2,404
- After-tax cash flow
- $11,917/yr
For passive investors: Depreciation is non-cash, so a rental often shows a tax loss while cash-flowing — sheltering income. Rental losses are passive: they offset passive income freely, and up to $25,000/yr can offset ordinary (W-2) income if you actively participate and your MAGI is under $100k (phasing out to $0 by $150k); unused losses carry forward. On sale, claimed depreciation is recaptured at up to 25%, and gains may owe capital-gains tax (a 1031 exchange can defer both). Figures are a year-1 estimate at your 24.0% rate — not tax advice; consult a CPA.
Schools (NCES district)
No district data.
Livability — New York
- Score
- 75/100
- State rank
- #268
- US rank
- #4188
Category grades
Schools grade is shown separately in the Schools card above.
Census & demographics
- Census place
- New York, NY
- County
- Kings County · 2,614,986 people
- City population
- 7,731,280
- Metro
- New York-Newark-Jersey City, NY-NJ-PA
- Population (ZIP)
- 105,428
- Household income
- $62,077
- Rent vs Own
- Severe rent burden
- 7574.0
Population outlook (Kings County) Hauer SSP2
- Today (2025)
- 2,847,441 people
- By 2030
- 2,937,006 · +3.1%
- By 2040
- 3,095,491 · +8.7%
- By 2050
- 3,228,968 · +13.4%
- By 2075
- 3,321,723 · +16.7%
- By 2100
- 3,111,387 · +9.3%
Race, ethnicity, and origin ACS 2023
- Neighborhood character
- Diverse neighborhood (Simpson 0.66)
- Race & ethnicity
- Black 42% Hispanic / Latino 39% Asian 10% Two or more races 8% White 3%
- Hispanic origin (detail)
- Mexican 2% Puerto Rican 9% Dominican 16%
- Common ancestry
- Hispanic 1%
- Foreign-born
- 40% · Canada, China, Mexico
- Languages at home
- 48% English-only · Spanish 36% Other Indo-European 11% French/Haitian/Cajun 1%
Political lean MEDSL · Kings
- 2024 margin
- Solid D (+44.0) · D 72.0% · R 28.0%
- 2008→2024 swing
- -15.5pp toward R · 2008: 59.4pp · 2024: 44.0pp
- All cycles
- 2024: D+44.0 2020: D+54.8 2016: D+61.8 2012: D+63.9 2008: D+59.4
Not yet ingested
- Civics
- —
Market trends
- HPI YoY
- ▼ -546.38%
- Current HPI
- 376.1489
- Rent YoY
- ▲ 6.14%
- Metro
- New York-Newark-Jersey City, NY-NJ-PA
- State GDP YoY
- ▲ 2.60%
- F500 in state
- 92
Industry mix (Fortune 500 HQ in NY)
| Industry | F500 HQs | Revenue |
|---|---|---|
| Financial Services | 10 | $950B |
|
||
| Consumer Goods | 9 | $162B |
|
||
| Insurance | 4 | $225B |
|
||
| Telecommunications | 2 | $144B |
|
||
| Pharmaceuticals | 2 | $112B |
|
||
| Media / Entertainment | 2 | $69B |
|
||
Price history
+2257.2% since first listed17 events — show timeline
- 2026-05-14 Pending — BNYMLS
- 2026-05-12 Price Changed $300,000 BNYMLS
- 2026-05-12 Relisted — BNYMLS
- 2025-12-15 Pending — BNYMLS
- 2024-12-02 Relisted — BNYMLS
- 2024-12-01 Delisted — BNYMLS
- 2024-07-01 Listed $720,000 BNYMLS
- 2010-06-18 Sold (Public Records) $336,500 Public Records
- 2010-04-30 Sold (Public Records) $136,890 Public Records
- 2006-09-05 Sold (Public Records) $550,000 Public Records
- 2006-03-23 Sold (Public Records) $435,000 Public Records
- 2005-05-06 Sold (Public Records) $310,000 Public Records
- 2005-02-04 Sold (Public Records) $265,000 Public Records
- 2001-07-02 Sold (Public Records) $127,000 Public Records
- 1991-06-24 Sold (Public Records) $129,000 Public Records
- 1989-10-11 Sold (Public Records) $63,500 Public Records
- 1981-02-01 Sold (Public Records) $12,727 Public Records
Property tax history
+5.1%/yrLatest (2025): $2,409 · +3.3% YoY. Source: county tax records.
Cash-flow waterfall
monthlySold comps — $/sqft
last 12 mo · ≤1 miLoading sold comps…