2231 E 5th St #207 · Lehigh Acres, FL
Flood risk 1/10 · Minimal
- FEMA flood zone
- X (unshaded)
- Chance of flooding over 30 yrs
- 0.0%
- Est. flood insurance / yr
- $507 – $1,088
Fire risk 1/10 · Minimal
- Est. fire insurance / yr
- $947 – $1,759
Heat risk 9/10 · Severe
- Hot days now (above 108°F)
- 7 days/yr
- Hot days in 30 yrs
- 28 days/yr
Wind risk 10/10 · Severe
- Chance of severe wind over 30 yrs
- 99.0%
Air-quality risk 2/10 · Minimal
- Unhealthy air days now
- 1 days/yr
- Unhealthy air days in 30 yrs
- 2 days/yr
Risk factors via First Street. Map © Google.
Why this score? — see what drove the D- grade
The composite is a weighted blend of 9 inputs, each scored 0–100. Each bar is that input's sub-score; the figure is the points it added to the 100-point composite (weight × sub-score).
- Cash flow +9.9/30.0
- ARV discount +7.5/15.0
- 1% rule +5.2/10.0
- Schools +4.1/10.0
- Livability +3.0/5.0
- DSCR +2.8/10.0
- Condition / age +2.5/5.0
- Rent growth +2.3/5.0
- Appreciation +0.0/10.0
$139,900
🖨 Deal sheet 📄 Offer letter ✓ Due diligence
Listing remarks
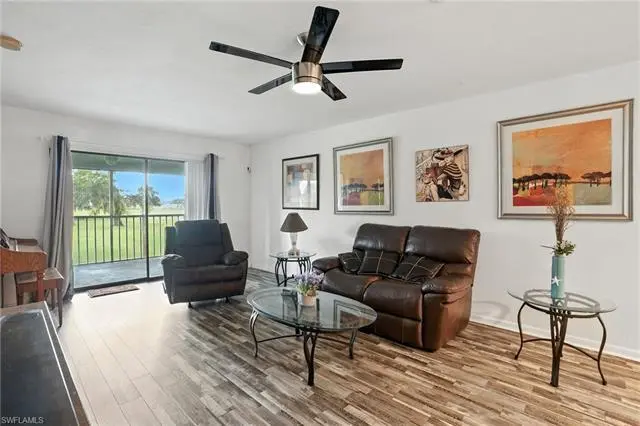
Welcome to Golf View Manor, a well-maintained 55+ community designed for mature adults seeking a peaceful, low-maintenance lifestyle. This second-floor condominium offers 2 bedrooms, 2 bathrooms, and an open-concept floor plan designed for comfortable Florida living. Enjoy breathtaking golf course views from your private screened lanai, the perfect place to relax with your morning coffee or unwind at the end of the day. Inside, you'll find new luxury vinyl plank flooring, new updates throughout and a spacious layout that allows for easy entertaining and everyday living. For added convenience and peace of mind, the smart door lock system and security cameras are included in the sale. Residen
Key facts
- Security cameras
- Community pool
- Golf course views
Tags
Property features AI
Finance
- Other: Part of a complex with 16 units (10 units in the building); 2 units per floor; single-floor building; Restrictions: Deeded, limited number of vehicles, no RVs
- HOA & community: Mandatory HOA; Monthly HOA fee of $364; Annual recurring HOA fees total $4,368; One-time fees $100; Professional management; HOA maintenance covers insurance, irrigation water, lawn/land maintenance, pest control (exterior), reserves, street maintenance and street lights, legal/accounting, manager; Community amenities include community pool, bike storage, sidewalks, and streetlights; Community type: Condo/Hotel
Exterior
- Parking: 1 assigned parking space; Guest parking available
- Utilities: Central water; Central sewer; Cable available
- Home design: Residential condo in a low-rise (1–3) building; Located in Golf View Manor Condo development; Rear exposure faces southwest; Unit/lot number 207
- Construction: Concrete block construction; Built in 1987
- Exterior features: Stucco exterior; Sliding windows; Shingle roof; Golf course view; Central irrigation; Zero lot line; Paved road access
Interior
- Kitchen: Electric cooktop; Dishwasher; Disposal; Microwave; Refrigerator; Pantry
- Bedrooms: 2 bedrooms with a split bedroom floor plan
- Flooring: Laminate; Tile
- Bathrooms: 2 full bathrooms; Master bathroom with shower only
- Heating & cooling: Central electric heat; Central electric cooling; Ceiling fans (2)
- Interior features: Built-in cabinets; High-speed internet available; Pantry; Smoke detectors; Breakfast bar / dining in living area; Screened lanai/porch; Laundry in residence; Dome kitchen; Unfurnished
- Laundry & utility: Washer and dryer in unit
Neighborhood map
What this means for you Summary
Snapshot
- This is a 2-bed/2.0-bath condo listed at $140k.
Deal economics
- At list price, monthly cash flow is $-87 ($-1k/yr) — negative.
- To cash-flow at today's rent, offer at most $125k (11.0% below list).
- Meets the 1% rule at list price ($1k rent vs $140k).
- Recommended offer: $125k (11.0% below list) — sets the bar for cash-flow.
Location & tenants
- Location reads 59/100 on livability (#826 in FL) — a working-class tenant base; expect higher turnover. Strengths: cost of living A+, housing A+; Watch: crime C-, employment D+, schools D-.
- Lee (suburban): math 47% / reading 50% proficiency, ranked #42 of 73 in FL (top 58%) — families likely to look elsewhere, expect single-tenant / working-renter base with shorter leases.
- Market conditions: Rents soft (-0.8%/yr); 641 active listings in the ZIP; 10 comparable units currently listed for rent nearby; rentals at typical pace (median 24d on market — plan ~3-4 weeks tenant-placement turnaround); 15,411 units permitted in Lee County in 2024 (4,686 in 5+ unit buildings).
- This rent runs 33% of the median local income ($51k/yr) — at the standard rent-burdened threshold; future hikes will face affordability resistance.
Forward outlook
- Local home prices are declining (-3.0%/yr); year-one equity from $967 of loan paydown is wiped out by about $4k of value loss. Plan a longer hold.
- Lee County population projected at +44% by 2050 — long-run rental-demand tailwind backs the buy-and-hold thesis.
Negotiation context
- Only 13 days on market — expect competitive offers; lowballing is unlikely to land.
- 6 sale attempts since 11y ago with the ask held roughly flat each time — persistent listings suggest the price (not the market) is what's stuck; bring a comps-based counter.
- Current owner paid $108k; 30% above their basis — modest negotiation headroom, anchor on the comps not their cost.
Risks & watch-outs
- Watch-outs: HOA is 25% of rent.
- Climate carrying-cost: severe wind risk, 99% chance of damaging wind over 30y; extreme-heat days projected 7→28/yr by 2055 (HVAC capex compounding) — expect insurance premiums to compound above CPI over the hold.
Questions for the listing agent
- What do current leases actually rent for vs. the listed asking? Can we see a recent rent roll and the last 12 months of T-12 income?
- What does the HOA fee cover, when was the last increase, and are there any pending special assessments or reserve-fund shortfalls?
- Any open or pending special assessments — roof, HVAC, plumbing, elevator, façade? What's the per-unit balance and payoff schedule, and is the seller paying it off at close or rolling it to the buyer?
- Is there a deadline driving the sale (1031 exchange, divorce, estate, relocation)? That informs how much negotiation room exists.
- Schools are D-rated, which usually means shorter tenancies and higher turnover. Who's the typical renter profile here, and what's been the actual vacancy rate?
- The area grade is low — what's the realistic commute time and amenity access for the typical tenant pool here? Any planned neighborhood developments (good or bad) we should know about?
- What's the average days-on-market for RENTAL listings here right now (not sales)? A rising rental-DOM trend means longer vacancies and softer asking-rent achievability than the comps imply.
- What's the recent tenant-quality profile in this submarket — average credit score on applications, eviction rate, late-payment / NSF rate, and stable-employment percentage? A property-management company in the area should have these aggregated.
- How much new apartment / multifamily construction is in the pipeline within 1–3 miles? Heavy new supply (>2% of stock underway) typically softens rents 12–24 months out; light construction supports rent growth.
Investment metrics
- 1% rule
- 1.02% ✓
- Cap rate
- 5.55%
- Cash-on-cash
- -2.67%
- DSCR
- 0.88
- GRM
- 8.1
CMA / ARV
No comps found within radius.
Projected returns pro-forma
-3.0% appreciation · 0.0% rent growth · sell at horizon
- IRR
- -25.0%
- Equity multiple
- 0.18×
- Total profit
- $-32,236
- Equity at exit
- $20,860
- IRR
- -39.4%
- Equity multiple
- -0.29×
- Total profit
- $-50,714
- Equity at exit
- $12,096
Cash invested: $39,172 (down + closing). Projections, not guarantees.
Landlord ↔ Tenant lean methodology
- Overall (STATE)
- 87 Strongly Landlord-Friendly
- State Florida
- 87 Strongly Landlord-Friendly · R+3
- County
- — inherits STATE
- City
- — inherits STATE
ZIP-level market 33936
- Home prices YoY
- -19.9%
- Rents YoY
- -0.8%
- Active inventory
- 641
- Price-to-rent
- 8.1×
Monthly cashflow live
- Estimated rent
- $1,432 high interval (Pro) →
- Mortgage (P&I)
- −$734
- Tax from tax record
- −$62 /mo · $747/yr
- Insurance
- −$58
- HOA
- −$364
- Vacancy / Maint / Mgmt
- −$301
- Net cashflow
- $-87
Break-even live
UW: 25.0% down · 7.5% · 30yr · 1.5% tax · 5.0% vac · 8.0% maint · 8.0% mgmt
Financing live
Cash to close
- Down payment
- $34,975
- Closing costs
- $4,197
- Reserves months
- —
- Total cash needed
- —
Loan-product check · same deal, 3 products live
Conventional
25% down · 7.5% · 30yr
- Down + closing
- —
- Monthly P&I
- —
- Monthly cashflow
- —
- DSCR
- —
- Eligible?
- —
Personal DTI + credit; lowest rate.
DSCR
20% down · 8.5% · 30yr
- Down + closing
- —
- Monthly P&I
- —
- Monthly cashflow
- —
- DSCR
- —
- Eligible?
- —
No personal income docs; deal must DSCR.
Hard money
10% down · 12.0% · 12mo
- Down + closing
- —
- Monthly P&I
- —
- Monthly cashflow
- —
- DSCR
- —
- Eligible?
- —
Short-term bridge; refi at stabilization.
Rent comps 10 comps
| Address | Beds | Baths | Sqft | Rent | $/sqft | DOM | Units | Dist |
|---|---|---|---|---|---|---|---|---|
| 2201 E 5th St #23 Lehigh Acres, FL | 2.0 | 2.0 | 1011 | $1,300 | $1.29 | 3d | 1 | 0.07mi |
| 2213 Gardenia Way Lehigh Acres, FL | 2.0 | 1.5 | 900 | $1,740 | $1.93 | 23d | 1 | 0.11mi |
| 343 Joel Blvd #111 Lehigh Acres, FL | 2.0 | 2.0 | 921 | $900 | $0.98 | 23d | 1 | 0.30mi |
| 333 Joel Blvd Lehigh Acres, FL | 2.0 | 1.0–2.0 | 877 | $1,048 | $1.19 | 16d | 2 | 0.36mi |
| 321 Dania St Lehigh Acres, FL | 2.0 | 2.0 | 915 | $1,800 | $1.97 | 23d | 1 | 0.59mi |
| 732 Joel Blvd Lehigh Acres, FL | 2.0 | 2.0 | 788 | $1,200 | $1.52 | 23d | 1 | 0.75mi |
| 738 Joel Blvd Lehigh Acres, FL | 2.0 | 2.0 | 968 | $1,050 | $1.08 | 23d | 1 | 0.75mi |
| 198 Joel Blvd #6 Lehigh Acres, FL | 2.0 | 2.0 | 1036 | $1,200 | $1.16 | 3d | 1 | 0.88mi |
| 347 Richland Rd Lehigh Acres, FL | 2.0 | 2.0 | 1040 | $1,150 | $1.11 | 23d | 1 | 1.00mi |
| 3803 E 6th St Lehigh Acres, FL | 3.0 | 2.0 | 1100 | $1,485 | $1.35 | 23d | 1 | 1.42mi |
HOA detail condo
- Monthly dues
- $364 · $4,368/yr
- Likely covers
- security
- Assessments
- None detected in remarks — confirm with the listing agent.
Listing history 10 events
-
2026-06-18days on market $139,900 Active 13 DOM
-
2026-06-17days on market $139,900 Active 12 DOM
-
2026-06-16days on market $139,900 Active 11 DOM
-
2026-06-15days on market $139,900 Active 10 DOM
-
2026-06-13days on market $139,900 Active 8 DOM
-
2026-06-10days on market $139,900 Active 5 DOM
-
2026-06-09days on market $139,900 Active 4 DOM
-
2026-06-08days on market $139,900 Active 3 DOM
-
2026-06-07remarks 699-char remark
-
2026-06-07$139,900 Active 2 DOM
ⓘ Source: listings_history table (triggers on properties + properties_extension) + one-shot
backfill from property_details.listing_events for pre-trigger history.
Tax reassessment forecast FL · Resets to sale price
- Current annual tax
- $747 · $62/mo
- Projected year-2 tax
- $1,161 · $97/mo
- Expected delta
- +$414/yr (+$35/mo · 55.4%)
ⓘ Screening estimate from a state-policy table — verify with the county assessor before closing.
Climate risk First Street
- Flood 1/10 Low FEMA zone X (unshaded) · 0% chance over 30 yrs
- Wildfire 1/10 Low
- Heat 9/10 Extreme 7 d/yr ≥108°F today · 28 d/yr by 30 yrs out
- Wind 10/10 Extreme 99% chance of damaging wind over 30 yrs
- Air quality 2/10 Low 1 unhealthy d/yr today · 2 by 30 yrs out
Nearby sold comps map
Loading sold comps map…
Walkable amenities ~0.75 mi
Loading nearby amenities…
Taxation est. · year 1
- Rental income
- $17,181
- − Mortgage interest
- −$7,837
- − Property taxes
- −$747
- − Insurance
- −$700
- − Repairs & maintenance
- −$1,375
- − Management
- −$1,375
- − HOA
- −$4,368
- − Depreciation
- −$4,070
- Taxable loss
- −$3,289
- Est. tax savings @ 24.0%
- +$789
- After-tax cash flow
- $-256/yr
For passive investors: Depreciation is non-cash, so a rental often shows a tax loss while cash-flowing — sheltering income. Rental losses are passive: they offset passive income freely, and up to $25,000/yr can offset ordinary (W-2) income if you actively participate and your MAGI is under $100k (phasing out to $0 by $150k); unused losses carry forward. On sale, claimed depreciation is recaptured at up to 25%, and gains may owe capital-gains tax (a 1031 exchange can defer both). Figures are a year-1 estimate at your 24.0% rate — not tax advice; consult a CPA.
Schools (NCES district)
- District
- Lee
- NCES district ID
- 1201080
- Math proficiency
- 47% ▼ -11.00%
- Reading proficiency
- 50% ▼ -4.00%
- Median HH income
- $49,518
- Composite
- 41.49/100
- National rank
- #3458
- State rank
- #42 of 73 in FL
Livability — Lehigh Acres
- Score
- 59/100
- State rank
- #826
- US rank
- #20055
Category grades
Schools grade is shown separately in the Schools card above.
Census & demographics
- Census place
- Lehigh Acres, FL
- County
- Lee County · 788,662 people
- City population
- 130,638
- Metro
- Cape Coral-Fort Myers, FL
- Population (ZIP)
- 27,967
- Household income
- $51,417
- Rent vs Own
- Severe rent burden
- 1027.0
Population outlook (Lee County) Hauer SSP2
- Today (2025)
- 871,946 people
- By 2030
- 955,468 · +9.6%
- By 2040
- 1,113,587 · +27.7%
- By 2050
- 1,256,891 · +44.1%
- By 2075
- 1,560,270 · +78.9%
- By 2100
- 1,726,848 · +98.0%
Race, ethnicity, and origin ACS 2023
- Neighborhood character
- Diverse neighborhood (Simpson 0.63)
- Race & ethnicity
- Hispanic / Latino 44% White 41% Two or more races 21% Black 9% Asian 1%
- Hispanic origin (detail)
- Mexican 7% Puerto Rican 9% Cuban 18% Dominican 2%
- Common ancestry
- Hispanic 3% Romanian 2% Lithuanian 1%
- Foreign-born
- 28% · Canada, Jamaica
- Languages at home
- 59% English-only · Spanish 36% French/Haitian/Cajun 3% Tagalog/Filipino 1%
Political lean MEDSL · Lee
- 2024 margin
- Strong R (+28.4) · D 35.5% · R 63.9%
- 2008→2024 swing
- -18.0pp toward R · 2008: -10.4pp · 2024: -28.4pp
- All cycles
- 2024: R+28.4 2020: R+19.2 2016: R+20.4 2012: R+16.6 2008: R+10.4
Not yet ingested
- Civics
- —
Market trends
- HPI YoY
- ▼ -86.78%
- Current HPI
- 348.8631
- Rent YoY
- ▼ -0.77%
- Metro
- Cape Coral-Fort Myers, FL
- State GDP YoY
- ▲ 3.28%
- F500 in state
- 36
Industry mix (Fortune 500 HQ in FL)
| Industry | F500 HQs | Revenue |
|---|---|---|
| Industrial Technology | 2 | $29B |
|
||
| Insurance | 2 | $17B |
|
||
| Retail | 1 | $60B |
|
||
| Technology Distribution | 1 | $58B |
|
||
| Homebuilding | 1 | $35B |
|
||
| Technology Manufacturing | 1 | $35B |
|
||
Price history
+105.1% since first listed25 events — show timeline
- 2026-06-05 Listed $139,900 NAPLESMLS
- 2025-12-04 Listing Removed — NAPLESMLS
- 2025-10-18 Price Changed $144,500 NAPLESMLS
- 2025-08-09 Listed $149,900 NAPLESMLS
- 2025-07-31 Listing Removed — MARMLS
- 2025-07-31 Listing Removed — NAPLESMLS
- 2025-05-13 Price Changed $159,900 NAPLESMLS
- 2025-04-15 Listed $165,000 MARMLS
- 2025-02-08 Listed $165,000 NAPLESMLS
- 2022-06-15 Sold (Public Records) $108,000 Public Records
- 2022-06-02 Sold (MLS) $108,000 FORTMLS
- 2022-04-08 Listed $115,000 FORTMLS
- 2016-10-07 Sold (Public Records) $55,000 Public Records
- 2016-10-06 Price Changed $55,000 FORTMLS
- 2016-10-03 Sold (MLS) $55,000 FORTMLS
- 2016-10-02 Price Changed $59,900 FORTMLS
- 2016-03-08 Pending — FORTMLS
- 2015-07-07 Listed $59,900 FORTMLS
- 2008-12-19 Sold (Public Records) $72,000 Public Records
- 2008-11-19 Sold (MLS) $72,000 FORTMLS
- 2008-11-11 Price Changed $104,900 FORTMLS
- 2002-04-05 Sold (Public Records) $45,500 Public Records
- 2002-03-20 Sold (MLS) $45,500 FORTMLS
- 2002-02-21 Price Changed $47,000 FORTMLS
- 1987-03-19 Sold (Public Records) $68,200 Public Records
Property tax history
+3.5%/yrLatest (2025): $747 · +8.3% YoY. Source: county tax records.
Cash-flow waterfall
monthlySold comps — $/sqft
last 12 mo · ≤1 miLoading sold comps…