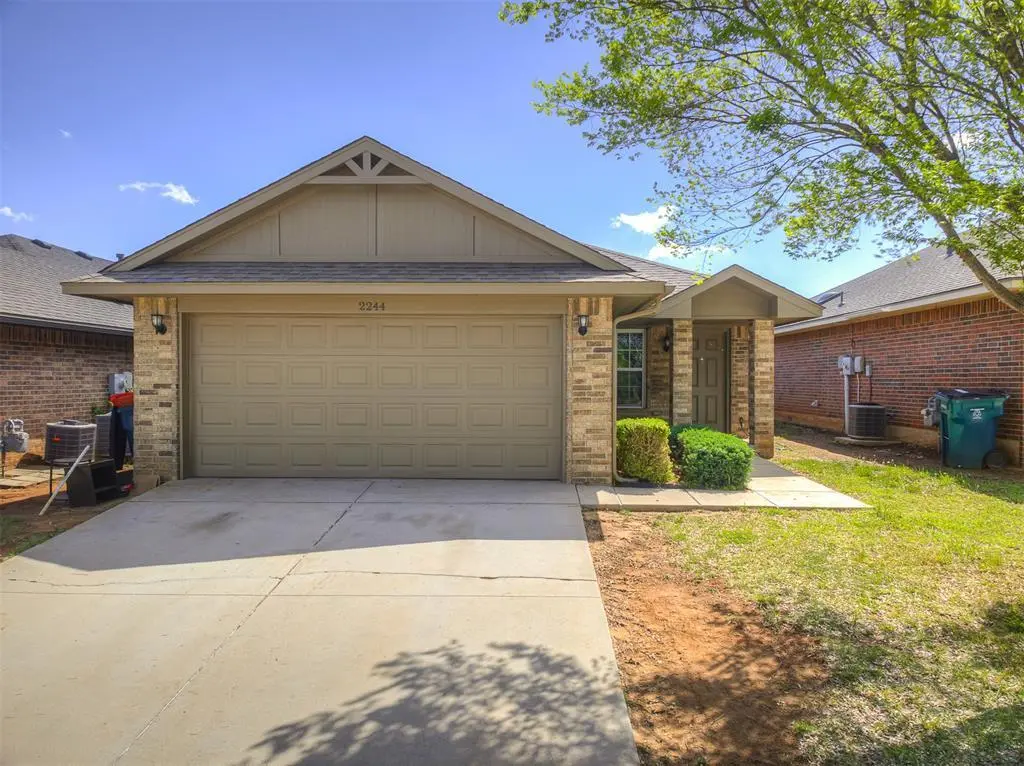
2244 NW 197th St · Oklahoma City, OK
Flood risk 1/10 · Minimal
- FEMA flood zone
- X (unshaded)
- Chance of flooding over 30 yrs
- 0.0%
- Est. flood insurance / yr
- $507 – $1,088
Fire risk 4/10 · Minor
- Est. fire insurance / yr
- $2,463 – $4,575
Heat risk 6/10 · Moderate
- Hot days now (above 108°F)
- 7 days/yr
- Hot days in 30 yrs
- 19 days/yr
Wind risk 2/10 · Minimal
- Chance of severe wind over 30 yrs
- 4.0%
Air-quality risk 2/10 · Minimal
- Unhealthy air days now
- 1 days/yr
- Unhealthy air days in 30 yrs
- 1 days/yr
Risk factors via First Street. Map © Google.
Why this score? — see what drove the D grade
The composite is a weighted blend of 9 inputs, each scored 0–100. Each bar is that input's sub-score; the figure is the points it added to the 100-point composite (weight × sub-score).
- Cash flow +13.3/30.0
- ARV discount +8.6/15.0
- DSCR +4.0/10.0
- Livability +4.0/5.0
- Schools +3.6/10.0
- 1% rule +3.5/10.0
- Rent growth +2.8/5.0
- Condition / age +2.5/5.0
- Appreciation +0.0/10.0
$212,900
🖨 Deal sheet (PDF) 📄 Offer letter ✓ Due diligence
Listing remarks
Beautiful 3-bedroom, 2-bath home in a quiet Edmond neighborhood! Open floor plan with plenty of natural light, updated kitchen, and spacious living areas. Private backyard perfect for relaxing or entertaining. Conveniently located near schools, shopping, and major roads. Don’t miss this move-in ready gem!”
Key facts
- Open floor plan
- Private backyard
- Updated kitchen
Tags
Property features AI
Finance
- Other: Living area reported as 1,240 (assessor)
- Financial info: Loan qualification possible (qualifies for loan); Assumability unknown
- HOA & community: Mandatory association dues ($200) that include grounds maintenance
Exterior
- Parking: 2-car garage
- Utilities: Water and sewer not specified; Power not specified
- Home design: Single family residence; One-story; Residential property; Existing build status
- Construction: Brick and concrete construction; Composition roof; Slab foundation; Built (existing)
- Exterior features: Covered porch; Lot features: Other
Interior
- Bedrooms: 3 bedrooms (all on one level)
- Bathrooms: 2 full bathrooms
- Interior features: One living area; No fireplace
Neighborhood map
What this means for you Summary
Snapshot
- This is a 3-bed/2.0-bath single-family listed at $213k.
Deal economics
- At list price, monthly cash flow is $2 ($23/yr) — positive.
- The deal already cash-flows at list — no discount required.
- To meet the 1% rule (rent ≥ 1% of price), the offer needs to be $181k (15.1% below list).
- Recommended offer: $181k (15.1% below list) — sets the bar for 1% rule.
- Cap rate 6.3% vs local median 3.7% in Oklahoma City — top-decile yield for the area; either an underpriced asset or a hidden risk that comps aren't pricing in. Stress-test before assuming the spread holds.
Location & tenants
- Location reads 80/100 on livability (#3 in OK, #1,635 nationally) — a professional / high-income tenant draw. Strengths: amenities A+, commute A+, cost of living A+; Watch: crime F.
- Edmond (suburban): math 38% / reading 40% proficiency, ranked #11 of 270 in OK (top 4%) — families likely to look elsewhere, expect single-tenant / working-renter base with shorter leases.
- Zoned schools: Frontier Es (math 42% / reading 48%, grade D-, #60 of 845 statewide, top 7%, 826 students, 0% FRL); Summit Ms (math 22% / reading 27%, grade F, #97 of 345 statewide, top 31%, 940 students, 0% FRL); Santa Fe Hs (math 36% / reading 52%, grade F, #18 of 447 statewide, top 4%, 2,796 students, 0% FRL) — zoned schools average 0% FRL vs 22% district-wide (22 pts lower); this property's tenant base skews higher-income than the district average.
- Market conditions: Rents rising (+1.2%/yr); 647 active listings in the ZIP; 23 comparable units currently listed for rent nearby; rentals leasing fast (median 6d on market — plan ~1-2 weeks tenant-placement turnaround); high-income renter base; 5,365 units permitted in Oklahoma County in 2024 (569 in 5+ unit buildings).
- This rent is only 17% of the median local income ($127k/yr) — well below the 30% rent-burden line; pricing power to push rent on renewal without tenant pushback.
Forward outlook
- Local home prices are declining (-3.0%/yr); year-one equity from $1k of loan paydown is wiped out by about $6k of value loss. Plan a longer hold.
- Oklahoma County population projected at +41% by 2050 — long-run rental-demand tailwind backs the buy-and-hold thesis.
Negotiation context
- It's been on market 18 days — a 2% lower offer ($210k) is reasonable based on typical stale-listing flexibility.
- 3 sale attempts since 2y ago with the ask held roughly flat each time — persistent listings suggest the price (not the market) is what's stuck; bring a comps-based counter.
Risks & watch-outs
- Climate carrying-cost: extreme-heat days projected 7→19/yr by 2055 (HVAC capex compounding) — expect insurance premiums to compound above CPI over the hold.
Questions for the listing agent
- What does the HOA fee cover, when was the last increase, and are there any pending special assessments or reserve-fund shortfalls?
- Is there a deadline driving the sale (1031 exchange, divorce, estate, relocation)? That informs how much negotiation room exists.
- Schools are F-rated, which usually means shorter tenancies and higher turnover. Who's the typical renter profile here, and what's been the actual vacancy rate?
- Crime grade is F in this area — have there been break-ins, vandalism, or insurance claims at this property in the last 3 years? What carrier currently insures it and at what premium?
- The area grade is low — what's the realistic commute time and amenity access for the typical tenant pool here? Any planned neighborhood developments (good or bad) we should know about?
- What's the average days-on-market for RENTAL listings here right now (not sales)? A rising rental-DOM trend means longer vacancies and softer asking-rent achievability than the comps imply.
- What's the recent tenant-quality profile in this submarket — average credit score on applications, eviction rate, late-payment / NSF rate, and stable-employment percentage? A property-management company in the area should have these aggregated.
- How much new for-sale + rental construction is in the pipeline within 1–3 miles? Heavy new supply typically softens prices + rents 12–24 months out; constrained supply supports both.
Investment metrics
- 1% rule
- 0.85% ✗
- Cap rate
- 6.30%
- Cash-on-cash
- 0.04%
- DSCR
- 1.00
- GRM
- 9.8
CMA / ARV
- ARV (on-the-fly)
- $218,240
- Comps found
- 12
Show comp detail 12 sales within ~0.75 mi
| Address | Dist | Beds/Ba | Sqft | Sold | Price | $/sf | Match |
|---|---|---|---|---|---|---|---|
| 2244 NW 197th St | 0.00mi | 3/2.0 | 1,240 (0%) | 1mo | $212,900 | $172 | 99 |
| 2405 NW 197th St | 0.19mi | 3/2.0 | 1,250 (+1%) | 3mo | $215,000 | $172 | 87 |
| 2300 NW 199th St | 0.10mi | 3/2.0 | 1,300 (+5%) | 1mo | $223,000 | $172 | 86 |
| 2317 NW 198th St | 0.10mi | 3/2.0 | 1,312 (+6%) | 3mo | $212,970 | $162 | 83 |
| 2341 NW 197th St | 0.11mi | 3/2.0 | 1,319 (+6%) | 4mo | $210,000 | $159 | 81 |
| 2404 NW 194th St | 0.29mi | 3/2.0 | 1,276 (+3%) | 1mo | $230,000 | $180 | 80 |
| 19813 Brunswick Ct | 0.42mi | 3/2.0 | 1,260 (+2%) | 4mo | $222,000 | $176 | 74 |
| 2520 NW 199th St | 0.40mi | 3/2.0 | 1,282 (+3%) | 4mo | $250,000 | $195 | 73 |
| 2341 NW 196th Ter | 0.17mi | 3/2.0 | 1,406 (+13%) | 1mo | $250,000 | $178 | 69 |
| 2313 Roca Dr | 0.73mi | 3/2.0 | 1,178 (-5%) | 3mo | $235,000 | $199 | 55 |
| 18625 Cantar Dr | 0.69mi | 3/3.0 | 1,171 (-6%) | 1mo | $235,000 | $201 | 53 |
| 19008 Hecho Dr | 0.60mi | 3/2.0 | 1,385 (+12%) | 3mo | $240,000 | $173 | 50 |
Match score weights: distance 35% · size 25% · config 20% · recency 20%. Top-matched comps best support the ARV.
Projected returns pro-forma
-3.0% appreciation · 1.21% rent growth · sell at horizon
- IRR
- -18.2%
- Equity multiple
- 0.37×
- Total profit
- $-37,575
- Equity at exit
- $31,744
- IRR
- -14.3%
- Equity multiple
- 0.24×
- Total profit
- $-45,226
- Equity at exit
- $18,408
Cash invested: $59,612 (down + closing). Projections, not guarantees.
Landlord ↔ Tenant lean methodology
- Overall (STATE)
- 83 Strongly Landlord-Friendly
- State Oklahoma
- 83 Strongly Landlord-Friendly · R+20
- County
- — inherits STATE
- City
- — inherits STATE
ZIP-level market 73012
- Home prices YoY
- -17.9%
- Rents YoY
- 1.2%
- Active inventory
- 647
- Price-to-rent
- 9.8×
Monthly cashflow live
- Estimated rent
- $1,808 high interval (Pro) →
- Mortgage (P&I)
- −$1,116
- Tax from tax record
- −$204 /mo · $2,449/yr
- Insurance
- −$89
- HOA
- −$17
- Vacancy / Maint / Mgmt
- −$380
- Net cashflow
- $2
Break-even live
Sensitivity live
| Price | -10% $122 | -5% $62 | +0% $2 | +5% $-58 | +10% $-119 |
|---|---|---|---|---|---|
| Rent | -10% $-141 | -5% $-69 | +0% $2 | +5% $73 | +10% $145 |
| Rate | -1.0pp $109 | -0.5pp $56 | base $2 | +0.5pp $-53 | +1.0pp $-109 |
UW: 25.0% down · 7.5% · 30yr · 1.5% tax · 5.0% vac · 8.0% maint · 8.0% mgmt
Financing live
Cash to close
- Down payment
- $53,225
- Closing costs
- $6,387
- Reserves months
- —
- Total cash needed
- —
Loan-product check · same deal, 3 products live
Conventional
25% down · 7.5% · 30yr
- Down + closing
- —
- Monthly P&I
- —
- Monthly cashflow
- —
- DSCR
- —
- Eligible?
- —
Personal DTI + credit; lowest rate.
DSCR
20% down · 8.5% · 30yr
- Down + closing
- —
- Monthly P&I
- —
- Monthly cashflow
- —
- DSCR
- —
- Eligible?
- —
No personal income docs; deal must DSCR.
Hard money
10% down · 12.0% · 12mo
- Down + closing
- —
- Monthly P&I
- —
- Monthly cashflow
- —
- DSCR
- —
- Eligible?
- —
Short-term bridge; refi at stabilization.
Rent comps 23 comps
| Address | Beds | Baths | Sqft | Rent | $/sqft | DOM | Units | Dist |
|---|---|---|---|---|---|---|---|---|
| 2317 NW 198th St Edmond, OK | 3.0 | 2.0 | 1320 | $1,700 | $1.29 | 25d | 1 | 0.08mi |
| 2364 NW 197th St Edmond, OK | 3.0 | 2.0 | 1250 | $1,595 | $1.28 | 3d | 1 | 0.13mi |
| 19704 Vivace Dr Edmond, OK | 3.0 | 2.0 | 1450 | $1,699 | $1.17 | 3d | 1 | 0.20mi |
| 19601 N Pennsylvania Ave Edmond, OK | 3.0 | 2.5 | 1441 | $1,745 | $1.21 | 3d | 1 | 0.20mi |
| 19501 N Pennsylvania Ave Edmond, OK | 2.0–3.0 | 1.0–2.0 | 1122 | $1,750 | $1.56 | 3d | 11 | 0.24mi |
| 19704 Taggert Dr Edmond, OK | 3.0 | 2.0 | 1330 | $1,645 | $1.24 | 6d | 1 | 0.32mi |
| 19708 Barrister Cir Edmond, OK | 3.0 | 2.0 | 1257 | $1,595 | $1.27 | 3d | 1 | 0.42mi |
| 19613 Bolton Rd Edmond, OK | 3.0 | 2.0 | 1340 | $1,795 | $1.34 | 3d | 1 | 0.63mi |
| 2800 NW 192nd St Edmond, OK | 1.0–2.0 | 1.0–2.0 | 1118 | $2,270 | $2.03 | 3d | 11 | 0.68mi |
| 2925 NW 195th St Edmond, OK | 3.0 | 2.0 | 1342 | $1,695 | $1.26 | 25d | 1 | 0.72mi |
| 2921 NW 195th St Edmond, OK | 3.0 | 2.0 | 1342 | $1,695 | $1.26 | 12d | 1 | 0.72mi |
| 2344 Roca Dr Edmond, OK | 3.0 | 2.0 | 1213 | $1,650 | $1.36 | 13d | 1 | 0.81mi |
| 2941 NW 195th St Edmond, OK | 3.0 | 2.0 | 1342 | $1,695 | $1.26 | 6d | 1 | 0.92mi |
| 2945 NW 195th St Edmond, OK | 3.0 | 2.0 | 1253 | $1,650 | $1.32 | 6d | 1 | 0.93mi |
| 19501 Conway Dr Edmond, OK | 3.0 | 2.0 | 1253 | $1,650 | $1.32 | 6d | 1 | 0.94mi |
| 19505 Conway Dr Edmond, OK | 3.0 | 2.0 | 1342 | $1,695 | $1.26 | 25d | 1 | 0.94mi |
| 19513 Conway Dr Edmond, OK | 3.0 | 2.0 | 1253 | $1,650 | $1.32 | 25d | 1 | 0.94mi |
| 19521 Conway Dr Edmond, OK | 3.0 | 2.0 | 1253 | $1,650 | $1.32 | 25d | 1 | 0.94mi |
| 19509 Conway Dr Edmond, OK | 3.0 | 2.0 | 1342 | $1,695 | $1.26 | 6d | 1 | 0.94mi |
| 19629 Ferris Dr Edmond, OK | 3.0 | 2.0 | 1347 | $1,850 | $1.37 | 25d | 1 | 1.02mi |
| 2717 NW 178th St Edmond, OK | 1.0–3.0 | 1.0–2.0 | 943 | $1,749 | $1.85 | 3d | 15 | 1.43mi |
| 3005 NW 183rd St Edmond, OK | 3.0 | 2.0 | 1320 | $1,650 | $1.25 | 4d | 1 | 1.45mi |
| 2821 NW 180th St Edmond, OK | 1.0–2.0 | 1.0–2.0 | 745 | $1,950 | $2.62 | 3d | 1 | 1.48mi |
HOA detail
- Monthly dues
- $17 · $204/yr
Listing history 8 events
-
2026-05-01status Pending
-
2026-04-20price $212,900
-
2026-03-26$215,000 Active
-
2024-10-03historical $1,450
-
2024-10-01$1,450
-
2024-09-26historical $1,525
-
2024-09-20price $1,525
-
2024-09-16$1,550
ⓘ Source: listings_history table (triggers on properties + properties_extension) + one-shot
backfill from property_details.listing_events for pre-trigger history.
Tax reassessment forecast OK · Resets to sale price
- Current annual tax
- $2,449 · $204/mo
- Projected year-2 tax
- $2,449 · $204/mo
- Expected delta
- $0/yr ($0/mo · 0.0%)
ⓘ Screening estimate from a state-policy table — verify with the county assessor before closing.
Climate risk First Street
- Flood 1/10 Low FEMA zone X (unshaded) · 0% chance over 30 yrs
- Wildfire 4/10 Moderate
- Heat 6/10 Major 7 d/yr ≥108°F today · 19 d/yr by 30 yrs out
- Wind 2/10 Low 4% chance of damaging wind over 30 yrs
- Air quality 2/10 Low 1 unhealthy d/yr today · 1 by 30 yrs out
Nearby sold comps map
Loading sold comps map…
Walkable amenities ~0.75 mi
Loading nearby amenities…
Taxation est. · year 1
- Rental income
- $21,694
- − Mortgage interest
- −$11,926
- − Property taxes
- −$2,449
- − Insurance
- −$1,064
- − Repairs & maintenance
- −$1,736
- − Management
- −$1,736
- − HOA
- −$204
- − Depreciation
- −$6,193
- Taxable loss
- −$3,614
- Est. tax savings @ 24.0%
- +$867
- After-tax cash flow
- $890/yr
For passive investors: Depreciation is non-cash, so a rental often shows a tax loss while cash-flowing — sheltering income. Rental losses are passive: they offset passive income freely, and up to $25,000/yr can offset ordinary (W-2) income if you actively participate and your MAGI is under $100k (phasing out to $0 by $150k); unused losses carry forward. On sale, claimed depreciation is recaptured at up to 25%, and gains may owe capital-gains tax (a 1031 exchange can defer both). Figures are a year-1 estimate at your 24.0% rate — not tax advice; consult a CPA.
Schools (NCES district)
- District
- Edmond
- NCES district ID
- 4010590
- Math proficiency
- 38% ▼ -12.00%
- Reading proficiency
- 40% ▼ -12.00%
- Median HH income
- $73,212
- Composite
- 35.88/100
- National rank
- #4814
- State rank
- #11 of 270 in OK
Livability — Oklahoma City
- Score
- 80/100
- State rank
- #3
- US rank
- #1635
Category grades
Schools grade is shown separately in the Schools card above.
Census & demographics
- Census place
- Oklahoma City, OK
- County
- Oklahoma County · 771,644 people
- City population
- 498,656
- Metro
- Oklahoma City, OK
- Population (ZIP)
- 46,993
- Household income
- $126,659
- Rent vs Own
- Severe rent burden
- 898.0
Population outlook (Oklahoma County) Hauer SSP2
- Today (2025)
- 911,875 people
- By 2030
- 982,413 · +7.7%
- By 2040
- 1,130,468 · +24.0%
- By 2050
- 1,288,422 · +41.3%
- By 2075
- 1,711,482 · +87.7%
- By 2100
- 2,088,448 · +129.0%
Race, ethnicity, and origin ACS 2023
- Neighborhood character
- Predominantly White (67%)
- Race & ethnicity
- White 67% Two or more races 10% Black 8% Asian 8% Hispanic / Latino 8% Native American 2%
- Hispanic origin (detail)
- Mexican 5%
- Common ancestry
- Italian 3% Slovak 2% Romanian 2%
- Foreign-born
- 11% · Canada, China, Vietnam
- Languages at home
- 86% English-only · Spanish 4% Other Indo-European 2% Chinese 2%
Political lean MEDSL · Oklahoma
- 2024 margin
- Toss-up / Even · D 48.0% · R 49.7% · Other 2.3%
- 2008→2024 swing
- +15.1pp toward D · 2008: -16.8pp · 2024: -1.7pp
- All cycles
- 2024: R+1.7 2020: R+1.1 2016: R+10.5 2012: R+16.7 2008: R+16.8
Not yet ingested
- Civics
- —
Market trends
- HPI YoY
- ▼ -44.41%
- Current HPI
- 203.1105
- Rent YoY
- ▲ 1.21%
- Metro
- Oklahoma City, OK
- State GDP YoY
- ▲ 1.55%
- F500 in state
- 6
Industry mix (Fortune 500 HQ in OK)
| Industry | F500 HQs | Revenue |
|---|---|---|
| Energy | 3 | $48B |
|
||
Price history
+13635.5% since first listed8 events — show timeline
- 2026-05-01 Pending — MLSOK
- 2026-04-20 Price Changed $212,900 MLSOK
- 2026-03-26 Listed $215,000 MLSOK
- 2024-10-03 Rental Removed $1,450 Avail
- 2024-10-01 Listed for Rent $1,450 Avail
- 2024-09-26 Rental Removed $1,525 Avail
- 2024-09-20 Price Changed $1,525 Avail
- 2024-09-16 Listed for Rent $1,550 Avail
Property tax history
+3.7%/yrLatest (2025): $2,449 · +5.3% YoY. Source: county tax records.
Cash-flow waterfall
monthlySold comps — $/sqft
last 12 mo · ≤1 miLoading sold comps…