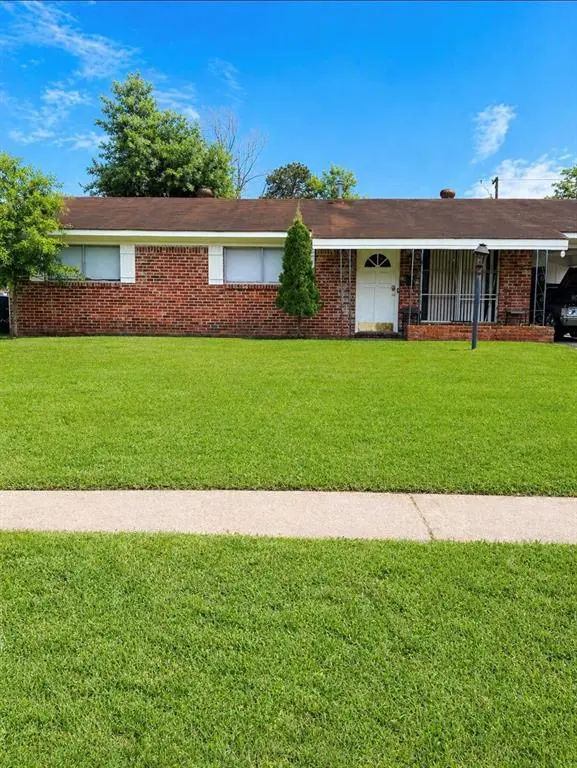
3437 Woodhaven Ln · Shreveport, LA
Flood risk 1/10 · Minimal
- FEMA flood zone
- X (unshaded)
- Chance of flooding over 30 yrs
- 0.0%
- Est. flood insurance / yr
- $507 – $1,088
Fire risk 1/10 · Minimal
- Est. fire insurance / yr
- $1,269 – $2,357
Heat risk 7/10 · Major
- Hot days now (above 110°F)
- 7 days/yr
- Hot days in 30 yrs
- 22 days/yr
Wind risk 6/10 · Moderate
- Chance of severe wind over 30 yrs
- 68.0%
Air-quality risk 2/10 · Minimal
- Unhealthy air days now
- 1 days/yr
- Unhealthy air days in 30 yrs
- 1 days/yr
Risk factors via First Street. Map © Google.
Why this score? — see what drove the C+ grade
The composite is a weighted blend of 9 inputs, each scored 0–100. Each bar is that input's sub-score; the figure is the points it added to the 100-point composite (weight × sub-score).
- Cash flow +25.4/30.0
- ARV discount +11.2/15.0
- DSCR +8.4/10.0
- 1% rule +6.0/10.0
- Rent growth +3.1/5.0
- Livability +3.0/5.0
- Condition / age +2.5/5.0
- Schools +2.2/10.0
- Appreciation +0.0/10.0
$98,000
🖨 Deal sheet 📄 Offer letter ✓ Due diligence
Listing remarks
INVESTOR SPECIAL!! Welcome to 3437 Woodhaven Ln. where comfort meets convenience in the heart of Shreveport! This fixer upper offers a perfect blend of functionality and potential, ideal for downsizers or a first-time buyers who are handy and wants to add their creative touch and make this home theirs, or savvy investors. Step inside to discover a spacious living area filled with natural light, creating a warm and inviting atmosphere for everyday living and entertaining. The kitchen provides ample cabinet and counter space, ready for your personal touch, while the adjoining dining area makes mealtime easy and connected. The bedrooms are generously sized, offering comfort and flexibility
Key facts
- 7,579 sq ft lot
- 2 parking spots
- Built 1965
Property features AI
Finance
- Other: Property can be accessed from Mansfield Rd., West 70th Street, and Jewella Ave.; County: Caddo; Country: United States
- Financial info: Second mortgage: none; Loan type: Treat As Clear
- HOA & community: No homeowners association
Exterior
- Parking: 2 carport spaces; 1 covered parking space; Additional parking available
- Security: Security system; Smoke detector(s); Carbon monoxide detector(s)
- Utilities: City water; City sewer; Electricity available; Phone available; Not in a municipal utility district
- Home design: Single-family residence; Residential property; One story; Preowned (built in 1965); Not attached to another property; Subdivision: Garden Valley Sub
- Construction: Slab foundation; Built in 1965
- Exterior features: Covered porch(es); Lot less than 0.5 acre
Interior
- Kitchen: No kitchen appliance details provided
- Bedrooms: 3 bedrooms (primary bedroom on level 1)
- Flooring: Carpet; Ceramic tile
- Bathrooms: 1 full bathroom; 1 half bathroom
- Heating & cooling: No heating or cooling details provided
- Interior features: Cable TV available; High-speed internet available; One-level layout; Two main living areas and one dining area
- Laundry & utility: Washer hookup; Washer and dryer present
Neighborhood map
What this means for you Summary
Snapshot
- This is a 3-bed/1.5-bath single-family listed at $98k.
Deal economics
- At list price, monthly cash flow is $226 ($3k/yr) — positive.
- The deal already cash-flows at list — no discount required.
- Meets the 1% rule at list price ($1k rent vs $98k).
- Recommended offer: $95k (3.0% below list) — sets the bar for market timing.
- Cap rate 9.1% vs local median 5.7% in Shreveport — top-decile yield for the area; either an underpriced asset or a hidden risk that comps aren't pricing in. Stress-test before assuming the spread holds.
Location & tenants
- Location reads 59/100 on livability (#270 in LA) — a working-class tenant base; expect higher turnover. Strengths: cost of living A+, housing A; Watch: schools D+, crime F, amenities F.
- Caddo Parish (urban): math 21% / reading 32% proficiency, ranked #53 of 98 in LA (top 54%) — low school quality limits family demand, transient renter base, plan for 1-2y turnover; 64% free/reduced lunch — lower-income household profile, screen leases tightly.
- Market conditions: Rents rising (+2.4%/yr); 138 active listings in the ZIP; 14 comparable units currently listed for rent nearby; rentals lingering (median 44d on market — plan ~5-8 weeks vacancy on turnover, expect pricing pressure); 57% of comp listings sitting > 30 days — soft ceiling on asking rent; lower-income renter base — watch delinquency; 221 units permitted in Caddo Parish in 2024 (0 in 5+ unit buildings).
- This rent runs 40% of the median local income ($32k/yr) — at the standard rent-burdened threshold; future hikes will face affordability resistance.
Forward outlook
- Local home prices are declining (-3.0%/yr); year-one equity from $678 of loan paydown is wiped out by about $3k of value loss. Plan a longer hold.
- Caddo County population projected at -15% by 2050 — secular population decline; favor cash flow + early exit over multi-decade hold.
Negotiation context
- It's been on market 48 days — a 3% lower offer ($95k) is reasonable based on typical stale-listing flexibility.
- 2 sale attempts since 2y ago; this cycle's ask has dropped $7k (7%) from the opening price — seller is motivated, your offer sets the floor, not the list.
- Current owner paid $65k; list at $98k implies a 51% gain — meaningful room to come down on a strong offer.
Risks & watch-outs
- Climate carrying-cost: major wind risk, 68% chance of damaging wind over 30y; extreme-heat days projected 7→22/yr by 2055 (HVAC capex compounding) — expect insurance premiums to compound above CPI over the hold.
Questions for the listing agent
- It's been on market 48 days. Have you received any prior offers? Is the seller open to a 3% concession, seller financing, or rate buy-down credit?
- Built in 1965 — when were the roof, HVAC, electrical panel, plumbing, and water heater last replaced?
- Is there a deadline driving the sale (1031 exchange, divorce, estate, relocation)? That informs how much negotiation room exists.
- Schools are D-rated, which usually means shorter tenancies and higher turnover. Who's the typical renter profile here, and what's been the actual vacancy rate?
- Crime grade is F in this area — have there been break-ins, vandalism, or insurance claims at this property in the last 3 years? What carrier currently insures it and at what premium?
- What's the average days-on-market for RENTAL listings here right now (not sales)? A rising rental-DOM trend means longer vacancies and softer asking-rent achievability than the comps imply.
- What's the recent tenant-quality profile in this submarket — average credit score on applications, eviction rate, late-payment / NSF rate, and stable-employment percentage? A property-management company in the area should have these aggregated.
- How much new for-sale + rental construction is in the pipeline within 1–3 miles? Heavy new supply typically softens prices + rents 12–24 months out; constrained supply supports both.
Investment metrics
- 1% rule
- 1.10% ✓
- Cap rate
- 9.06%
- Cash-on-cash
- 9.87%
- DSCR
- 1.44
- GRM
- 7.6
CMA / ARV
- ARV (median comp)
- $106,710
- List price
- $98,000
- Delta
- -8.16%
- Verdict
- FAIR
- Comps
- 20 within 1.0 mi
Show comp detail 12 sales within ~0.75 mi
| Address | Dist | Beds/Ba | Sqft | Sold | Price | $/sf | Match |
|---|---|---|---|---|---|---|---|
| 3206 Red Bud Ln | 0.23mi | 3/1.5 | 1,245 (+3%) | 11mo | $55,000 | $44 | 76 |
| 3430 Woodhaven Ln | 0.03mi | 4/2.0 (+1) | 1,136 (-6%) | 17mo | $169,900 | $150 | 67 |
| 7119 Elsie St | 0.24mi | 2/2.0 (-1) | 1,188 (-2%) | 16mo | $32,000 | $27 | 65 |
| 3811 Liaison Dr | 0.44mi | 3/2.0 | 1,248 (+3%) | 10mo | $59,900 | $48 | 64 |
| 2019 Amelia Ave | 0.70mi | 3/1.0 | 1,243 (+3%) | 2mo | $93,500 | $75 | 59 |
| 7141 Janey St | 0.23mi | 3/1.0 | 1,050 (-13%) | 11mo | $70,000 | $67 | 56 |
| 6820 Despot Rd | 0.57mi | 3/1.0 | 1,222 (+1%) | 18mo | $49,900 | $41 | 55 |
| 2025 Amelia | 0.69mi | 3/2.0 | 1,286 (+6%) | 2mo | $129,000 | $100 | 54 |
| 7212 W Canal Blvd | 0.48mi | 3/1.0 | 1,274 (+5%) | 17mo | $85,000 | $67 | 53 |
| 7208 Brandtway St | 0.42mi | 3/1.0 | 1,341 (+11%) | 13mo | $39,999 | $30 | 50 |
| 2926 Millard St | 0.69mi | 3/2.0 | 1,370 (+13%) | 9mo | $59,900 | $44 | 37 |
| 8105 Lucille St | 0.70mi | 3/2.0 | 1,059 (-13%) | 12mo | $59,000 | $56 | 34 |
Match score weights: distance 35% · size 25% · config 20% · recency 20%. Top-matched comps best support the ARV.
Projected returns pro-forma
-3.0% appreciation · 2.37% rent growth · sell at horizon
- IRR
- -2.1%
- Equity multiple
- 0.92×
- Total profit
- $-2,207
- Equity at exit
- $14,612
- IRR
- 6.9%
- Equity multiple
- 1.50×
- Total profit
- $13,764
- Equity at exit
- $8,473
Cash invested: $27,440 (down + closing). Projections, not guarantees.
Landlord ↔ Tenant lean methodology
- Overall (STATE)
- 90 Strongly Landlord-Friendly
- State Louisiana
- 90 Strongly Landlord-Friendly · R+12
- County
- — inherits STATE
- City
- — inherits STATE
ZIP-level market 71108
- Rents YoY
- 2.4%
- Active inventory
- 138
- Price-to-rent
- 7.6×
Monthly cashflow live
- Estimated rent
- $1,080 high interval (Pro) →
- Mortgage (P&I)
- −$514
- Tax from tax record
- −$73 /mo · $871/yr
- Insurance
- −$41
- HOA
- −$0
- Vacancy / Maint / Mgmt
- −$227
- Net cashflow
- $226
Break-even live
UW: 25.0% down · 7.5% · 30yr · 1.5% tax · 5.0% vac · 8.0% maint · 8.0% mgmt
Financing live
Cash to close
- Down payment
- $24,500
- Closing costs
- $2,940
- Reserves months
- —
- Total cash needed
- —
Loan-product check · same deal, 3 products live
Conventional
25% down · 7.5% · 30yr
- Down + closing
- —
- Monthly P&I
- —
- Monthly cashflow
- —
- DSCR
- —
- Eligible?
- —
Personal DTI + credit; lowest rate.
DSCR
20% down · 8.5% · 30yr
- Down + closing
- —
- Monthly P&I
- —
- Monthly cashflow
- —
- DSCR
- —
- Eligible?
- —
No personal income docs; deal must DSCR.
Hard money
10% down · 12.0% · 12mo
- Down + closing
- —
- Monthly P&I
- —
- Monthly cashflow
- —
- DSCR
- —
- Eligible?
- —
Short-term bridge; refi at stabilization.
Rent comps 14 comps
| Address | Beds | Baths | Sqft | Rent | $/sqft | DOM | Units | Dist |
|---|---|---|---|---|---|---|---|---|
| 3437 Red Bud Ln Shreveport, LA | 3.0 | 1.5 | 1393 | $1,200 | $0.86 | 20d | 1 | 0.10mi |
| 3306 Valley View Dr Shreveport, LA | 3.0 | 1.0 | 1300 | $1,150 | $0.88 | 20d | 1 | 0.18mi |
| 7504 W Canal Blvd Shreveport, LA | 3.0 | 1.0 | 1388 | $1,150 | $0.83 | 43d | 1 | 0.48mi |
| 3051 Amherst St Shreveport, LA | 3.0 | 1.0 | 994 | $595 | $0.60 | 43d | 1 | 0.74mi |
| 2762 Marquette St Shreveport, LA | 3.0 | 1.0 | 1054 | $1,000 | $0.95 | 20d | 1 | 0.89mi |
| 2721 Sunnybrook St Shreveport, LA | 3.0 | 1.0 | 913 | $1,000 | $1.10 | 43d | 1 | 1.06mi |
| 2943 Hillcrest Ave Shreveport, LA | 4.0 | 2.0 | 960 | $1,000 | $1.04 | 20d | 1 | 1.09mi |
| 7137 Burlingame Blvd Shreveport, LA | 3.0 | 1.5 | 1100 | $700 | $0.64 | 43d | 1 | 1.29mi |
| 7224 Union Ave Shreveport, LA | 2.0 | 1.0 | 735 | $625 | $0.85 | 13d | 1 | 1.31mi |
| 7913 Woodfield Dr Shreveport, LA | 3.0 | 1.0 | 1067 | $1,000 | $0.94 | 43d | 1 | 1.35mi |
| 629 Woodmont Pl Shreveport, LA | 3.0 | 1.0 | 1431 | $1,295 | $0.90 | 44d | 1 | 1.37mi |
| 749 W 68th St Shreveport, LA | 3.0 | 1.0 | 1232 | $800 | $0.65 | 43d | 1 | 1.43mi |
| 702 Bringhurst Dr Shreveport, LA | 3.0 | 1.5 | 1206 | $1,100 | $0.91 | 43d | 1 | 1.43mi |
| 622 W 75th St Shreveport, LA | 2.0 | 1.0 | 833 | $800 | $0.96 | 20d | 1 | 1.50mi |
Listing history 22 events
-
2026-06-17days on market $98,000 Active 48 DOM
-
2026-06-16days on market $98,000 Active 47 DOM
-
2026-06-15days on market $98,000 Active 46 DOM
-
2026-06-14days on market $98,000 Active 44 DOM
-
2026-06-13days on market $98,000 Active 43 DOM
-
2026-06-10days on market $98,000 Active 41 DOM
-
2026-06-09days on market $98,000 Active 40 DOM
-
2026-06-08days on market $98,000 Active 39 DOM
-
2026-06-07days on market $98,000 Active 38 DOM
-
2026-06-05days on market $98,000 Active 35 DOM
-
2026-06-03days on market $98,000 Active 34 DOM
-
2026-06-02pricedays on market $98,000 Active 33 DOM
-
2026-06-01days on market $105,000 Active 32 DOM
-
2026-05-31days on market $105,000 Active 31 DOM
-
2026-05-30days on market $105,000 Active 30 DOM
-
2026-04-29$105,000 Active 1086-char remark
-
2024-08-10historical
-
2024-08-09price $155,000
-
2024-07-11$135,000 Active
-
2018-05-16soldstatus $65,000
-
2014-04-22soldstatus $73,250
-
1999-03-09soldstatus
ⓘ Source: listings_history table (triggers on properties + properties_extension) + one-shot
backfill from property_details.listing_events for pre-trigger history.
Tax reassessment forecast LA · Resets to sale price
- Current annual tax
- $871 · $73/mo
- Projected year-2 tax
- $871 · $73/mo
- Expected delta
- $0/yr ($0/mo · 0.0%)
ⓘ Screening estimate from a state-policy table — verify with the county assessor before closing.
Climate risk First Street
- Flood 1/10 Low FEMA zone X (unshaded) · 0% chance over 30 yrs
- Wildfire 1/10 Low
- Heat 7/10 Severe 7 d/yr ≥110°F today · 22 d/yr by 30 yrs out
- Wind 6/10 Major 68% chance of damaging wind over 30 yrs
- Air quality 2/10 Low 1 unhealthy d/yr today · 1 by 30 yrs out
Nearby sold comps map
Loading sold comps map…
Walkable amenities ~0.75 mi
Loading nearby amenities…
Taxation est. · year 1
- Rental income
- $12,956
- − Mortgage interest
- −$5,490
- − Property taxes
- −$871
- − Insurance
- −$490
- − Repairs & maintenance
- −$1,036
- − Management
- −$1,036
- − Depreciation
- −$2,851
- Taxable income
- $1,181
- Est. tax owed @ 24.0%
- −$284
- After-tax cash flow
- $2,423/yr
For passive investors: Depreciation is non-cash, so a rental often shows a tax loss while cash-flowing — sheltering income. Rental losses are passive: they offset passive income freely, and up to $25,000/yr can offset ordinary (W-2) income if you actively participate and your MAGI is under $100k (phasing out to $0 by $150k); unused losses carry forward. On sale, claimed depreciation is recaptured at up to 25%, and gains may owe capital-gains tax (a 1031 exchange can defer both). Figures are a year-1 estimate at your 24.0% rate — not tax advice; consult a CPA.
Schools (NCES district)
- District
- Caddo Parish
- NCES district ID
- 2200300
- Math proficiency
- 21% ▼ -33.00%
- Reading proficiency
- 32% ▼ -30.00%
- Median HH income
- $39,227
- Composite
- 22.23/100
- National rank
- #8148
- State rank
- #53 of 98 in LA
Livability — Shreveport
- Score
- 59/100
- State rank
- #270
- US rank
- #19730
Category grades
Schools grade is shown separately in the Schools card above.
Census & demographics
- Census place
- Shreveport, LA
- County
- Caddo Parish · 178,536 people
- City population
- 164,123
- Metro
- Shreveport-Bossier City, LA
- Population (ZIP)
- 18,072
- Household income
- $32,055
- Rent vs Own
- Severe rent burden
- 1526.0
Population outlook (Caddo County) Hauer SSP2
- Today (2025)
- 243,190 people
- By 2030
- 237,231 · -2.5%
- By 2040
- 222,502 · -8.5%
- By 2050
- 206,516 · -15.1%
- By 2075
- 165,706 · -31.9%
- By 2100
- 122,262 · -49.7%
Race, ethnicity, and origin ACS 2023
- Neighborhood character
- Predominantly Black (83%)
- Race & ethnicity
- Black 83% White 11% Hispanic / Latino 4% Two or more races 2%
- Foreign-born
- 2% · Canada
- Languages at home
- 96% English-only · Spanish 3%
Political lean MEDSL · Caddo
- 2024 margin
- Toss-up / Even · D 51.6% · R 47.0% · Other 1.4%
- 2008→2024 swing
- +1.6pp toward D · 2008: 3.0pp · 2024: 4.6pp
- All cycles
- 2024: D+4.6 2020: D+6.8 2016: D+4.2 2012: D+4.9 2008: D+3.0
Not yet ingested
- Civics
- —
Market trends
- HPI YoY
- ▼ -58.98%
- Current HPI
- 58.1377
- Rent YoY
- ▲ 2.37%
- Metro
- Shreveport-Bossier City, LA
- State GDP YoY
- ▲ 3.29%
- F500 in state
- 10
Industry mix (Fortune 500 HQ in LA)
| Industry | F500 HQs | Revenue |
|---|---|---|
| Telecommunications | 2 | $23B |
|
||
| Utilities | 1 | $12B |
|
||
| Wholesale / Distribution | 1 | $5B |
|
||
| Advertising | 1 | $2B |
|
||
Price history
+33.8% since first listed8 events — show timeline
- 2026-06-01 Price Changed $98,000 NTREIS
- 2026-04-29 Listed $105,000 NTREIS
- 2024-08-10 Listing Removed — NTREIS
- 2024-08-09 Price Changed $155,000 NTREIS
- 2024-07-11 Listed $135,000 NTREIS
- 2018-05-16 Sold (Public Records) $65,000 Public Records
- 2014-04-22 Sold (Public Records) $73,250 Public Records
- 1999-03-09 Sold (Public Records) — Public Records
Property tax history
-0.7%/yrLatest (2025): $871 · +0.4% YoY. Source: county tax records.
Cash-flow waterfall
monthlySold comps — $/sqft
last 12 mo · ≤1 miLoading sold comps…