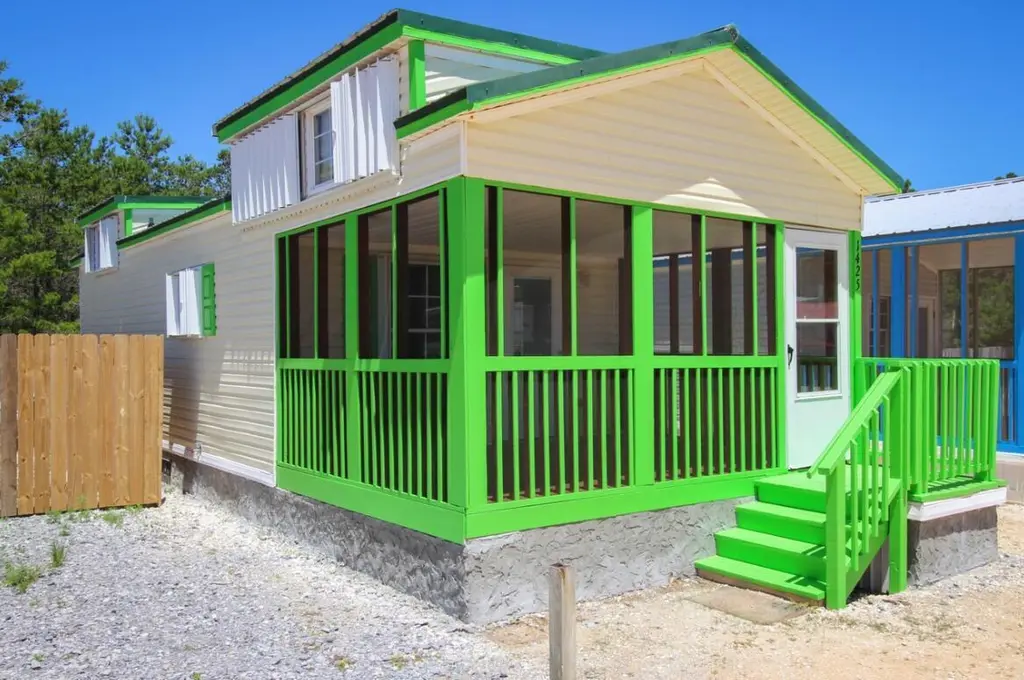
1425 Suncrest St · Midway, FL
Flood risk 1/10 · Minimal
- FEMA flood zone
- X (unshaded)
- Chance of flooding over 30 yrs
- 0.0%
- Est. flood insurance / yr
- $507 – $1,088
Fire risk 5/10 · Moderate
- Est. fire insurance / yr
- $947 – $1,759
Heat risk 10/10 · Severe
- Hot days now (above 105°F)
- 7 days/yr
- Hot days in 30 yrs
- 23 days/yr
Wind risk 9/10 · Severe
- Chance of severe wind over 30 yrs
- 99.0%
Air-quality risk 2/10 · Minimal
- Unhealthy air days now
- 1 days/yr
- Unhealthy air days in 30 yrs
- 1 days/yr
Risk factors via First Street. Map © Google.
Why this score? — see what drove the B grade
The composite is a weighted blend of 9 inputs, each scored 0–100. Each bar is that input's sub-score; the figure is the points it added to the 100-point composite (weight × sub-score).
- Cash flow +30.0/30.0
- DSCR +10.0/10.0
- 1% rule +9.4/10.0
- ARV discount +7.5/15.0
- Schools +5.3/10.0
- Rent growth +3.7/5.0
- Livability +2.5/5.0
- Condition / age +2.5/5.0
- Appreciation +0.0/10.0
$95,000
🖨 Deal sheet 📄 Offer letter ✓ Due diligence
Listing remarks
Don't miss out on this cozy Beach Cottage! Private waterfront community features it's own beach and includes picnic areas and a dock! As you enter the home through the cheerfully painted screened-in porch, you notice the brand new stainless steel appliance suite (smooth top range, double door refrigerator, dishwasher, and microwave), the soaring ceilings, New Luxury Vinyl Plank flooring and double loft areas! The coastal vibe continues with the unique ground floor Master Bedroom, complete with a custom mural. Fenced backyard with yard building for additional storage. Metal roof, and hurricane shutters included. This beachy home is great for someone just starting out, or someone wanting to s
Key facts
- 1,742 sq ft lot
- Built 2006
- Listed 48 days
Property features AI
Finance
- Other: Lot is approximately 0.04 acres (25 x 60), level, interior lot and within 1/2 mile to water; On waterfront (Intracoastal Waterway / Sound)
- Financial info: Buyer financing options: Conventional, FHA, VA, Other
Exterior
- Utilities: Electric service; Public water; Phone service; TV cable available; Underground utilities
- Home design: Residential mobile home; Construction complete; Mobile Home / Single-family zoning
- Construction: Built in 2006; Frame construction with vinyl trim; Pitched roof
- Exterior features: Dock; Fenced backyard; Hurricane shutters; Yard building
Interior
- Kitchen: Dishwasher; Microwave; Refrigerator; Smooth electric cooktop; Electric stove/oven
- Bedrooms: 1 bedroom
- Bathrooms: 1 full bathroom
- Heating & cooling: Heating present; Cooling present
- Interior features: One-story layout; Dishwasher; Microwave; Refrigerator; Smooth electric cooktop; Electric stove/oven
Neighborhood map
What this means for you Summary
Snapshot
- This is a 1-bed/1.0-bath manufactured listed at $95k.
Deal economics
- At list price, monthly cash flow is $454 ($5k/yr) — positive.
- The deal already cash-flows at list — no discount required.
- Meets the 1% rule at list price ($1k rent vs $95k).
- Recommended offer: $92k (3.0% below list) — sets the bar for market timing.
- Cap rate 12.0% vs local median 4.1% in Midway — top-decile yield for the area; either an underpriced asset or a hidden risk that comps aren't pricing in. Stress-test before assuming the spread holds.
Location & tenants
- Location reads: area grade B — affects rentability + tenant quality, not the cash-flow math above.
- Santa Rosa (suburban): math 63% / reading 60% proficiency, ranked #8 of 73 in FL (top 11%) — acceptable for families but not a draw, mixed tenant base, ~2y average lease.
- Zoned schools: West Navarre Primary School (723 students, 39% FRL); Woodlawn Beach Middle School (math 68% / reading 60%, grade B+, #105 of 571 statewide, top 19%, 948 students, 34% FRL); Gulf Breeze High School (math 67% / reading 69%, grade B, #66 of 667 statewide, top 10%, 1,978 students, 21% FRL) — zoned schools at 31% FRL track the district average.
- Market conditions: Rents rising fast (+4.6%/yr); 453 active listings in the ZIP; solid renter incomes; 1,983 units permitted in Santa Rosa County in 2024 (128 in 5+ unit buildings).
- This rent is only 16% of the median local income ($100k/yr) — well below the 30% rent-burden line; pricing power to push rent on renewal without tenant pushback.
Forward outlook
- Local home prices are declining (-3.0%/yr); year-one equity from $657 of loan paydown is wiped out by about $3k of value loss. Plan a longer hold.
- Santa Rosa County population projected at +31% by 2050 — long-run rental-demand tailwind backs the buy-and-hold thesis.
- At projected returns (-3.0% appreciation + 4.6% rent growth), your $27k cash investment doubles in ~6 years — after that, you're playing with house money.
Negotiation context
- It's been on market 48 days — a 3% lower offer ($92k) is reasonable based on typical stale-listing flexibility.
- 12 sale attempts since 19y ago with the ask held roughly flat each time — persistent listings suggest the price (not the market) is what's stuck; bring a comps-based counter.
Risks & watch-outs
- Climate carrying-cost: severe wind risk, 99% chance of damaging wind over 30y; moderate wildfire risk; extreme-heat days projected 7→23/yr by 2055 (HVAC capex compounding) — expect insurance premiums to compound above CPI over the hold.
Questions for the listing agent
- It's been on market 48 days. Have you received any prior offers? Is the seller open to a 3% concession, seller financing, or rate buy-down credit?
- Is there a deadline driving the sale (1031 exchange, divorce, estate, relocation)? That informs how much negotiation room exists.
- What's the average days-on-market for RENTAL listings here right now (not sales)? A rising rental-DOM trend means longer vacancies and softer asking-rent achievability than the comps imply.
- What's the recent tenant-quality profile in this submarket — average credit score on applications, eviction rate, late-payment / NSF rate, and stable-employment percentage? A property-management company in the area should have these aggregated.
- How much new for-sale + rental construction is in the pipeline within 1–3 miles? Heavy new supply typically softens prices + rents 12–24 months out; constrained supply supports both.
Investment metrics
- 1% rule
- 1.44% ✓
- Cap rate
- 12.03%
- Cash-on-cash
- 20.48%
- DSCR
- 1.91
- GRM
- 5.8
CMA / ARV
No comps found within radius.
Projected returns pro-forma
-3.0% appreciation · 4.6% rent growth · sell at horizon
- IRR
- 14.5%
- Equity multiple
- 1.59×
- Total profit
- $15,767
- Equity at exit
- $14,165
- IRR
- 24.4%
- Equity multiple
- 3.27×
- Total profit
- $60,468
- Equity at exit
- $8,214
Cash invested: $26,600 (down + closing). Projections, not guarantees.
Landlord ↔ Tenant lean methodology
- Overall (STATE)
- 87 Strongly Landlord-Friendly
- State Florida
- 87 Strongly Landlord-Friendly · R+3
- County
- — inherits STATE
- City
- — inherits STATE
ZIP-level market 32563
- Rents YoY
- 4.6%
- Active inventory
- 453
- Price-to-rent
- 5.8×
Monthly cashflow live
- Estimated rent
- $1,368 medium interval (Pro) →
- Mortgage (P&I)
- −$498
- Tax from tax record
- −$89 /mo · $1,070/yr
- Insurance
- −$40
- HOA
- −$0
- Vacancy / Maint / Mgmt
- −$287
- Net cashflow
- $454
Break-even live
UW: 25.0% down · 7.5% · 30yr · 1.5% tax · 5.0% vac · 8.0% maint · 8.0% mgmt
Financing live
Cash to close
- Down payment
- $23,750
- Closing costs
- $2,850
- Reserves months
- —
- Total cash needed
- —
Loan-product check · same deal, 3 products live
Conventional
25% down · 7.5% · 30yr
- Down + closing
- —
- Monthly P&I
- —
- Monthly cashflow
- —
- DSCR
- —
- Eligible?
- —
Personal DTI + credit; lowest rate.
DSCR
20% down · 8.5% · 30yr
- Down + closing
- —
- Monthly P&I
- —
- Monthly cashflow
- —
- DSCR
- —
- Eligible?
- —
No personal income docs; deal must DSCR.
Hard money
10% down · 12.0% · 12mo
- Down + closing
- —
- Monthly P&I
- —
- Monthly cashflow
- —
- DSCR
- —
- Eligible?
- —
Short-term bridge; refi at stabilization.
Listing history 49 events
-
2026-06-15status $95,000 Pending 48 DOM
-
2026-06-15days on market $95,000 Active 48 DOM
-
2026-06-14days on market $95,000 Active 46 DOM
-
2026-06-10days on market $95,000 Active 43 DOM
-
2026-06-09days on market $95,000 Active 42 DOM
-
2026-06-08days on market $95,000 Active 41 DOM
-
2026-06-07days on market $95,000 Active 40 DOM
-
2026-06-05days on market $95,000 Active 37 DOM
-
2026-06-03days on market $95,000 Active 36 DOM
-
2026-06-02days on market $95,000 Active 35 DOM
-
2026-06-01days on market $95,000 Active 34 DOM
-
2026-05-31days on market $95,000 Active 33 DOM
-
2026-05-31days on market $95,000 Active 32 DOM
-
2026-05-01status Active
-
2026-04-20status Pending
-
2026-04-17$95,000 Active
-
2022-12-07historical
-
2022-12-07historical
-
2022-10-17price $165,000
-
2022-10-17price $165,000
-
2022-10-17price $165,000
-
2022-09-28price $175,000
-
2022-09-28price $175,000
-
2022-09-28price $175,000
-
2022-09-19status Active
-
2022-09-15status Active
-
2022-09-15status Active
-
2022-08-24status Pending
-
2022-08-24status Pending
-
2022-08-24status Pending
-
2022-08-24historical
-
2022-08-15price $177,000
-
2022-08-15price $177,000
-
2022-08-15price $177,000
-
2022-08-04$179,900 Active
-
2022-08-04$179,900 Active
-
2022-08-03$179,900 Active
-
2020-07-27soldstatus $130,000
-
2020-07-23soldstatus $130,000
-
2020-06-15$135,000
-
2008-09-16historical
-
2008-06-30soldstatus $107,800
-
2008-03-22$119,900
-
2008-03-03historical
-
2008-03-03historical
-
2007-09-27$117,000
-
2007-08-28$117,000
-
2007-03-23soldstatus $109,600
-
2005-10-07soldstatus $151,000
ⓘ Source: listings_history table (triggers on properties + properties_extension) + one-shot
backfill from property_details.listing_events for pre-trigger history.
Tax reassessment forecast FL · Resets to sale price
- Current annual tax
- $1,070 · $89/mo
- Projected year-2 tax
- $1,070 · $89/mo
- Expected delta
- $0/yr ($0/mo · 0.0%)
ⓘ Screening estimate from a state-policy table — verify with the county assessor before closing.
Climate risk First Street
- Flood 1/10 Low FEMA zone X (unshaded) · 0% chance over 30 yrs
- Wildfire 5/10 Major
- Heat 10/10 Extreme 7 d/yr ≥105°F today · 23 d/yr by 30 yrs out
- Wind 9/10 Extreme 99% chance of damaging wind over 30 yrs
- Air quality 2/10 Low 1 unhealthy d/yr today · 1 by 30 yrs out
Nearby sold comps map
Loading sold comps map…
Walkable amenities ~0.75 mi
Loading nearby amenities…
Taxation est. · year 1
- Rental income
- $16,420
- − Mortgage interest
- −$5,321
- − Property taxes
- −$1,070
- − Insurance
- −$475
- − Repairs & maintenance
- −$1,314
- − Management
- −$1,314
- − Depreciation
- −$2,764
- Taxable income
- $4,163
- Est. tax owed @ 24.0%
- −$999
- After-tax cash flow
- $4,450/yr
For passive investors: Depreciation is non-cash, so a rental often shows a tax loss while cash-flowing — sheltering income. Rental losses are passive: they offset passive income freely, and up to $25,000/yr can offset ordinary (W-2) income if you actively participate and your MAGI is under $100k (phasing out to $0 by $150k); unused losses carry forward. On sale, claimed depreciation is recaptured at up to 25%, and gains may owe capital-gains tax (a 1031 exchange can defer both). Figures are a year-1 estimate at your 24.0% rate — not tax advice; consult a CPA.
Schools (NCES district)
- District
- Santa Rosa
- NCES district ID
- 1201650
- Math proficiency
- 63% ▼ -6.00%
- Reading proficiency
- 60% ▼ -5.00%
- Median HH income
- $58,161
- Composite
- 53.12/100
- National rank
- #1511
- State rank
- #8 of 73 in FL
Livability — Midway
No livability data for this city. (Only ~50 U.S. cities are tracked.)
Census & demographics
- Census place
- Midway, FL
- County
- Santa Rosa County · 194,764 people
- Metro
- Pensacola-Ferry Pass-Brent, FL
- Population (ZIP)
- 30,364
- Household income
- $100,396
- Rent vs Own
- Severe rent burden
- 397.0
Population outlook (Santa Rosa County) Hauer SSP2
- Today (2025)
- 195,978 people
- By 2030
- 209,782 · +7.0%
- By 2040
- 235,293 · +20.1%
- By 2050
- 256,408 · +30.8%
- By 2075
- 298,074 · +52.1%
- By 2100
- 303,216 · +54.7%
Race, ethnicity, and origin ACS 2023
- Neighborhood character
- Predominantly White (87%)
- Race & ethnicity
- White 87% Two or more races 6% Hispanic / Latino 6% Black 2% Asian 1%
- Hispanic origin (detail)
- Mexican 2%
- Common ancestry
- Italian 5% Slovak 3% Romanian 3%
- Foreign-born
- 4% · Canada
- Languages at home
- 94% English-only · Spanish 3% German/W. Germanic 1% Chinese 1%
Political lean MEDSL · Santa Rosa
- 2024 margin
- Solid R (+51.0) · D 24.1% · R 75.0%
- 2008→2024 swing
- -3.0pp toward R · 2008: -47.9pp · 2024: -51.0pp
- All cycles
- 2024: R+51.0 2020: R+46.5 2016: R+53.5 2012: R+52.6 2008: R+47.9
Not yet ingested
- Civics
- —
Market trends
- HPI YoY
- ▼ -229.78%
- Current HPI
- 278.9852
- Rent YoY
- ▲ 4.60%
- Metro
- Pensacola-Ferry Pass-Brent, FL
- State GDP YoY
- ▲ 3.28%
- F500 in state
- 36
Industry mix (Fortune 500 HQ in FL)
| Industry | F500 HQs | Revenue |
|---|---|---|
| Industrial Technology | 2 | $29B |
|
||
| Insurance | 2 | $17B |
|
||
| Retail | 1 | $60B |
|
||
| Technology Distribution | 1 | $58B |
|
||
| Homebuilding | 1 | $35B |
|
||
| Technology Manufacturing | 1 | $35B |
|
||
Price history
-37.1% since first listed36 events — show timeline
- 2026-05-01 Relisted — NAMLS
- 2026-04-20 Pending — NAMLS
- 2026-04-17 Listed $95,000 NAMLS
- 2022-12-07 Delisted — ECAR
- 2022-12-07 Listing Removed — PARMLS
- 2022-10-17 Price Changed $165,000 ECAR
- 2022-10-17 Price Changed $165,000 PARMLS
- 2022-10-17 Price Changed $165,000 NAMLS
- 2022-09-28 Price Changed $175,000 ECAR
- 2022-09-28 Price Changed $175,000 PARMLS
- 2022-09-28 Price Changed $175,000 NAMLS
- 2022-09-19 Relisted — PARMLS
- 2022-09-15 Relisted — ECAR
- 2022-09-15 Relisted — NAMLS
- 2022-08-24 Pending — PARMLS
- 2022-08-24 Pending — ECAR
- 2022-08-24 Pending — NAMLS
- 2022-08-24 Listing Removed — NAMLS
- 2022-08-15 Price Changed $177,000 ECAR
- 2022-08-15 Price Changed $177,000 PARMLS
- 2022-08-15 Price Changed $177,000 NAMLS
- 2022-08-04 Listed $179,900 ECAR
- 2022-08-04 Listed $179,900 PARMLS
- 2022-08-03 Listed $179,900 NAMLS
- 2020-07-27 Sold (Public Records) $130,000 Public Records
- 2020-07-23 Sold (MLS) $130,000 NAMLS
- 2020-06-15 Listed $135,000 NAMLS
- 2008-09-16 Listing Removed — NAMLS
- 2008-06-30 Sold (Public Records) $107,800 Public Records
- 2008-03-22 Listed $119,900 NAMLS
- 2008-03-03 Listing Removed — NAMLS
- 2008-03-03 Listing Removed — PARMLS
- 2007-09-27 Listed $117,000 PARMLS
- 2007-08-28 Listed $117,000 NAMLS
- 2007-03-23 Sold (Public Records) $109,600 Public Records
- 2005-10-07 Sold (Public Records) $151,000 Public Records
Property tax history
+10.8%/yrLatest (2025): $1,070 · +4.0% YoY. Source: county tax records.
Cash-flow waterfall
monthlySold comps — $/sqft
last 12 mo · ≤1 miLoading sold comps…