 🏷️ Likely Rental
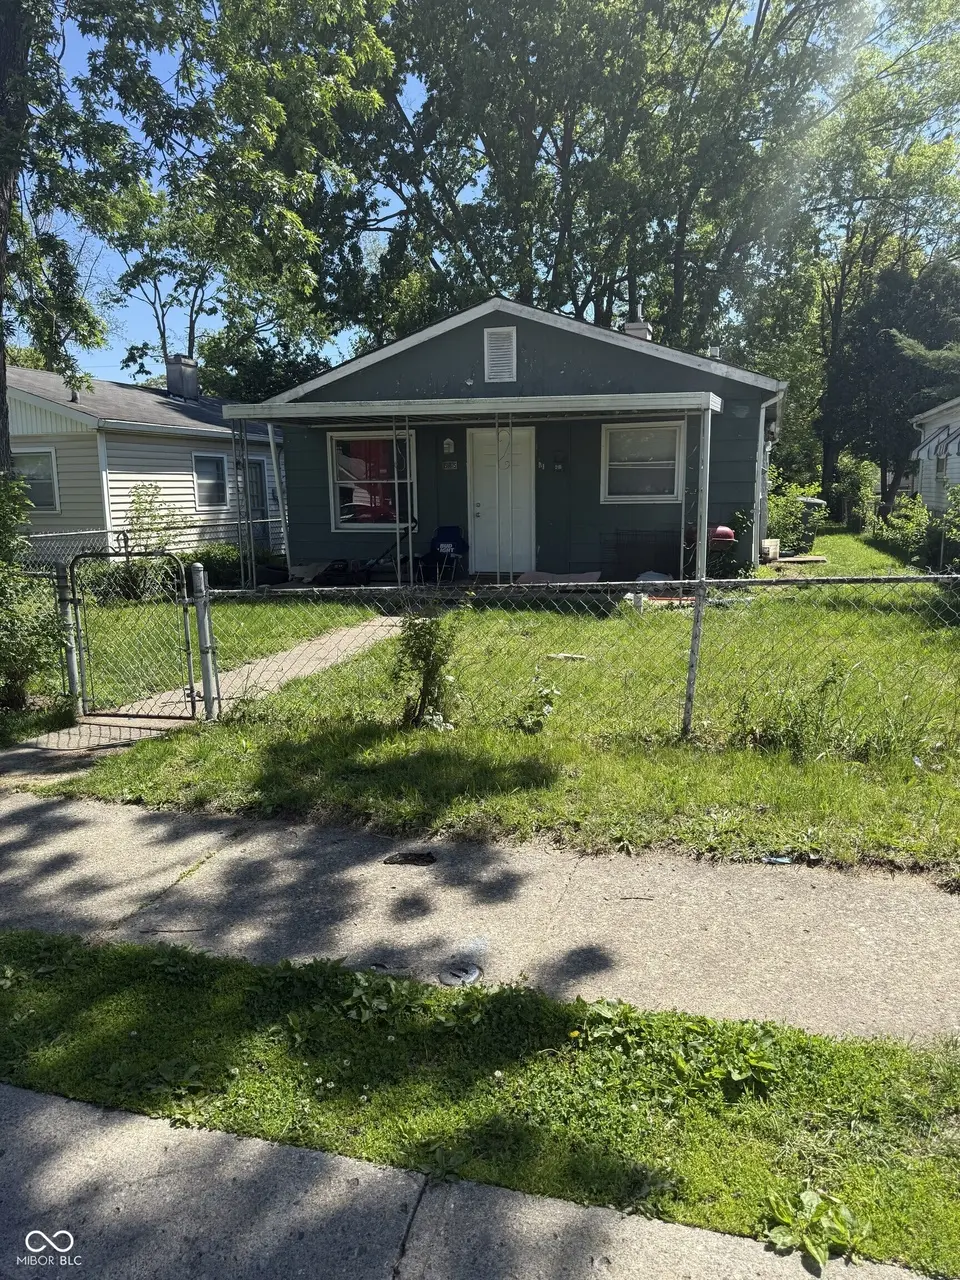
2165 White Ave · Indianapolis city (balance), IN
Flood risk 1/10 · Minimal
- FEMA flood zone
- X (unshaded)
- Chance of flooding over 30 yrs
- 0.0%
- Est. flood insurance / yr
- $507 – $1,088
Fire risk 1/10 · Minimal
- Est. fire insurance / yr
- $717 – $1,331
Heat risk 4/10 · Minor
- Hot days now (above 102°F)
- 7 days/yr
- Hot days in 30 yrs
- 19 days/yr
Wind risk 2/10 · Minimal
- Chance of severe wind over 30 yrs
- 0.0%
Air-quality risk 4/10 · Minor
- Unhealthy air days now
- 5 days/yr
- Unhealthy air days in 30 yrs
- 7 days/yr
Risk factors via First Street. Map © Google.
Why this score? — see what drove the B- grade
The composite is a weighted blend of 9 inputs, each scored 0–100. Each bar is that input's sub-score; the figure is the points it added to the 100-point composite (weight × sub-score).
- Cash flow +27.9/30.0
- ARV discount +15.0/15.0
- DSCR +9.9/10.0
- 1% rule +7.5/10.0
- Livability +2.5/5.0
- Condition / age +2.5/5.0
- Rent growth +2.4/5.0
- Schools +1.4/10.0
- Appreciation +0.0/10.0
$110,000
🖨 Deal sheet 📄 Offer letter ✓ Due diligence
Listing remarks
This 3-bedroom, 1 full bathroom home is a great addition to any investor's portfolio. The property is currently tenant-occupied, providing immediate rental income from day one. Tenants' rights apply, making this an ideal opportunity for buyers looking for a seamless, income-producing asset. This property is being offered as part of a portfolio sale alongside 857 W 25th Street, creating a unique opportunity to expand your holdings with multiple income streams. Whether you're a seasoned investor or looking to grow your rental portfolio, this package offers strong potential and long-term value.
Key facts
- 4,704 sq ft lot
- Built 1960
- Listed 45 days
Property features AI
Exterior
- Utilities: Public water; Municipal sewer connected
- Home design: Single-family residence; One story
- Construction: Wood siding; Slab foundation
- Exterior features: Lot under 1/4 acre
Interior
- Kitchen: Gas oven; Refrigerator
- Bedrooms: 3 bedrooms (all on the main level)
- Bathrooms: 1 full bathroom
- Heating & cooling: Forced air heating (natural gas); Central air conditioning
- Interior features: Dining room; Living room
- Laundry & utility: Washer; Dryer
Neighborhood map
What this means for you Summary
Snapshot
- This is a 3-bed/1.0-bath single-family listed at $110k.
Deal economics
- At list price, monthly cash flow is $338 ($4k/yr) — positive.
- The deal already cash-flows at list — no discount required.
- Meets the 1% rule at list price ($1k rent vs $110k).
- Recommended offer: $107k (3.0% below list) — sets the bar for market timing.
- Cap rate 10.0% vs local median 4.4% in Indianapolis city (balance) — top-decile yield for the area; either an underpriced asset or a hidden risk that comps aren't pricing in. Stress-test before assuming the spread holds.
Location & tenants
- Location reads: area grade B — affects rentability + tenant quality, not the cash-flow math above.
- Indianapolis Public Schools (urban): math 14% / reading 20% proficiency, ranked #286 of 301 in IN (top 95%) — low school quality limits family demand, transient renter base, plan for 1-2y turnover; 77% free/reduced lunch — lower-income household profile, screen leases tightly.
- Market conditions: Rents soft (-0.4%/yr); 262 active listings in the ZIP; 40 comparable units currently listed for rent nearby; rentals at typical pace (median 24d on market — plan ~3-4 weeks tenant-placement turnaround); 1,906 units permitted in Marion County in 2024 (621 in 5+ unit buildings).
Forward outlook
- Local home prices are declining (-3.0%/yr); year-one equity from $761 of loan paydown is wiped out by about $3k of value loss. Plan a longer hold.
- Marion County population projected at +18% by 2050 — long-run rental-demand tailwind backs the buy-and-hold thesis.
Negotiation context
- It's been on market 45 days — a 3% lower offer ($107k) is reasonable based on typical stale-listing flexibility.
- 2 sale attempts since 3y ago; this cycle's ask has dropped $10k (8%) from the opening price — seller is motivated, your offer sets the floor, not the list.
Questions for the listing agent
- It's been on market 45 days. Have you received any prior offers? Is the seller open to a 3% concession, seller financing, or rate buy-down credit?
- Built in 1960 — when were the roof, HVAC, electrical panel, plumbing, and water heater last replaced?
- Is there a deadline driving the sale (1031 exchange, divorce, estate, relocation)? That informs how much negotiation room exists.
- What's the average days-on-market for RENTAL listings here right now (not sales)? A rising rental-DOM trend means longer vacancies and softer asking-rent achievability than the comps imply.
- What's the recent tenant-quality profile in this submarket — average credit score on applications, eviction rate, late-payment / NSF rate, and stable-employment percentage? A property-management company in the area should have these aggregated.
- How much new for-sale + rental construction is in the pipeline within 1–3 miles? Heavy new supply typically softens prices + rents 12–24 months out; constrained supply supports both.
Investment metrics
- 1% rule
- 1.25% ✓
- Cap rate
- 9.99%
- Cash-on-cash
- 13.19%
- DSCR
- 1.59
- GRM
- 6.7
CMA / ARV
- ARV (median comp)
- $156,843
- List price
- $110,000
- Delta
- -29.87%
- Verdict
- UNDERPRICED
- Comps
- 20 within 1.0 mi
Show comp detail 12 sales within ~0.75 mi
| Address | Dist | Beds/Ba | Sqft | Sold | Price | $/sf | Match |
|---|---|---|---|---|---|---|---|
| 2126 White Ave | 0.07mi | 3/1.0 | 920 (0%) | 18mo | $133,000 | $145 | 82 |
| 1006 Edgemont Ave | 0.45mi | 3/1.0 | 954 (+4%) | 3mo | $75,000 | $79 | 71 |
| 2023 Gent Ave | 0.16mi | 2/1.5 (-1) | 875 (-5%) | 23mo | $179,750 | $205 | 58 |
| 2171 Sugar Grove Ave | 0.07mi | 3/2.0 | 1,050 (+14%) | 16mo | $225,000 | $214 | 56 |
| 2142 Gent Ave | 0.06mi | 3/2.0 | 1,057 (+15%) | 15mo | $200,000 | $189 | 56 |
| 1802 Sugar Grove Ave | 0.41mi | 3/1.0 | 1,008 (+10%) | 11mo | $135,000 | $134 | 56 |
| 2041 N Dexter St | 0.17mi | 3/2.0 | 1,050 (+14%) | 10mo | $227,500 | $217 | 56 |
| 2193 N Dexter St | 0.13mi | 3/2.0 | 1,050 (+14%) | 14mo | $225,000 | $214 | 55 |
| 2189 N Dexter St | 0.13mi | 3/2.0 | 1,050 (+14%) | 16mo | $225,000 | $214 | 53 |
| 2145 Sugar Grove Ave | 0.07mi | 3/2.0 | 1,050 (+14%) | 21mo | $222,500 | $212 | 52 |
| 1309 W 26th St | 0.45mi | 3/2.0 | 1,050 (+14%) | 1mo | $210,000 | $200 | 51 |
| 1156 Udell St | 0.72mi | 2/1.0 (-1) | 808 (-12%) | 15mo | $137,000 | $170 | 29 |
Match score weights: distance 35% · size 25% · config 20% · recency 20%. Top-matched comps best support the ARV.
Projected returns pro-forma
-3.0% appreciation · 0.0% rent growth · sell at horizon
- IRR
- -0.3%
- Equity multiple
- 0.99×
- Total profit
- $-284
- Equity at exit
- $16,401
- IRR
- 6.0%
- Equity multiple
- 1.39×
- Total profit
- $11,992
- Equity at exit
- $9,511
Cash invested: $30,800 (down + closing). Projections, not guarantees.
Landlord ↔ Tenant lean methodology
- Overall (STATE)
- 90 Strongly Landlord-Friendly
- State Indiana
- 90 Strongly Landlord-Friendly · R+11
- County
- — inherits STATE
- City
- — inherits STATE
ZIP-level market 46202
- Home prices YoY
- -26.2%
- Rents YoY
- -0.4%
- Active inventory
- 262
- Price-to-rent
- 6.7×
Monthly cashflow live
- Estimated rent
- $1,375 high interval (Pro) →
- Mortgage (P&I)
- −$577
- Tax from tax record
- −$125 /mo · $1,501/yr
- Insurance
- −$46
- HOA
- −$0
- Vacancy / Maint / Mgmt
- −$289
- Net cashflow
- $338
Break-even live
UW: 25.0% down · 7.5% · 30yr · 1.5% tax · 5.0% vac · 8.0% maint · 8.0% mgmt
Financing live
Cash to close
- Down payment
- $27,500
- Closing costs
- $3,300
- Reserves months
- —
- Total cash needed
- —
Loan-product check · same deal, 3 products live
Conventional
25% down · 7.5% · 30yr
- Down + closing
- —
- Monthly P&I
- —
- Monthly cashflow
- —
- DSCR
- —
- Eligible?
- —
Personal DTI + credit; lowest rate.
DSCR
20% down · 8.5% · 30yr
- Down + closing
- —
- Monthly P&I
- —
- Monthly cashflow
- —
- DSCR
- —
- Eligible?
- —
No personal income docs; deal must DSCR.
Hard money
10% down · 12.0% · 12mo
- Down + closing
- —
- Monthly P&I
- —
- Monthly cashflow
- —
- DSCR
- —
- Eligible?
- —
Short-term bridge; refi at stabilization.
Rent comps 40 comps
| Address | Beds | Baths | Sqft | Rent | $/sqft | DOM | Units | Dist |
|---|---|---|---|---|---|---|---|---|
| 1367 W Pruitt St Indianapolis, IN | 3.0 | 1.0 | 1088 | $1,450 | $1.33 | 43d | 1 | 0.19mi |
| 2248 N Harding St Indianapolis, IN | 2.0 | 1.0 | 1100 | $899 | $0.82 | 23d | 1 | 0.24mi |
| 1415 W Pruitt St Indianapolis, IN | 3.0 | 1.0 | 1001 | $1,249 | $1.25 | 23d | 1 | 0.24mi |
| 1244 Edgemont Ave Indianapolis, IN | 2.0 | 1.0 | 1092 | $1,275 | $1.17 | 43d | 1 | 0.35mi |
| 1228 W 18th St Indianapolis, IN | 2.0 | 1.0 | 1050 | $1,200 | $1.14 | 43d | 1 | 0.39mi |
| 970 Edgemont Ave Indianapolis, IN | 2.0 | 1.0 | 740 | $845 | $1.14 | 4d | 1 | 0.49mi |
| 906 Burdsal Pkwy Indianapolis, IN | 2.0 | 1.0 | 936 | $1,295 | $1.38 | 23d | 1 | 0.52mi |
| 908 Burdsal Pkwy Marion, IN | 2.0 | 1.0 | 936 | $1,300 | $1.39 | 23d | 1 | 0.52mi |
| 1319 W 27th St Indianapolis, IN | 2.0 | 1.0 | 651 | $900 | $1.38 | 12d | 1 | 0.58mi |
| 1519 W 28th St Indianapolis, IN | 2.0 | 1.0 | 816 | $895 | $1.10 | 43d | 1 | 0.71mi |
| 1410 Breedlove Ln Indianapolis, IN | 2.0 | 1.0–2.0 | 886 | $2,557 | $2.88 | 1d | 63 | 0.74mi |
| 1227 W 29th St Indianapolis, IN | 3.0 | 1.5 | 1056 | $1,250 | $1.18 | 23d | 1 | 0.76mi |
| 2235 Doctor Martin Luther King Junior St Indianapolis, IN | 3.0 | 1.5 | 948 | $1,700 | $1.79 | 43d | 1 | 0.80mi |
| 1457 W 29th St Indianapolis, IN | 2.0 | 1.0 | 686 | $995 | $1.45 | 20d | 1 | 0.81mi |
| 524 W 23rd St Indianapolis, IN | 2.0 | 1.0 | 664 | $949 | $1.43 | 43d | 1 | 0.83mi |
| 1201 Indiana Ave Indianapolis, IN | 1.0–3.0 | 1.0–3.5 | 967 | $2,404 | $2.49 | 1d | 36 | 0.85mi |
| 1441 W Lynn Dr Indianapolis, IN | 3.0 | 2.0 | 967 | $1,550 | $1.60 | 43d | 1 | 1.02mi |
| 1150 N White River Pkwy West Dr Indianapolis, IN | 1.0–2.0 | 1.0 | 722 | $1,224 | $1.69 | 2d | 9 | 1.05mi |
| 2106 Cold Spring Rd Indianapolis, IN | 2.0 | 1.0–1.5 | 940 | $1,189 | $1.26 | 3d | 4 | 1.05mi |
| 516 W 28th St Indianapolis, IN | 2.0 | 1.0 | 1005 | $1,100 | $1.09 | 23d | 1 | 1.06mi |
| 1261 W 32nd St Indianapolis, IN | 2.0 | 1.0 | 832 | $975 | $1.17 | 43d | 1 | 1.10mi |
| 1401 Doctor Martin Luther King Junior St Indianapolis, IN | 1.0–2.0 | 1.0 | 982 | $1,875 | $1.91 | 14d | 1 | 1.14mi |
| 2602 Mansion Dr Indianapolis, IN | 2.0–3.0 | 2.0 | 1850 | $1,675 | $0.91 | 7d | 6 | 1.14mi |
| 930 W 10th St Indianapolis, IN | 1.0–4.0 | 1.0–4.0 | 874 | $3,144 | $3.59 | 4d | 1 | 1.15mi |
| 1470 W 32nd St Indianapolis, IN | 2.0 | 1.0 | 700 | $1,000 | $1.43 | 43d | 1 | 1.16mi |
| 926 W 32nd St Indianapolis, IN | 3.0 | 2.0 | 1050 | $1,295 | $1.23 | 7d | 1 | 1.19mi |
| 1226 Doctor Martin Luther King Junior St Indianapolis, IN | 1.0–3.0 | 1.0–3.5 | 1067 | $2,285 | $2.14 | 1d | 10 | 1.20mi |
| 735 W 11th St Indianapolis, IN | 2.0 | 1.0 | 712 | $1,398 | $1.96 | 43d | 1 | 1.22mi |
| 3017 Ethel Ave Indianapolis, IN | 3.0 | 1.5 | 1079 | $1,400 | $1.30 | 23d | 1 | 1.25mi |
| 2701 W 17th St Indianapolis, IN | 2.0 | 1.0 | 810 | $899 | $1.11 | 7d | 1 | 1.27mi |
| 3440 N Harding St Indianapolis, IN | 2.0 | 1.0 | 754 | $1,275 | $1.69 | 20d | 1 | 1.31mi |
| 3440 N Harding St Indianapolis, IN | 2.0 | 1.0 | 754 | $1,325 | $1.76 | 43d | 1 | 1.31mi |
| 2808 N Capitol Ave Indianapolis, IN | 2.0 | 1.0 | 900 | $975 | $1.08 | 23d | 1 | 1.37mi |
| 1409 N Warman Ave Indianapolis, IN | 2.0 | 1.0 | 816 | $1,300 | $1.59 | 20d | 1 | 1.39mi |
| 55 W Fall Creek Parkway South Dr Unit C Indianapolis, IN | 2.0 | 1.0 | 1000 | $1,035 | $1.03 | 43d | 1 | 1.39mi |
| 1039 W 36th St Indianapolis, IN | 2.0 | 1.0 | 864 | $995 | $1.15 | 43d | 1 | 1.41mi |
| 75 W 18th St Indianapolis, IN | 1.0–2.0 | 1.0–2.0 | 845 | $2,395 | $2.83 | 16d | 8 | 1.42mi |
| 1155 N Holmes Ave Indianapolis, IN | 3.0 | 1.0 | 952 | $2,800 | $2.94 | 3d | 1 | 1.43mi |
| 2131 N Meridian St Indianapolis, IN | 2.0 | 1.0 | 994 | $1,455 | $1.46 | 43d | 1 | 1.44mi |
| 2011 N Kessler Boulevard Dr Indianapolis, IN | 3.0 | 1.0 | 888 | $1,375 | $1.55 | 23d | 1 | 1.44mi |
Listing history 20 events
-
2026-06-18days on market $110,000 Active 45 DOM
-
2026-06-17days on market $110,000 Active 44 DOM
-
2026-06-16days on market $110,000 Active 43 DOM
-
2026-06-15days on market $110,000 Active 42 DOM
-
2026-06-13days on market $110,000 Active 40 DOM
-
2026-06-13pricedays on market $110,000 Active 39 DOM
-
2026-06-09days on market $115,000 Active 36 DOM
-
2026-06-08days on market $115,000 Active 35 DOM
-
2026-06-07days on market $115,000 Active 34 DOM
-
2026-06-03days on market $115,000 Active 30 DOM
-
2026-06-02days on market $115,000 Active 29 DOM
-
2026-06-01days on market $115,000 Active 28 DOM
-
2026-05-31days on market $115,000 Active 27 DOM
-
2026-05-04$120,000 Active 611-char remark
-
2024-04-30historical $895
-
2024-03-26price $895
-
2024-03-13price $940
-
2024-02-13price $990
-
2024-01-31price $1,045
-
2023-12-30$1,100
ⓘ Source: listings_history table (triggers on properties + properties_extension) + one-shot
backfill from property_details.listing_events for pre-trigger history.
Tax reassessment forecast IN · Partial reset (capped growth)
- Current annual tax
- $1,501 · $125/mo
- Projected year-2 tax
- $1,501 · $125/mo
- Expected delta
- $0/yr ($0/mo · 0.0%)
ⓘ Screening estimate from a state-policy table — verify with the county assessor before closing.
Climate risk First Street
- Flood 1/10 Low FEMA zone X (unshaded) · 0% chance over 30 yrs
- Wildfire 1/10 Low
- Heat 4/10 Moderate 7 d/yr ≥102°F today · 19 d/yr by 30 yrs out
- Wind 2/10 Low 0% chance of damaging wind over 30 yrs
- Air quality 4/10 Moderate 5 unhealthy d/yr today · 7 by 30 yrs out
Nearby sold comps map
Loading sold comps map…
Walkable amenities ~0.75 mi
Loading nearby amenities…
Taxation est. · year 1
- Rental income
- $16,500
- − Mortgage interest
- −$6,162
- − Property taxes
- −$1,501
- − Insurance
- −$550
- − Repairs & maintenance
- −$1,320
- − Management
- −$1,320
- − Depreciation
- −$3,200
- Taxable income
- $2,447
- Est. tax owed @ 24.0%
- −$587
- After-tax cash flow
- $3,474/yr
For passive investors: Depreciation is non-cash, so a rental often shows a tax loss while cash-flowing — sheltering income. Rental losses are passive: they offset passive income freely, and up to $25,000/yr can offset ordinary (W-2) income if you actively participate and your MAGI is under $100k (phasing out to $0 by $150k); unused losses carry forward. On sale, claimed depreciation is recaptured at up to 25%, and gains may owe capital-gains tax (a 1031 exchange can defer both). Figures are a year-1 estimate at your 24.0% rate — not tax advice; consult a CPA.
Schools (NCES district)
- District
- Indianapolis Public Schools
- NCES district ID
- 1804770
- Math proficiency
- 14% ▼ -7.00%
- Reading proficiency
- 20% ▼ -3.00%
- Median HH income
- $32,034
- Composite
- 13.69/100
- National rank
- #9499
- State rank
- #286 of 301 in IN
Livability — Indianapolis city (balance)
No livability data for this city. (Only ~50 U.S. cities are tracked.)
Census & demographics
- Census place
- Indianapolis city (balance), IN
- County
- Marion County · 998,460 people
- City population
- 881,119
- Metro
- Indianapolis-Carmel-Anderson, IN
- Population (ZIP)
- 20,180
- Household income
- $63,506
- Rent vs Own
- Severe rent burden
- 1829.0
Population outlook (Marion County) Hauer SSP2
- Today (2025)
- 1,025,572 people
- By 2030
- 1,065,727 · +3.9%
- By 2040
- 1,141,577 · +11.3%
- By 2050
- 1,208,920 · +17.9%
- By 2075
- 1,367,288 · +33.3%
- By 2100
- 1,438,201 · +40.2%
Race, ethnicity, and origin ACS 2023
- Neighborhood character
- Diverse neighborhood (Simpson 0.57)
- Race & ethnicity
- White 62% Black 20% Hispanic / Latino 8% Asian 6% Two or more races 5%
- Hispanic origin (detail)
- Mexican 5%
- Common ancestry
- Italian 4% Romanian 3% Slovak 3%
- Foreign-born
- 11% · Canada, China
- Languages at home
- 86% English-only · Spanish 6% Other Indo-European 3% Arabic 1%
Political lean MEDSL · Marion
- 2024 margin
- Strong D (+27.7) · D 63.0% · R 35.3% · Other 1.7%
- 2008→2024 swing
- -0.7pp no change · 2008: 28.4pp · 2024: 27.7pp
- All cycles
- 2024: D+27.7 2020: D+29.1 2016: D+22.8 2012: D+22.2 2008: D+28.4
Not yet ingested
- Civics
- —
Market trends
- HPI YoY
- ▼ -136.75%
- Current HPI
- 385.5518
- Rent YoY
- ▼ -0.37%
- Metro
- Indianapolis-Carmel-Anderson, IN
- State GDP YoY
- ▲ 2.90%
- F500 in state
- 18
Industry mix (Fortune 500 HQ in IN)
| Industry | F500 HQs | Revenue |
|---|---|---|
| Industrial Machinery | 2 | $37B |
|
||
| Healthcare | 1 | $177B |
|
||
| Pharmaceuticals | 1 | $45B |
|
||
| Metals / Steel | 1 | $18B |
|
||
| Agriculture | 1 | $17B |
|
||
| Packaging | 1 | $12B |
|
||
Price history
+9900.0% since first listed9 events — show timeline
- 2026-06-10 Price Changed $110,000 MIBOR as Distributed by MLS Grid
- 2026-05-25 Price Changed $115,000 MIBOR as Distributed by MLS Grid
- 2026-05-04 Listed $120,000 MIBOR as Distributed by MLS Grid
- 2024-04-30 Rental Removed $895 PROPERTYWARE
- 2024-03-26 Price Changed $895 PROPERTYWARE
- 2024-03-13 Price Changed $940 PROPERTYWARE
- 2024-02-13 Price Changed $990 PROPERTYWARE
- 2024-01-31 Price Changed $1,045 PROPERTYWARE
- 2023-12-30 Listed for Rent $1,100 PROPERTYWARE
Property tax history
+9.9%/yrLatest (2025): $1,501 · +10.6% YoY. Source: county tax records.
Cash-flow waterfall
monthlySold comps — $/sqft
last 12 mo · ≤1 miLoading sold comps…