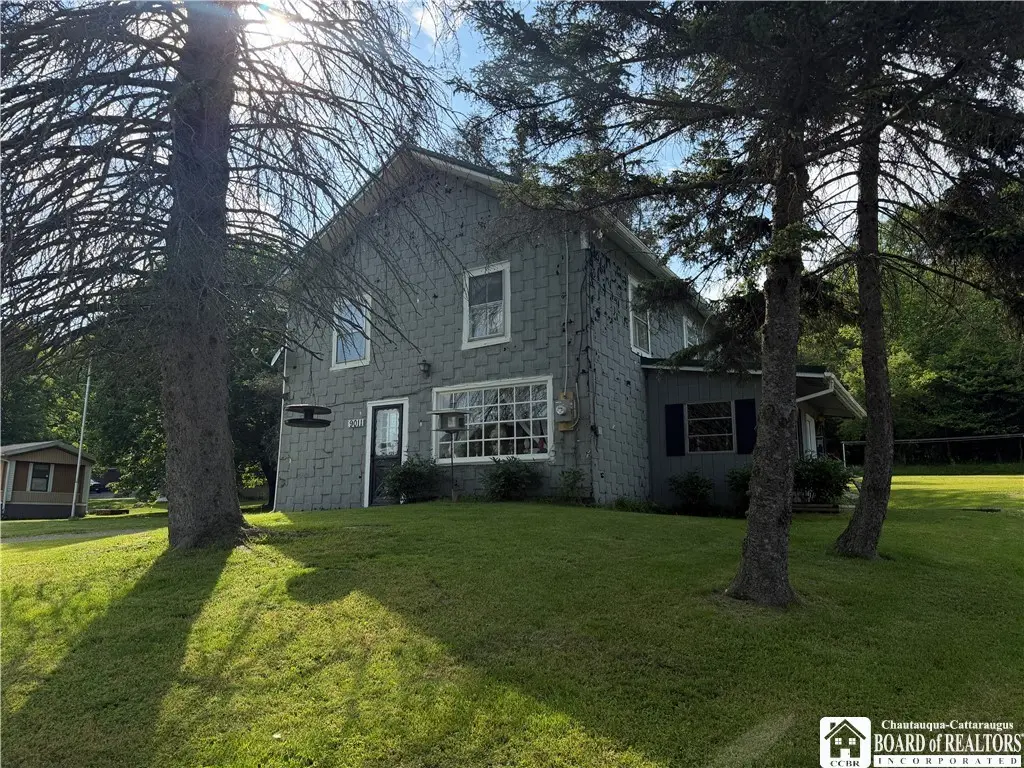
9011 Route 98 · Franklinville, NY
Flood risk 1/10 · Minimal
- FEMA flood zone
- X
- Chance of flooding over 30 yrs
- 0.0%
- Est. flood insurance / yr
- $507 – $1,088
Fire risk 2/10 · Minimal
- Est. fire insurance / yr
- $691 – $1,283
Heat risk 1/10 · Minimal
- Hot days now (above 88°F)
- 7 days/yr
- Hot days in 30 yrs
- 17 days/yr
Wind risk 1/10 · Minimal
- Chance of severe wind over 30 yrs
- —
Air-quality risk 1/10 · Minimal
- Unhealthy air days now
- 0 days/yr
- Unhealthy air days in 30 yrs
- 0 days/yr
Risk factors via First Street. Map © Google.
Why this score? — see what drove the B grade
The composite is a weighted blend of 9 inputs, each scored 0–100. Each bar is that input's sub-score; the figure is the points it added to the 100-point composite (weight × sub-score).
- Cash flow +27.7/30.0
- DSCR +9.7/10.0
- Appreciation +8.0/10.0
- ARV discount +7.5/15.0
- 1% rule +7.3/10.0
- Schools +4.9/10.0
- Livability +3.1/5.0
- Rent growth +2.5/5.0
- Condition / age +2.5/5.0
$99,000
🖨 Deal sheet 📄 Offer letter ✓ Due diligence
Listing remarks
Step back in time and enjoy the charm and character of this historic 3-bedroom, 1-bath home dating back to 1850, it has been told it was once served as the Farmersville Fire House. Nestled in a beautiful country setting, this unique property offers a blend of history and everyday comfort. The main level features a convenient mudroom entry, a spacious kitchen with a breakfast bar for additional seating, and an open dining and living room area perfect for gatherings. Upstairs, you'll find three comfortable bedrooms and a full bath. Outside, the attached one-car garage includes additional storage space for lawn equipment and outdoor essentials. A separate outbuilding provides endless possibi
Key facts
- Outbuilding
- Attached garage
- Historic home
Tags
Property features AI
Exterior
- Parking: Attached garage; 1-car garage
- Utilities: Well water; Septic tank
- Home design: Two-story property; Existing structure; Main thoroughfare road frontage; Rectangular lot (250 x 140)
- Construction: Metal roof; Slab foundation; PEX plumbing; Resale condition
- Exterior features: Gravel driveway; Barn(s), outbuilding, shed(s) and storage
Interior
- Kitchen: Electric oven; Electric range; Refrigerator
- Bedrooms: Three bedrooms on the second floor (Bedroom 1, Bedroom 2, Bedroom 3)
- Flooring: Carpet; Laminate; Varies
- Bathrooms: One full bathroom
- Heating & cooling: Propane heating; Wall furnace; Has heating
- Interior features: Breakfast bar; Separate/formal living room; Combined living and dining area; Workshop; Sump pump in basement
- Laundry & utility: Upper-level laundry; Electric water heater
Neighborhood map
What this means for you Summary
Snapshot
- This is a 3-bed/1.0-bath single-family listed at $99k.
Deal economics
- At list price, monthly cash flow is $298 ($4k/yr) — positive.
- The deal already cash-flows at list — no discount required.
- Meets the 1% rule at list price ($1k rent vs $99k).
Location & tenants
- Location reads 62/100 on livability (#856 in NY) — a middle-class / working-renter tenant base. Strengths: cost of living A+, housing A+, crime A-; Watch: employment C-, schools D+, amenities F.
- Franklinville Central School District (rural): math 60% / reading 57% proficiency, ranked #281 of 590 in NY (top 48%) — acceptable for families but not a draw, mixed tenant base, ~2y average lease.
- Market conditions: 31 active listings in the ZIP; 128 units permitted in Cattaraugus County in 2024 (21 in 5+ unit buildings).
Forward outlook
- In year one you build about $7k of equity ($684 loan paydown + $6k appreciation (5.9% local appreciation)).
- Cattaraugus County population projected at -28% by 2050 — secular population decline; favor cash flow + early exit over multi-decade hold.
- At projected returns (5.9% appreciation + 3.0% rent growth), your $28k cash investment doubles in ~3 years — after that, you're playing with house money.
- By year 6, paydown + projected appreciation supports a ~$36k cash-out refi (75% LTV) — recoverable capital for the next deal without selling this one.
Negotiation context
- Only 6 days on market — expect competitive offers; lowballing is unlikely to land.
Risks & watch-outs
- Watch-outs: built in 1850 — expect roof / HVAC / electrical / plumbing capex.
Questions for the listing agent
- Built in 1850 — when were the roof, HVAC, electrical panel, plumbing, and water heater last replaced?
- Is there a deadline driving the sale (1031 exchange, divorce, estate, relocation)? That informs how much negotiation room exists.
- Schools are D-rated, which usually means shorter tenancies and higher turnover. Who's the typical renter profile here, and what's been the actual vacancy rate?
- What's the average days-on-market for RENTAL listings here right now (not sales)? A rising rental-DOM trend means longer vacancies and softer asking-rent achievability than the comps imply.
- What's the recent tenant-quality profile in this submarket — average credit score on applications, eviction rate, late-payment / NSF rate, and stable-employment percentage? A property-management company in the area should have these aggregated.
- How much new for-sale + rental construction is in the pipeline within 1–3 miles? Heavy new supply typically softens prices + rents 12–24 months out; constrained supply supports both.
Investment metrics
- 1% rule
- 1.23% ✓
- Cap rate
- 9.90%
- Cash-on-cash
- 12.89%
- DSCR
- 1.57
- GRM
- 6.8
CMA / ARV
No comps found within radius.
Projected returns pro-forma
5.93% appreciation · 3.0% rent growth · sell at horizon
- IRR
- 25.9%
- Equity multiple
- 2.70×
- Total profit
- $47,135
- Equity at exit
- $61,787
- IRR
- 24.4%
- Equity multiple
- 5.47×
- Total profit
- $123,913
- Equity at exit
- $111,661
Cash invested: $27,720 (down + closing). Projections, not guarantees.
Landlord ↔ Tenant lean methodology
- Overall (STATE)
- 15 Strongly Tenant-Friendly
- State New York
- 15 Strongly Tenant-Friendly · D+10
- County
- — inherits STATE
- City
- — inherits STATE
ZIP-level market 14737
- Home prices YoY
- 2.0%
- Active inventory
- 31
- Price-to-rent
- 6.8×
Monthly cashflow live
- Estimated rent
- $1,215 medium interval (Pro) →
- Mortgage (P&I)
- −$519
- Tax from tax record
- −$102 /mo · $1,220/yr
- Insurance
- −$41
- HOA
- −$0
- Vacancy / Maint / Mgmt
- −$255
- Net cashflow
- $298
Break-even live
UW: 25.0% down · 7.5% · 30yr · 1.5% tax · 5.0% vac · 8.0% maint · 8.0% mgmt
Financing live
Cash to close
- Down payment
- $24,750
- Closing costs
- $2,970
- Reserves months
- —
- Total cash needed
- —
Loan-product check · same deal, 3 products live
Conventional
25% down · 7.5% · 30yr
- Down + closing
- —
- Monthly P&I
- —
- Monthly cashflow
- —
- DSCR
- —
- Eligible?
- —
Personal DTI + credit; lowest rate.
DSCR
20% down · 8.5% · 30yr
- Down + closing
- —
- Monthly P&I
- —
- Monthly cashflow
- —
- DSCR
- —
- Eligible?
- —
No personal income docs; deal must DSCR.
Hard money
10% down · 12.0% · 12mo
- Down + closing
- —
- Monthly P&I
- —
- Monthly cashflow
- —
- DSCR
- —
- Eligible?
- —
Short-term bridge; refi at stabilization.
Listing history 6 events
-
2026-06-18days on market $99,000 Active 6 DOM
-
2026-06-17days on market $99,000 Active 5 DOM
-
2026-06-16days on market $99,000 Active 4 DOM
-
2026-06-15days on market $99,000 Active 3 DOM
-
2026-06-12remarks 699-char remark
-
2026-06-12$99,000 Active 1 DOM
ⓘ Source: listings_history table (triggers on properties + properties_extension) + one-shot
backfill from property_details.listing_events for pre-trigger history.
Tax reassessment forecast NY · Partial reset (capped growth)
- Current annual tax
- $1,220 · $102/mo
- Projected year-2 tax
- $1,447 · $121/mo
- Expected delta
- +$227/yr (+$19/mo · 18.6%)
ⓘ Screening estimate from a state-policy table — verify with the county assessor before closing.
Climate risk First Street
- Flood 1/10 Low FEMA zone X · 0% chance over 30 yrs
- Wildfire 2/10 Low
- Heat 1/10 Low 7 d/yr ≥88°F today · 17 d/yr by 30 yrs out
- Wind 1/10 Low
- Air quality 1/10 Low 0 unhealthy d/yr today · 0 by 30 yrs out
Nearby sold comps map
Loading sold comps map…
Walkable amenities ~0.75 mi
Loading nearby amenities…
Taxation est. · year 1
- Rental income
- $14,581
- − Mortgage interest
- −$5,546
- − Property taxes
- −$1,220
- − Insurance
- −$495
- − Repairs & maintenance
- −$1,166
- − Management
- −$1,166
- − Depreciation
- −$2,880
- Taxable income
- $2,107
- Est. tax owed @ 24.0%
- −$506
- After-tax cash flow
- $3,068/yr
For passive investors: Depreciation is non-cash, so a rental often shows a tax loss while cash-flowing — sheltering income. Rental losses are passive: they offset passive income freely, and up to $25,000/yr can offset ordinary (W-2) income if you actively participate and your MAGI is under $100k (phasing out to $0 by $150k); unused losses carry forward. On sale, claimed depreciation is recaptured at up to 25%, and gains may owe capital-gains tax (a 1031 exchange can defer both). Figures are a year-1 estimate at your 24.0% rate — not tax advice; consult a CPA.
Schools (NCES district)
- District
- Franklinville Central School District
- NCES district ID
- 3611490
- Math proficiency
- 60% ▲ 11.00%
- Reading proficiency
- 57% ▲ 16.00%
- Median HH income
- $41,110
- Composite
- 49.0/100
- National rank
- #2068
- State rank
- #281 of 590 in NY
Livability — Franklinville
- Score
- 62/100
- State rank
- #856
- US rank
- #16514
Category grades
Schools grade is shown separately in the Schools card above.
Census & demographics
- Population (ZIP)
- 4,071
Population outlook (Cattaraugus County) Hauer SSP2
- Today (2025)
- 71,623 people
- By 2030
- 67,751 · -5.4%
- By 2040
- 59,488 · -16.9%
- By 2050
- 51,601 · -28.0%
- By 2075
- 35,025 · -51.1%
- By 2100
- 21,243 · -70.3%
Race, ethnicity, and origin ACS 2023
- Neighborhood character
- Predominantly White (85%)
- Race & ethnicity
- White 85% Two or more races 9% Hispanic / Latino 5% Native American 1%
- Common ancestry
- Romanian 10% Iranian 2% Lithuanian 2%
- Foreign-born
- 2% · Canada
- Languages at home
- 97% English-only · German/W. Germanic 1%
Political lean MEDSL · Cattaraugus
- 2024 margin
- Solid R (+32.8) · D 33.6% · R 66.4%
- 2008→2024 swing
- -22.2pp toward R · 2008: -10.6pp · 2024: -32.8pp
- All cycles
- 2024: R+32.8 2020: R+29.5 2016: R+34.4 2012: R+13.4 2008: R+10.6
Not yet ingested
- Civics
- —
Market trends
- HPI YoY
- ▲ 5.93%
- Current HPI
- 305.4492
- Rent YoY
- —
- Metro
- —
- State GDP YoY
- ▲ 2.60%
- F500 in state
- 92
Industry mix (Fortune 500 HQ in NY)
| Industry | F500 HQs | Revenue |
|---|---|---|
| Financial Services | 10 | $950B |
|
||
| Consumer Goods | 9 | $162B |
|
||
| Insurance | 4 | $225B |
|
||
| Telecommunications | 2 | $144B |
|
||
| Pharmaceuticals | 2 | $112B |
|
||
| Media / Entertainment | 2 | $69B |
|
||
Price history
1 event — show timeline
- 2026-06-12 Listed $99,000 UNYREIS
Property tax history
+5.0%/yrLatest (2025): $1,220 · +0.7% YoY. Source: county tax records.
Cash-flow waterfall
monthlySold comps — $/sqft
last 12 mo · ≤1 miLoading sold comps…