300 E Willis · Georgetown, AR
Flood risk 1/10 · Minimal
- FEMA flood zone
- A
- Chance of flooding over 30 yrs
- 0.0%
- Est. flood insurance / yr
- $1,009 – $1,996
Fire risk 3/10 · Minor
- Est. fire insurance / yr
- $1,499 – $2,785
Heat risk 6/10 · Moderate
- Hot days now (above 110°F)
- 7 days/yr
- Hot days in 30 yrs
- 19 days/yr
Wind risk 4/10 · Minor
- Chance of severe wind over 30 yrs
- 9.0%
Air-quality risk 1/10 · Minimal
- Unhealthy air days now
- 0 days/yr
- Unhealthy air days in 30 yrs
- 0 days/yr
Risk factors via First Street. Map © Google.
Why this score? — see what drove the D+ grade
The composite is a weighted blend of 9 inputs, each scored 0–100. Each bar is that input's sub-score; the figure is the points it added to the 100-point composite (weight × sub-score).
- Cash flow +19.3/30.0
- ARV discount +7.5/15.0
- DSCR +6.1/10.0
- 1% rule +3.8/10.0
- Rent growth +2.5/5.0
- Condition / age +2.5/5.0
- Livability +2.1/5.0
- Schools +1.9/10.0
- Appreciation +0.0/10.0
$149,000
🖨 Deal sheet 📄 Offer letter ✓ Due diligence
Listing remarks
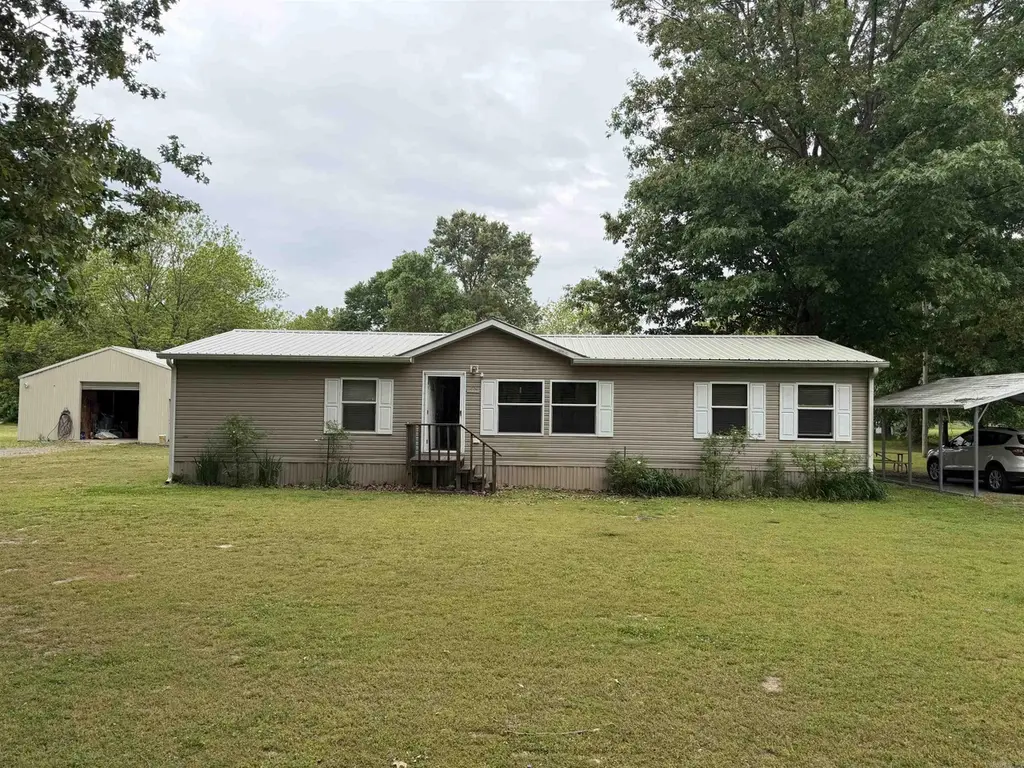
Welcome to your own slice of quiet country living! This well-maintained 4-bedroom, 2-bath home offers 1,512 sqft of comfortable space, perfectly situated on just under 2 acres in a peaceful, highly desirable outdoor recreation area. Step inside to find a warm and inviting interior featuring updated flooring, a spacious living area, and plenty of natural light. The functional layout provides ample room for family, guests, or even a home office setup. Outside is where this property really shines. Enjoy wide-open, level land with endless possibilities—gardening, entertaining, or simply relaxing in the fresh air. The impressive 30’ x 40’ shop with an additional 20’ lean-
Key facts
- 20 lean-to
- Wide-open level land
- Updated flooring
Tags
Property features AI
Finance
- Other: Approximately 1.7 acres (327' x 231'); Approximate living area 1,512
Exterior
- Parking: Detached carport
- Utilities: Public water; Public sewer
- Home design: Metal/Vinyl siding; Inside city limits
- Construction: Metal roof; Crawl space foundation
- Exterior features: Shop; Underpinning; Paved road access; Level lot
Interior
- Kitchen: Free-standing stove; Microwave; Breakfast bar (kitchen seating)
- Bedrooms: Den/Family Room (additional living space); Laundry (as a room)
- Flooring: Vinyl flooring
- Bathrooms: 2 full bathrooms
- Heating & cooling: Central electric heating; Central electric cooling
- Interior features: Washer connection; Electric dryer connection; Walk-in closets; Ceiling fans; Breakfast bar
- Laundry & utility: Washer connection; Electric dryer connection; Laundry room
Neighborhood map
What this means for you Summary
Snapshot
- This is a 4-bed/2.0-bath manufactured listed at $149k.
Deal economics
- At list price, monthly cash flow is $38 ($460/yr) — positive.
- The deal already cash-flows at list — no discount required.
- To meet the 1% rule (rent ≥ 1% of price), the offer needs to be $131k (11.8% below list).
- Recommended offer: $131k (11.8% below list) — sets the bar for 1% rule.
Location & tenants
- Location reads 43/100 on livability (#522 in AR) — a working-class tenant base; expect higher turnover. Strengths: cost of living A+; Watch: schools F, crime F, amenities F.
- Riverview School District (town): math 20% / reading 26% proficiency, ranked #202 of 238 in AR (top 85%) — low school quality limits family demand, transient renter base, plan for 1-2y turnover; 62% free/reduced lunch — lower-income household profile, screen leases tightly.
- Market conditions: 173 active listings in the ZIP; 219 units permitted in White County in 2024 (36 in 5+ unit buildings).
Forward outlook
- Local home prices are declining (-3.0%/yr); year-one equity from $1k of loan paydown is wiped out by about $4k of value loss. Plan a longer hold.
- White County population projected at +7% by 2050 — modest demand growth; plan on rents tracking national, not racing it.
Negotiation context
- It's been on market 57 days — a 3% lower offer ($145k) is reasonable based on typical stale-listing flexibility.
- Current owner paid $6k; list at $149k implies a 2383% gain — meaningful room to come down on a strong offer.
Risks & watch-outs
- Watch-outs: flood insurance adds $125/mo.
- Climate carrying-cost: in FEMA flood zone A (mandatory federal flood insurance); extreme-heat days projected 7→19/yr by 2055 (HVAC capex compounding) — expect insurance premiums to compound above CPI over the hold.
Questions for the listing agent
- It's been on market 57 days. Have you received any prior offers? Is the seller open to a 12% concession, seller financing, or rate buy-down credit?
- What's the actual annual flood-insurance premium (NFIP or private), and is the property in a SFHA with mandatory coverage?
- Is there a deadline driving the sale (1031 exchange, divorce, estate, relocation)? That informs how much negotiation room exists.
- Schools are F-rated, which usually means shorter tenancies and higher turnover. Who's the typical renter profile here, and what's been the actual vacancy rate?
- Crime grade is F in this area — have there been break-ins, vandalism, or insurance claims at this property in the last 3 years? What carrier currently insures it and at what premium?
- The area grade is low — what's the realistic commute time and amenity access for the typical tenant pool here? Any planned neighborhood developments (good or bad) we should know about?
- What's the average days-on-market for RENTAL listings here right now (not sales)? A rising rental-DOM trend means longer vacancies and softer asking-rent achievability than the comps imply.
- What's the recent tenant-quality profile in this submarket — average credit score on applications, eviction rate, late-payment / NSF rate, and stable-employment percentage? A property-management company in the area should have these aggregated.
- How much new for-sale + rental construction is in the pipeline within 1–3 miles? Heavy new supply typically softens prices + rents 12–24 months out; constrained supply supports both.
Investment metrics
- 1% rule
- 0.88% ✗
- Cap rate
- 7.61%
- Cash-on-cash
- 4.70%
- DSCR
- 1.21
- GRM
- 9.5
CMA / ARV
No comps found within radius.
Projected returns pro-forma
-3.0% appreciation · 3.0% rent growth · sell at horizon
- IRR
- -14.5%
- Equity multiple
- 0.48×
- Total profit
- $-21,703
- Equity at exit
- $22,216
- IRR
- -5.8%
- Equity multiple
- 0.62×
- Total profit
- $-15,752
- Equity at exit
- $12,883
Cash invested: $41,720 (down + closing). Projections, not guarantees.
Landlord ↔ Tenant lean methodology
- Overall (STATE)
- 92 Strongly Landlord-Friendly
- State Arkansas
- 92 Strongly Landlord-Friendly · R+14
- County
- — inherits STATE
- City
- — inherits STATE
ZIP-level market 72143
- Home prices YoY
- -28.4%
- Active inventory
- 173
- Price-to-rent
- 9.5×
Monthly cashflow live
- Estimated rent
- $1,314 medium interval (Pro) →
- Mortgage (P&I)
- −$781
- Tax from tax record
- −$31 /mo · $370/yr
- Insurance
- −$62
- Flood insurance flood zone
- −$125 /mo · $1,502/yr
- HOA
- −$0
- Vacancy / Maint / Mgmt
- −$276
- Net cashflow
- $38
Break-even live
UW: 25.0% down · 7.5% · 30yr · 1.5% tax · 5.0% vac · 8.0% maint · 8.0% mgmt
Financing live
Cash to close
- Down payment
- $37,250
- Closing costs
- $4,470
- Reserves months
- —
- Total cash needed
- —
Loan-product check · same deal, 3 products live
Conventional
25% down · 7.5% · 30yr
- Down + closing
- —
- Monthly P&I
- —
- Monthly cashflow
- —
- DSCR
- —
- Eligible?
- —
Personal DTI + credit; lowest rate.
DSCR
20% down · 8.5% · 30yr
- Down + closing
- —
- Monthly P&I
- —
- Monthly cashflow
- —
- DSCR
- —
- Eligible?
- —
No personal income docs; deal must DSCR.
Hard money
10% down · 12.0% · 12mo
- Down + closing
- —
- Monthly P&I
- —
- Monthly cashflow
- —
- DSCR
- —
- Eligible?
- —
Short-term bridge; refi at stabilization.
Listing history 18 events
-
2026-06-19days on market $149,000 Active 57 DOM
-
2026-06-18days on market $149,000 Active 56 DOM
-
2026-06-17days on market $149,000 Active 55 DOM
-
2026-06-16days on market $149,000 Active 54 DOM
-
2026-06-15days on market $149,000 Active 53 DOM
-
2026-06-14days on market $149,000 Active 51 DOM
-
2026-06-12days on market $149,000 Active 50 DOM
-
2026-06-09days on market $149,000 Active 47 DOM
-
2026-06-08days on market $149,000 Active 46 DOM
-
2026-06-07days on market $149,000 Active 45 DOM
-
2026-06-05days on market $149,000 Active 42 DOM
-
2026-06-03days on market $149,000 Active 41 DOM
-
2026-06-02days on market $149,000 Active 40 DOM
-
2026-06-01days on market $149,000 Active 39 DOM
-
2026-05-31days on market $149,000 Active 38 DOM
-
2026-05-30days on market $149,000 Active 37 DOM
-
2026-04-23$149,000 New Listing 1217-char remark
-
2001-02-15soldstatus $6,000
ⓘ Source: listings_history table (triggers on properties + properties_extension) + one-shot
backfill from property_details.listing_events for pre-trigger history.
Tax reassessment forecast AR · Resets to sale price
- Current annual tax
- $370 · $31/mo
- Projected year-2 tax
- $954 · $79/mo
- Expected delta
- +$584/yr (+$49/mo · 157.7%)
ⓘ Screening estimate from a state-policy table — verify with the county assessor before closing.
Climate risk First Street
- Flood 1/10 Low FEMA zone A · 0% chance over 30 yrs
- Wildfire 3/10 Moderate
- Heat 6/10 Major 7 d/yr ≥110°F today · 19 d/yr by 30 yrs out
- Wind 4/10 Moderate 9% chance of damaging wind over 30 yrs
- Air quality 1/10 Low 0 unhealthy d/yr today · 0 by 30 yrs out
Nearby sold comps map
Loading sold comps map…
Walkable amenities ~0.75 mi
Loading nearby amenities…
Taxation est. · year 1
- Rental income
- $15,764
- − Mortgage interest
- −$8,346
- − Property taxes
- −$370
- − Insurance
- −$2,248
- − Repairs & maintenance
- −$1,261
- − Management
- −$1,261
- − Depreciation
- −$4,335
- Taxable loss
- −$2,056
- Est. tax savings @ 24.0%
- +$494
- After-tax cash flow
- $953/yr
For passive investors: Depreciation is non-cash, so a rental often shows a tax loss while cash-flowing — sheltering income. Rental losses are passive: they offset passive income freely, and up to $25,000/yr can offset ordinary (W-2) income if you actively participate and your MAGI is under $100k (phasing out to $0 by $150k); unused losses carry forward. On sale, claimed depreciation is recaptured at up to 25%, and gains may owe capital-gains tax (a 1031 exchange can defer both). Figures are a year-1 estimate at your 24.0% rate — not tax advice; consult a CPA.
Schools (NCES district)
- District
- Riverview School District
- NCES district ID
- 0508400
- Math proficiency
- 20% ▼ -14.00%
- Reading proficiency
- 26% ▼ -9.00%
- Median HH income
- $32,801
- Composite
- 18.74/100
- National rank
- #8877
- State rank
- #202 of 238 in AR
Livability — Georgetown
- Score
- 43/100
- State rank
- #522
- US rank
- #26848
Category grades
Schools grade is shown separately in the Schools card above.
Census & demographics
- Census place
- Georgetown, AR
- County
- White County · 35,000 people
- Metro
- Searcy, AR
- Population (ZIP)
- 35,000
- Household income
- $58,344
- Rent vs Own
- Severe rent burden
- 804.0
Population outlook (White County) Hauer SSP2
- Today (2025)
- 82,310 people
- By 2030
- 83,861 · +1.9%
- By 2040
- 86,492 · +5.1%
- By 2050
- 88,246 · +7.2%
- By 2075
- 91,307 · +10.9%
- By 2100
- 91,548 · +11.2%
Race, ethnicity, and origin ACS 2023
- Neighborhood character
- Predominantly White (82%)
- Race & ethnicity
- White 82% Black 7% Hispanic / Latino 6% Two or more races 5%
- Hispanic origin (detail)
- Mexican 4%
- Common ancestry
- Italian 2% Slovak 1% Serbian 1%
- Foreign-born
- 2% · Canada
- Languages at home
- 95% English-only · Spanish 4%
Political lean MEDSL · White
- 2024 margin
- Solid R (+61.2) · D 18.3% · R 79.5% · Other 2.2%
- 2008→2024 swing
- -14.0pp toward R · 2008: -47.2pp · 2024: -61.2pp
- All cycles
- 2024: R+61.2 2020: R+58.9 2016: R+57.9 2012: R+53.7 2008: R+47.2
Not yet ingested
- Civics
- —
Market trends
- HPI YoY
- ▼ -81.60%
- Current HPI
- 206.0334
- Rent YoY
- —
- Metro
- Searcy, AR
- State GDP YoY
- ▲ 3.80%
- F500 in state
- 10
Industry mix (Fortune 500 HQ in AR)
| Industry | F500 HQs | Revenue |
|---|---|---|
| Retail | 1 | $681B |
|
||
| Food / Agriculture | 1 | $53B |
|
||
| Retail / Energy | 1 | $22B |
|
||
| Transportation / Logistics | 1 | $12B |
|
||
| Energy | 1 | $4B |
|
||
Price history
+2383.3% since first listed2 events — show timeline
- 2026-04-23 Listed $149,000 CARMLS
- 2001-02-15 Sold (Public Records) $6,000 Public Records
Property tax history
+0.0%/yrLatest (2020): $370 · +0.0% YoY. Source: county tax records.
Cash-flow waterfall
monthlySold comps — $/sqft
last 12 mo · ≤1 miLoading sold comps…