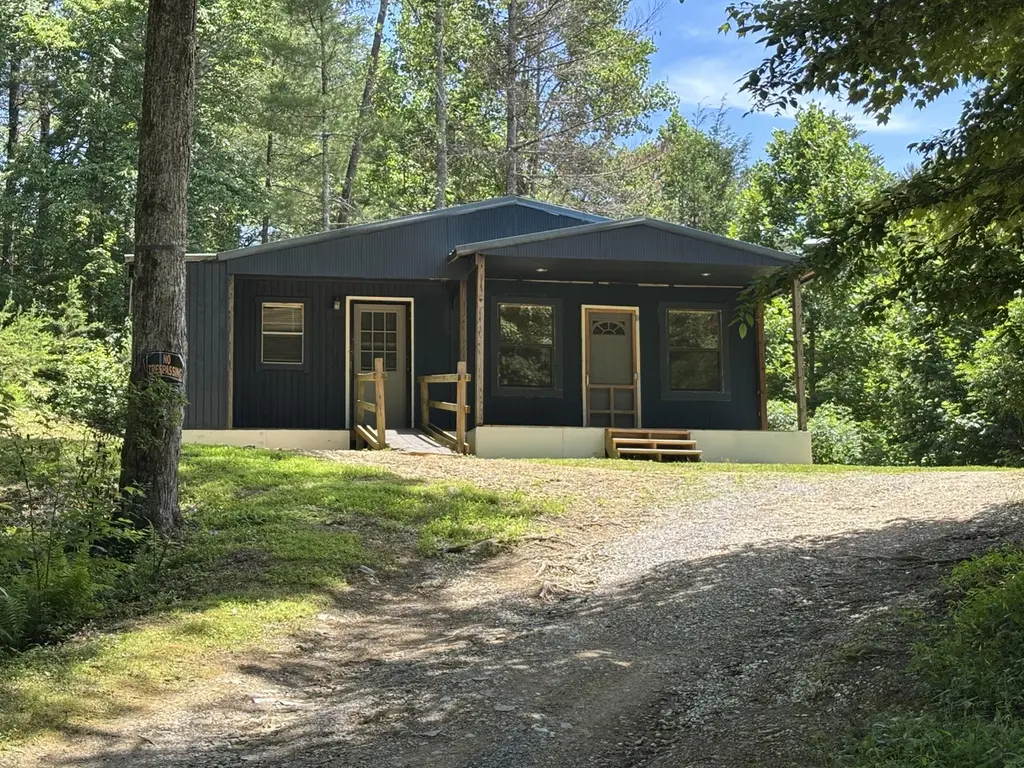
4509 Raven View Way · Newport, TN
Flood risk No data
- FEMA flood zone
- —
- Chance of flooding over 30 yrs
- —
- Est. flood insurance / yr
- —
Fire risk No data
- Est. fire insurance / yr
- —
Heat risk No data
- Hot days now (above threshold)
- —
- Hot days in 30 yrs
- —
Wind risk No data
- Chance of severe wind over 30 yrs
- —
Air-quality risk No data
- Unhealthy air days now
- —
- Unhealthy air days in 30 yrs
- —
Risk factors via First Street. Map © Google.
Why this score? — see what drove the C- grade
The composite is a weighted blend of 9 inputs, each scored 0–100. Each bar is that input's sub-score; the figure is the points it added to the 100-point composite (weight × sub-score).
- Cash flow +16.4/30.0
- Appreciation +10.0/10.0
- ARV discount +7.5/15.0
- DSCR +5.1/10.0
- 1% rule +3.5/10.0
- Livability +2.8/5.0
- Rent growth +2.5/5.0
- Condition / age +2.5/5.0
- Schools +1.7/10.0
$100,000
🖨 Deal sheet (PDF) 📄 Offer letter ✓ Due diligence
Listing remarks MLS
CASH OR RENO LOAN ONLY - Investment Opportunity! Built in 2009, this 864 sq ft home offers plenty of potential for the right buyer. With a little TLC and vision, it could be transformed into a great rental property, a profitable flip, or even a cozy personal home. The home currently uses a rainwater collection system, and a well will be needed for permanent water access. This property is being sold as-is, making it an excellent option for investors or handy buyers looking for a project. * * This home has a one-bedroom septic but has a bonus room as well! Don't miss this chance to unlock the value in this home and turn it into something special!
Key facts
- 1.36 acre lot
- Built 2016
- Listed 8 days
Property features AI
Exterior
- Home design: Cabin; Single-story; One level
- Construction: Block foundation
- Exterior features: Approximately 1.36-acre lot; Lot dimensions approximately 331 x 231 x 187 x 189 feet
Interior
- Kitchen: Refrigerator
- Bathrooms: 1 full bathroom
- Heating & cooling: Space heater; No central cooling
- Interior features: Refrigerator; Accessible entrance with ramp
Neighborhood map
What this means for you Summary
Snapshot
- This is a 2-bed/1.0-bath single-family listed at $100k.
Deal economics
- At list price, monthly cash flow is $57 ($688/yr) — positive.
- The deal already cash-flows at list — no discount required.
- To meet the 1% rule (rent ≥ 1% of price), the offer needs to be $85k (15.1% below list).
- Recommended offer: $85k (15.1% below list) — sets the bar for 1% rule.
- Cap rate 7.0% vs local median 3.1% in Newport — top-decile yield for the area; either an underpriced asset or a hidden risk that comps aren't pricing in. Stress-test before assuming the spread holds.
Location & tenants
- Location reads 56/100 on livability (#347 in TN) — a working-class tenant base; expect higher turnover. Strengths: cost of living A+, housing A-; Watch: crime F, amenities F, commute F.
- Cocke County (rural): math 21% / reading 21% proficiency, ranked #112 of 139 in TN (top 81%) — low school quality limits family demand, transient renter base, plan for 1-2y turnover; 71% free/reduced lunch — lower-income household profile, screen leases tightly.
- Zoned schools: Grassy Fork Elementary (math 42% / reading 37%, grade F, #231 of 952 statewide, top 26%, 127 students, 0% FRL); Cosby High School (math 8% / reading 27%, grade F, #215 of 332 statewide, top 67%, 326 students, 0% FRL) — zoned schools average 0% FRL vs 71% district-wide (71 pts lower); this property's tenant base skews higher-income than the district average.
- Market conditions: 82 active listings in the ZIP; 13 units permitted in Cocke County in 2024 (0 in 5+ unit buildings).
Forward outlook
- In year one you build about $11k of equity ($691 loan paydown + $10k appreciation (10.0% local appreciation)).
- Cocke County population projected at -19% by 2050 — secular population decline; favor cash flow + early exit over multi-decade hold.
- At projected returns (10.0% appreciation + 3.0% rent growth), your $28k cash investment doubles in ~3 years — after that, you're playing with house money.
- By year 4, paydown + projected appreciation supports a ~$38k cash-out refi (75% LTV) — recoverable capital for the next deal without selling this one.
Negotiation context
- Only 8 days on market — expect competitive offers; lowballing is unlikely to land.
- 3 sale attempts with the ask held roughly flat each time — persistent listings suggest the price (not the market) is what's stuck; bring a comps-based counter.
- Current owner paid $65k; list at $100k implies a 54% gain — meaningful room to come down on a strong offer.
Questions for the listing agent
- Is there a deadline driving the sale (1031 exchange, divorce, estate, relocation)? That informs how much negotiation room exists.
- Schools are F-rated, which usually means shorter tenancies and higher turnover. Who's the typical renter profile here, and what's been the actual vacancy rate?
- Crime grade is F in this area — have there been break-ins, vandalism, or insurance claims at this property in the last 3 years? What carrier currently insures it and at what premium?
- What's the average days-on-market for RENTAL listings here right now (not sales)? A rising rental-DOM trend means longer vacancies and softer asking-rent achievability than the comps imply.
- What's the recent tenant-quality profile in this submarket — average credit score on applications, eviction rate, late-payment / NSF rate, and stable-employment percentage? A property-management company in the area should have these aggregated.
- How much new for-sale + rental construction is in the pipeline within 1–3 miles? Heavy new supply typically softens prices + rents 12–24 months out; constrained supply supports both.
Investment metrics
- 1% rule
- 0.85% ✗
- Cap rate
- 6.98%
- Cash-on-cash
- 2.46%
- DSCR
- 1.11
- GRM
- 9.8
CMA / ARV
- ARV (on-the-fly)
- $64,800
- Comps found
- 1
Show comp detail 1 sale within ~0.75 mi
| Address | Dist | Beds/Ba | Sqft | Sold | Price | $/sf | Match |
|---|---|---|---|---|---|---|---|
| 4509 Raven View Way | 0.00mi | 1/1.0 (-1) | 864 (0%) | 7mo | $65,000 | $75 | 89 |
Match score weights: distance 35% · size 25% · config 20% · recency 20%. Top-matched comps best support the ARV.
Projected returns pro-forma
10.0% appreciation · 3.0% rent growth · sell at horizon
- IRR
- 26.0%
- Equity multiple
- 3.07×
- Total profit
- $58,079
- Equity at exit
- $90,088
- IRR
- 22.9%
- Equity multiple
- 7.00×
- Total profit
- $168,093
- Equity at exit
- $194,278
Cash invested: $28,000 (down + closing). Projections, not guarantees.
Landlord ↔ Tenant lean methodology
- Overall (STATE)
- 87 Strongly Landlord-Friendly
- State Tennessee
- 87 Strongly Landlord-Friendly · R+13
- County
- — inherits STATE
- City
- — inherits STATE
ZIP-level market 37727
- Home prices YoY
- 4.6%
- Active inventory
- 82
- Price-to-rent
- 9.8×
Monthly cashflow live
- Estimated rent
- $849 medium interval (Pro) →
- Mortgage (P&I)
- −$524
- Tax from tax record
- −$47 /mo · $568/yr
- Insurance
- −$42
- HOA
- −$0
- Vacancy / Maint / Mgmt
- −$178
- Net cashflow
- $57
Break-even live
Sensitivity live
| Price | -10% $114 | -5% $86 | +0% $57 | +5% $29 | +10% $1 |
|---|---|---|---|---|---|
| Rent | -10% $-10 | -5% $24 | +0% $57 | +5% $91 | +10% $124 |
| Rate | -1.0pp $108 | -0.5pp $83 | base $57 | +0.5pp $31 | +1.0pp $5 |
UW: 25.0% down · 7.5% · 30yr · 1.5% tax · 5.0% vac · 8.0% maint · 8.0% mgmt
Financing live
Cash to close
- Down payment
- $25,000
- Closing costs
- $3,000
- Reserves months
- —
- Total cash needed
- —
Loan-product check · same deal, 3 products live
Conventional
25% down · 7.5% · 30yr
- Down + closing
- —
- Monthly P&I
- —
- Monthly cashflow
- —
- DSCR
- —
- Eligible?
- —
Personal DTI + credit; lowest rate.
DSCR
20% down · 8.5% · 30yr
- Down + closing
- —
- Monthly P&I
- —
- Monthly cashflow
- —
- DSCR
- —
- Eligible?
- —
No personal income docs; deal must DSCR.
Hard money
10% down · 12.0% · 12mo
- Down + closing
- —
- Monthly P&I
- —
- Monthly cashflow
- —
- DSCR
- —
- Eligible?
- —
Short-term bridge; refi at stabilization.
Listing history 8 events
-
2026-06-21days on market $100,000 Active 8 DOM
-
2026-06-19days on market $100,000 Active 6 DOM
-
2026-06-18days on market $100,000 Active 5 DOM
-
2026-06-17days on market $100,000 Active 4 DOM
-
2026-06-16days on market $100,000 Active 3 DOM
-
2026-06-15days on market $100,000 Active 2 DOM
-
2026-06-14remarks 699-char remark
-
2026-06-14$100,000 Active 1 DOM
ⓘ Source: listings_history table (triggers on properties + properties_extension) + one-shot
backfill from property_details.listing_events for pre-trigger history.
Tax reassessment forecast TN · Resets to sale price
- Current annual tax
- $568 · $47/mo
- Projected year-2 tax
- $710 · $59/mo
- Expected delta
- +$142/yr (+$12/mo · 25.0%)
ⓘ Screening estimate from a state-policy table — verify with the county assessor before closing.
Nearby sold comps map
Loading sold comps map…
Walkable amenities ~0.75 mi
Loading nearby amenities…
Taxation est. · year 1
- Rental income
- $10,188
- − Mortgage interest
- −$5,602
- − Property taxes
- −$568
- − Insurance
- −$500
- − Repairs & maintenance
- −$815
- − Management
- −$815
- − Depreciation
- −$2,909
- Taxable loss
- −$1,020
- Est. tax savings @ 24.0%
- +$245
- After-tax cash flow
- $933/yr
For passive investors: Depreciation is non-cash, so a rental often shows a tax loss while cash-flowing — sheltering income. Rental losses are passive: they offset passive income freely, and up to $25,000/yr can offset ordinary (W-2) income if you actively participate and your MAGI is under $100k (phasing out to $0 by $150k); unused losses carry forward. On sale, claimed depreciation is recaptured at up to 25%, and gains may owe capital-gains tax (a 1031 exchange can defer both). Figures are a year-1 estimate at your 24.0% rate — not tax advice; consult a CPA.
Schools (NCES district)
- District
- Cocke County
- NCES district ID
- 4700750
- Math proficiency
- 21% ▼ -10.00%
- Reading proficiency
- 21% ▼ -10.00%
- Median HH income
- $33,486
- Composite
- 17.17/100
- National rank
- #9109
- State rank
- #112 of 139 in TN
Livability — Newport
- Score
- 56/100
- State rank
- #347
- US rank
- #22944
Category grades
Schools grade is shown separately in the Schools card above.
Census & demographics
- Population (ZIP)
- 2,026
Population outlook (Cocke County) Hauer SSP2
- Today (2025)
- 33,586 people
- By 2030
- 32,394 · -3.5%
- By 2040
- 29,727 · -11.5%
- By 2050
- 27,075 · -19.4%
- By 2075
- 22,590 · -32.7%
- By 2100
- 19,643 · -41.5%
Race, ethnicity, and origin ACS 2023
- Neighborhood character
- Predominantly White (97%)
- Race & ethnicity
- White 97% Two or more races 2%
- Common ancestry
- Romanian 3% Slovak 3% Lithuanian 1%
- Languages at home
- 99% English-only · Spanish 1%
Political lean MEDSL · Cocke
- 2024 margin
- Solid R (+68.2) · D 15.4% · R 83.7%
- 2008→2024 swing
- -23.3pp toward R · 2008: -44.9pp · 2024: -68.2pp
- All cycles
- 2024: R+68.2 2020: R+64.8 2016: R+64.5 2012: R+49.4 2008: R+44.9
Not yet ingested
- Civics
- —
Market trends
- HPI YoY
- ▲ 19.08%
- Current HPI
- 435.9597
- Rent YoY
- —
- Metro
- —
- State GDP YoY
- ▲ 2.78%
- F500 in state
- 22
Industry mix (Fortune 500 HQ in TN)
| Industry | F500 HQs | Revenue |
|---|---|---|
| Healthcare | 3 | $91B |
|
||
| Retail | 3 | $72B |
|
||
| Transportation / Logistics | 1 | $88B |
|
||
| Paper / Packaging | 1 | $19B |
|
||
| Insurance | 1 | $13B |
|
||
| Energy | 1 | $12B |
|
||
Price history
+491.7% since first listed10 events — show timeline
- 2026-06-13 Listed $100,000 LAAR
- 2025-11-13 Sold (MLS) $65,000 LAAR
- 2025-11-13 Sold (MLS) $65,000 GSMAR
- 2025-10-25 Pending — LAAR
- 2025-10-24 Pending — GSMAR
- 2025-10-09 Price Changed $75,000 LAAR
- 2025-10-09 Price Changed $75,000 GSMAR
- 2025-09-28 Listed $79,900 LAAR
- 2025-09-28 Listed $79,900 GSMAR
- 2009-09-30 Sold (Public Records) $16,900 Public Records
Property tax history
+14.3%/yrLatest (2025): $568 · +27.9% YoY. Source: county tax records.
Cash-flow waterfall
monthlySold comps — $/sqft
last 12 mo · ≤1 miLoading sold comps…