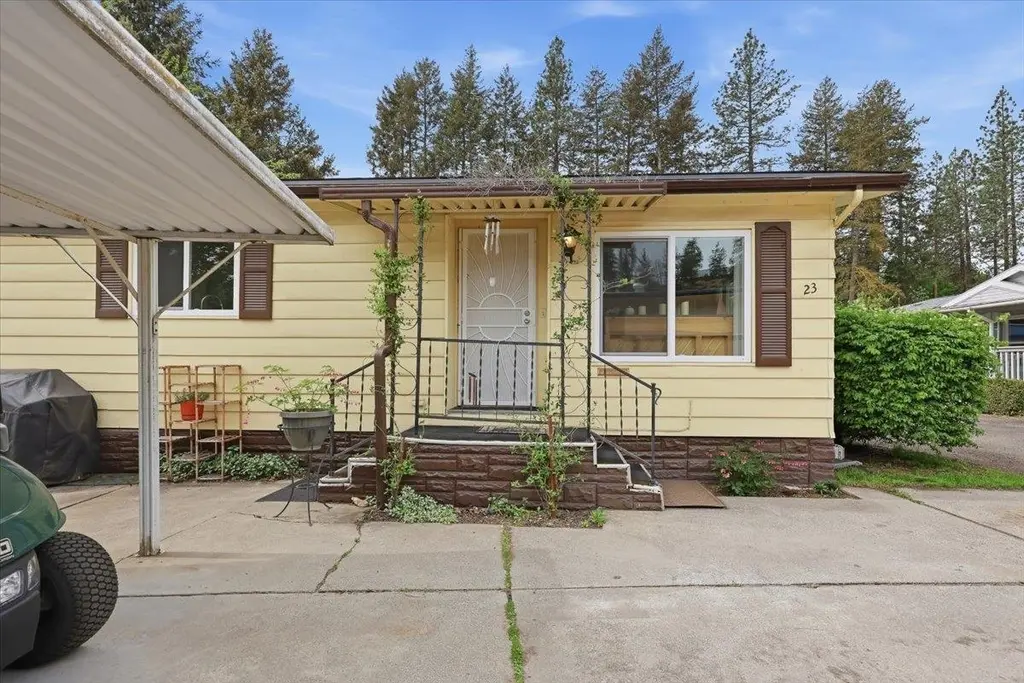
3231 W Boone Ave #23 · Spokane, WA
Flood risk 1/10 · Minimal
- FEMA flood zone
- X (unshaded)
- Chance of flooding over 30 yrs
- 0.0%
- Est. flood insurance / yr
- $507 – $1,088
Fire risk 5/10 · Moderate
- Est. fire insurance / yr
- $604 – $1,122
Heat risk 3/10 · Minor
- Hot days now (above 94°F)
- 7 days/yr
- Hot days in 30 yrs
- 15 days/yr
Wind risk 1/10 · Minimal
- Chance of severe wind over 30 yrs
- —
Air-quality risk 10/10 · Severe
- Unhealthy air days now
- 17 days/yr
- Unhealthy air days in 30 yrs
- 19 days/yr
Risk factors via First Street. Map © Google.
Why this score? — see what drove the B- grade
The composite is a weighted blend of 9 inputs, each scored 0–100. Each bar is that input's sub-score; the figure is the points it added to the 100-point composite (weight × sub-score).
- Cash flow +29.9/30.0
- DSCR +10.0/10.0
- 1% rule +7.8/10.0
- ARV discount +7.4/15.0
- Schools +4.6/10.0
- Livability +4.0/5.0
- Rent growth +3.1/5.0
- Condition / age +2.5/5.0
- Appreciation +0.0/10.0
$130,000
🖨 Deal sheet 📄 Offer letter ✓ Due diligence
Listing remarks
Welcome to the peaceful 55+ community of Sans Souci, where comfort and nature come together near the river. This well-maintained 2 bed, 2 bath home offers 1,148 sq ft of inviting living space with numerous updates already completed, including a new roof, new windows, new furnace, and new hot water tank for added peace of mind. The main bathroom features a convenient no-step shower for easy accessibility. Enjoy gardening year-round in the greenhouse, relax in the spacious yard, and take advantage of the extra storage shed and covered carport. Surrounded by scenic beauty and abundant wildlife, Sans Souci offers a quiet retreat while still being close to everyday conveniences. Move-in ready an
Key facts
- New furnace
- New hot water tank
- No-step shower
Tags
Property features AI
Finance
- Other: Living area reported as 1,148 (public records)
- Financial info: Tax amount reported (annual)
- HOA & community: Community features: None; Land lease: $588
Exterior
- Parking: Carport (1 space)
- Utilities: High-speed internet available (Comcast)
- Home design: Manufactured home; Single-story (manufactured house); Entry level information not specified; Facing direction not specified
- Construction: Siding exterior; Composition roof; Skirted foundation with tie-downs; Built as a manufactured house
- Exterior features: Views; Level lot; Private road frontage; Paved road frontage; Greenhouse on property; Other structures: see remarks
Interior
- Kitchen: Range, Dishwasher, Refrigerator
- Bedrooms: 2 bedrooms
- Heating & cooling: Natural gas heating
- Interior features: Range, Dishwasher, Refrigerator
Neighborhood map
What this means for you Summary
Snapshot
- This is a 3-bed/2.0-bath manufactured listed at $130k.
Deal economics
- At list price, monthly cash flow is $479 ($6k/yr) — positive.
- The deal already cash-flows at list — no discount required.
- Meets the 1% rule at list price ($2k rent vs $130k).
- Recommended offer: $128k (1.5% below list) — sets the bar for market timing.
- Cap rate 10.7% vs local median 3.2% in Spokane — top-decile yield for the area; either an underpriced asset or a hidden risk that comps aren't pricing in. Stress-test before assuming the spread holds.
Location & tenants
- Location reads 80/100 on livability (#93 in WA, #1,822 nationally) — a professional / high-income tenant draw. Strengths: amenities A+, commute A+, housing A+; Watch: crime F.
- Spokane School District (urban): math 47% / reading 58% proficiency, ranked #136 of 291 in WA (top 47%) — acceptable for families but not a draw, mixed tenant base, ~2y average lease.
- Zoned schools: Holmes Elementary (366 students, 86% FRL); North Central High School (1,674 students, 64% FRL) — zoned schools average 75% FRL vs 50% district-wide (25 pts higher); higher-poverty schools than district average — tighter screening recommended.
- Market conditions: Rents rising (+2.6%/yr); 124 active listings in the ZIP; 13 comparable units currently listed for rent nearby; rentals leasing fast (median 14d on market — plan ~1-2 weeks tenant-placement turnaround); lower-income renter base — watch delinquency; 3,608 units permitted in Spokane County in 2024 (1,792 in 5+ unit buildings).
- At $1,669/mo this rent would consume 49% of the median local household income ($41k/yr) (locally 1599% of renters already pay >50% of income on rent) — very limited rent-growth headroom before tenants either downsize or default.
Forward outlook
- Local home prices are declining (-3.0%/yr); year-one equity from $899 of loan paydown is wiped out by about $4k of value loss. Plan a longer hold.
- Spokane County population projected at +13% by 2050 — modest demand growth; plan on rents tracking national, not racing it.
- At projected returns (-3.0% appreciation + 2.6% rent growth), your $36k cash investment doubles in ~8 years — after that, you're playing with house money.
Negotiation context
- It's been on market 17 days — a 2% lower offer ($128k) is reasonable based on typical stale-listing flexibility.
- 2 sale attempts since 24y ago with the ask held roughly flat each time — persistent listings suggest the price (not the market) is what's stuck; bring a comps-based counter.
Risks & watch-outs
- Climate carrying-cost: moderate wildfire risk — expect insurance premiums to compound above CPI over the hold.
Questions for the listing agent
- Built in 1977 — when were the roof, HVAC, electrical panel, plumbing, and water heater last replaced?
- Is there a deadline driving the sale (1031 exchange, divorce, estate, relocation)? That informs how much negotiation room exists.
- Schools are B-rated — typically a magnet for longer-tenancy family renters. What's the average tenant stay here, and is there a school-zone premium baked into asking?
- Crime grade is F in this area — have there been break-ins, vandalism, or insurance claims at this property in the last 3 years? What carrier currently insures it and at what premium?
- What's the average days-on-market for RENTAL listings here right now (not sales)? A rising rental-DOM trend means longer vacancies and softer asking-rent achievability than the comps imply.
- What's the recent tenant-quality profile in this submarket — average credit score on applications, eviction rate, late-payment / NSF rate, and stable-employment percentage? A property-management company in the area should have these aggregated.
- How much new for-sale + rental construction is in the pipeline within 1–3 miles? Heavy new supply typically softens prices + rents 12–24 months out; constrained supply supports both.
Investment metrics
- 1% rule
- 1.28% ✓
- Cap rate
- 10.72%
- Cash-on-cash
- 15.81%
- DSCR
- 1.70
- GRM
- 6.5
CMA / ARV
- ARV (on-the-fly)
- $129,724
- Comps found
- 3
Show comp detail 3 sales within ~0.75 mi
| Address | Dist | Beds/Ba | Sqft | Sold | Price | $/sf | Match |
|---|---|---|---|---|---|---|---|
| 3231 W Boone Ave #825 | 0.13mi | 2/2.0 (-1) | 1,200 (+4%) | 11mo | $135,000 | $113 | 72 |
| 3231 W Boone Ave #21 | 0.01mi | 2/2.0 (-1) | 1,280 (+12%) | 11mo | $195,000 | $152 | 66 |
| 3231 W Boone Ave #833 | 0.14mi | 2/2.0 (-1) | 1,248 (+9%) | 19mo | $110,000 | $88 | 58 |
Match score weights: distance 35% · size 25% · config 20% · recency 20%. Top-matched comps best support the ARV.
Projected returns pro-forma
-3.0% appreciation · 2.59% rent growth · sell at horizon
- IRR
- 6.2%
- Equity multiple
- 1.24×
- Total profit
- $8,777
- Equity at exit
- $19,383
- IRR
- 15.2%
- Equity multiple
- 2.21×
- Total profit
- $44,131
- Equity at exit
- $11,240
Cash invested: $36,400 (down + closing). Projections, not guarantees.
Landlord ↔ Tenant lean methodology
- Overall (STATE)
- 28 Tenant-Leaning
- State Washington
- 28 Tenant-Leaning · D+8
- County
- — inherits STATE
- City
- — inherits STATE
ZIP-level market 99201
- Home prices YoY
- -26.3%
- Rents YoY
- 2.6%
- Active inventory
- 124
- Price-to-rent
- 6.5×
Monthly cashflow live
- Estimated rent
- $1,669 high interval (Pro) →
- Mortgage (P&I)
- −$682
- Tax from tax record
- −$103 /mo · $1,234/yr
- Insurance
- −$54
- HOA
- −$0
- Vacancy / Maint / Mgmt
- −$350
- Net cashflow
- $479
Break-even live
UW: 25.0% down · 7.5% · 30yr · 1.5% tax · 5.0% vac · 8.0% maint · 8.0% mgmt
Financing live
Cash to close
- Down payment
- $32,500
- Closing costs
- $3,900
- Reserves months
- —
- Total cash needed
- —
Loan-product check · same deal, 3 products live
Conventional
25% down · 7.5% · 30yr
- Down + closing
- —
- Monthly P&I
- —
- Monthly cashflow
- —
- DSCR
- —
- Eligible?
- —
Personal DTI + credit; lowest rate.
DSCR
20% down · 8.5% · 30yr
- Down + closing
- —
- Monthly P&I
- —
- Monthly cashflow
- —
- DSCR
- —
- Eligible?
- —
No personal income docs; deal must DSCR.
Hard money
10% down · 12.0% · 12mo
- Down + closing
- —
- Monthly P&I
- —
- Monthly cashflow
- —
- DSCR
- —
- Eligible?
- —
Short-term bridge; refi at stabilization.
Rent comps 13 comps
| Address | Beds | Baths | Sqft | Rent | $/sqft | DOM | Units | Dist |
|---|---|---|---|---|---|---|---|---|
| 3817 W Whistalks Way Unit 3103 Spokane, WA | 2.0 | 1.0 | 924 | $1,125 | $1.22 | 13d | 1 | 0.59mi |
| 2612 W Dean Ave Spokane, WA | 2.0 | 1.0 | 1181 | $2,400 | $2.03 | 13d | 1 | 0.61mi |
| 3915 W Randolph Rd Spokane, WA | 1.0–2.0 | 1.0–2.0 | 786 | $1,595 | $2.03 | 13d | 4 | 0.66mi |
| 3027 W Cleveland Ave Spokane, WA | 3.0 | 2.0 | 1100 | $2,500 | $2.27 | 13d | 1 | 0.70mi |
| 1605 N River Ridge Blvd Spokane, WA | 1.0–2.0 | 1.0–2.0 | 899 | $1,850 | $2.06 | 13d | 3 | 0.74mi |
| 1802 W Sharp Ave Spokane, WA | 2.0 | 1.0 | 895 | $1,195 | $1.34 | 23d | 1 | 0.92mi |
| 1611 W Augusta Ave Spokane, WA | 3.0 | 3.0 | 1477 | $1,995 | $1.35 | 23d | 1 | 0.98mi |
| 1718 W Boone Ave Unit 4 Spokane, WA | 2.0 | 1.0 | 780 | $1,250 | $1.60 | 13d | 1 | 0.98mi |
| 1515 W Sharp Ave Spokane, WA | 2.0 | 1.0 | 720 | $895 | $1.24 | 23d | 1 | 1.10mi |
| 2136 W Riverside Ave Spokane, WA | 2.0 | 1.0 | 590 | $1,300 | $2.20 | 13d | 9 | 1.25mi |
| 1318 W Mallon Ave Unit 302 Spokane, WA | 2.0 | 1.0 | 750 | $1,150 | $1.53 | 23d | 1 | 1.30mi |
| 1310 W College Ave Spokane, WA | 2.0 | 2.0 | 805 | $1,890 | $2.35 | 23d | 1 | 1.37mi |
| 2315 W 2nd Ave Spokane, WA | 1.0–2.0 | 1.0 | 669 | $1,399 | $2.09 | 23d | 2 | 1.44mi |
Listing history 3 events
-
2026-05-10$130,000 Active
-
2003-02-28historical
-
2002-09-01$27,500
ⓘ Source: listings_history table (triggers on properties + properties_extension) + one-shot
backfill from property_details.listing_events for pre-trigger history.
Tax reassessment forecast WA · Resets to sale price
- Current annual tax
- $1,234 · $103/mo
- Projected year-2 tax
- $1,274 · $106/mo
- Expected delta
- +$40/yr (+$3/mo · 3.3%)
ⓘ Screening estimate from a state-policy table — verify with the county assessor before closing.
Climate risk First Street
- Flood 1/10 Low FEMA zone X (unshaded) · 0% chance over 30 yrs
- Wildfire 5/10 Major
- Heat 3/10 Moderate 7 d/yr ≥94°F today · 15 d/yr by 30 yrs out
- Wind 1/10 Low
- Air quality 10/10 Extreme 17 unhealthy d/yr today · 19 by 30 yrs out
Nearby sold comps map
Loading sold comps map…
Walkable amenities ~0.75 mi
Loading nearby amenities…
Taxation est. · year 1
- Rental income
- $20,023
- − Mortgage interest
- −$7,282
- − Property taxes
- −$1,234
- − Insurance
- −$650
- − Repairs & maintenance
- −$1,602
- − Management
- −$1,602
- − Depreciation
- −$3,782
- Taxable income
- $3,872
- Est. tax owed @ 24.0%
- −$929
- After-tax cash flow
- $4,825/yr
For passive investors: Depreciation is non-cash, so a rental often shows a tax loss while cash-flowing — sheltering income. Rental losses are passive: they offset passive income freely, and up to $25,000/yr can offset ordinary (W-2) income if you actively participate and your MAGI is under $100k (phasing out to $0 by $150k); unused losses carry forward. On sale, claimed depreciation is recaptured at up to 25%, and gains may owe capital-gains tax (a 1031 exchange can defer both). Figures are a year-1 estimate at your 24.0% rate — not tax advice; consult a CPA.
Schools (NCES district)
- District
- Spokane School District
- NCES district ID
- 5308250
- Math proficiency
- 47% ▲ 1.00%
- Reading proficiency
- 58% ▲ 1.00%
- Median HH income
- $43,187
- Composite
- 46.1/100
- National rank
- #5477
- State rank
- #136 of 291 in WA
Livability — Spokane
- Score
- 80/100
- State rank
- #93
- US rank
- #1822
Category grades
Schools grade is shown separately in the Schools card above.
Census & demographics
- Census place
- Spokane, WA
- County
- Spokane County · 496,401 people
- City population
- 298,820
- Metro
- Spokane-Spokane Valley, WA
- Population (ZIP)
- 15,829
- Household income
- $41,171
- Rent vs Own
- Severe rent burden
- 1599.0
Population outlook (Spokane County) Hauer SSP2
- Today (2025)
- 531,314 people
- By 2030
- 549,278 · +3.4%
- By 2040
- 577,822 · +8.8%
- By 2050
- 598,188 · +12.6%
- By 2075
- 630,744 · +18.7%
- By 2100
- 622,360 · +17.1%
Race, ethnicity, and origin ACS 2023
- Neighborhood character
- Predominantly White (72%)
- Race & ethnicity
- White 72% Two or more races 13% Hispanic / Latino 9% Black 3% Asian 3% Native American 3%
- Hispanic origin (detail)
- Mexican 7% Puerto Rican 1%
- Common ancestry
- Portuguese 4% Lithuanian 4% Slovak 3%
- Foreign-born
- 4% · Canada
- Languages at home
- 92% English-only · Spanish 3% Arabic 1% Other Asian/Pacific 1%
Political lean MEDSL · Spokane
- 2024 margin
- Toss-up / Even · D 46.0% · R 51.0% · Other 3.0%
- 2008→2024 swing
- -3.8pp toward R · 2008: -1.1pp · 2024: -5.0pp
- All cycles
- 2024: R+5.0 2020: R+4.3 2016: R+8.3 2012: R+6.3 2008: R+1.1
Not yet ingested
- Civics
- —
Market trends
- HPI YoY
- ▼ -120.62%
- Current HPI
- 337.9835
- Rent YoY
- ▲ 2.59%
- Metro
- Spokane-Spokane Valley, WA
- State GDP YoY
- ▲ 4.65%
- F500 in state
- 22
Industry mix (Fortune 500 HQ in WA)
| Industry | F500 HQs | Revenue |
|---|---|---|
| Retail | 2 | $269B |
|
||
| Technology / Retail | 1 | $638B |
|
||
| Technology | 1 | $245B |
|
||
| Telecommunications | 1 | $38B |
|
||
| Food / Beverage | 1 | $36B |
|
||
| Automotive / Trucks | 1 | $34B |
|
||
Price history
+372.7% since first listed3 events — show timeline
- 2026-05-10 Listed $130,000 SPOKANEMLS as Distributed by MLS Grid
- 2003-02-28 Listing Removed — SPOKANEMLS as Distributed by MLS Grid
- 2002-09-01 Listed $27,500 SPOKANEMLS as Distributed by MLS Grid
Property tax history
+50.3%/yrLatest (2026): $1,234 · +24.3% YoY. Source: county tax records.
Cash-flow waterfall
monthlySold comps — $/sqft
last 12 mo · ≤1 miLoading sold comps…