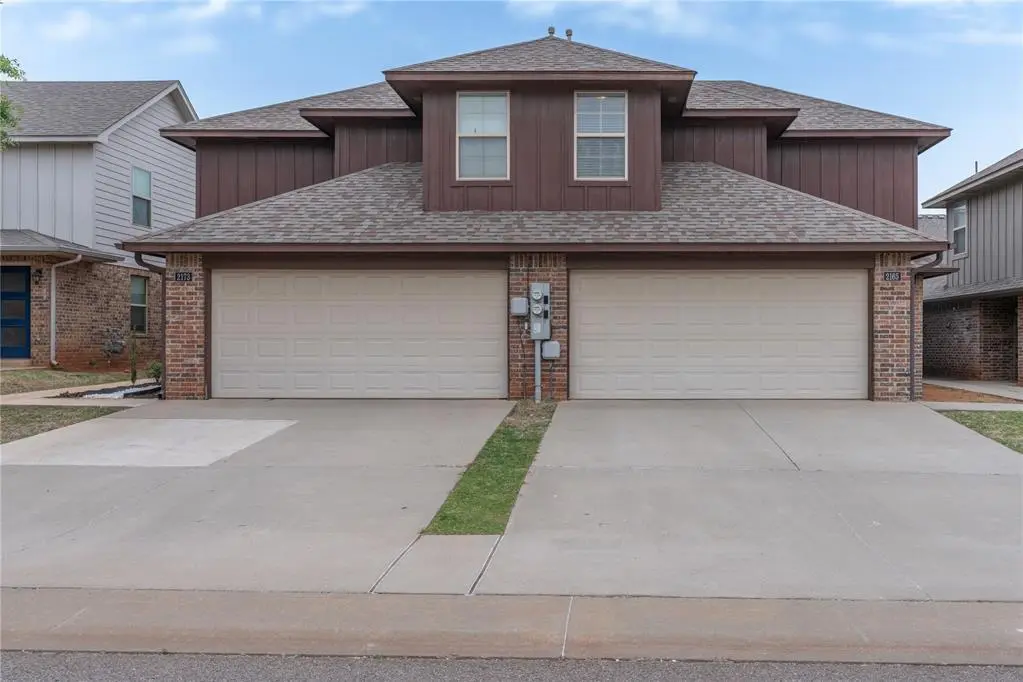
 Duplex
2165 Buena Vida Ln · Edmond, OK
Flood risk 1/10 · Minimal
- FEMA flood zone
- X (unshaded)
- Chance of flooding over 30 yrs
- 0.0%
- Est. flood insurance / yr
- $507 – $1,088
Fire risk 2/10 · Minimal
- Est. fire insurance / yr
- $2,463 – $4,575
Heat risk 6/10 · Moderate
- Hot days now (above 107°F)
- 7 days/yr
- Hot days in 30 yrs
- 20 days/yr
Wind risk 2/10 · Minimal
- Chance of severe wind over 30 yrs
- 3.0%
Air-quality risk 2/10 · Minimal
- Unhealthy air days now
- 2 days/yr
- Unhealthy air days in 30 yrs
- 2 days/yr
Risk factors via First Street. Map © Google.
Why this score? — see what drove the D grade
The composite is a weighted blend of 9 inputs, each scored 0–100. Each bar is that input's sub-score; the figure is the points it added to the 100-point composite (weight × sub-score).
- Cash flow +13.0/30.0
- ARV discount +7.5/15.0
- DSCR +3.9/10.0
- Livability +3.9/5.0
- Schools +3.6/10.0
- Rent growth +3.3/5.0
- 1% rule +2.6/10.0
- Condition / age +2.5/5.0
- Appreciation +0.0/10.0
$450,000
🖨 Deal sheet (PDF) 📄 Offer letter ✓ Due diligence
Multi-family units
County records classify this as Multi-Family (2-4 Unit). Listing-text estimate: 2 units. confirmed
Listing remarks
Discover modern living at its finest with this exceptional duplex opportunity in the sought-after Santa Fe Villas, located within the top-tier Edmond School District. These identical units both feature a spacious 3-bedroom, 2.5-bathroom layout with a completely open floor plan and contemporary paint colors throughout. The sleek kitchen is outfitted with granite countertops and ample storage, flowing seamlessly into the main living area. Designed for functionality, the primary suite is located on the main floor with a huge walk-in closet and full bath, while a half-bath downstairs serves guests perfectly. Two additional bedrooms and a second full bath are located upstairs. Enjoy a two-car ga
Key facts
- Open floor plan
- Walk-in closet
- Duplex opportunity
Tags
Property features AI
Finance
- Other: Located in Santa Fe Villas addition
- Financial info: Accepts Cash, Conventional, FHA, or VA financing
Exterior
- Home design: Duplex (residential income); Existing property
- Construction: Brick construction; Composition roof; Slab foundation
- Exterior features: Interior lot
Interior
- Bedrooms: 6 total bedrooms (combined across units)
- Bathrooms: 4 full bathrooms; 2 half bathrooms
- Interior features: Two-unit residential income property (duplex); Interior lot
Neighborhood map
What this means for you Summary
Snapshot
- This is a 2 × 3-bed/2.5-bath units multifamily listed at $450k.
Deal economics
- At list price, monthly cash flow is $-22 ($-269/yr) — negative. Per door: $-11/mo.
- To cash-flow at today's rent, offer at most $446k (0.9% below list).
- To meet the 1% rule (rent ≥ 1% of price), the offer needs to be $343k (23.7% below list).
- Recommended offer: $343k (23.7% below list) — sets the bar for 1% rule.
- Cap rate 6.2% vs local median 3.4% in Edmond — top-decile yield for the area; either an underpriced asset or a hidden risk that comps aren't pricing in. Stress-test before assuming the spread holds.
Location & tenants
- Location reads 78/100 on livability (#6 in OK, #2,383 nationally) — a middle-class / working-renter tenant base. Strengths: employment A+, housing A+, crime A-; Watch: health & safety C-, commute F.
- Edmond (suburban): math 38% / reading 40% proficiency, ranked #11 of 270 in OK (top 4%) — families likely to look elsewhere, expect single-tenant / working-renter base with shorter leases.
- Zoned schools: Sunset Es (math 18% / reading 18%, grade F, #534 of 845 statewide, top 64%, 670 students, 0% FRL); Central Ms (math 40% / reading 42%, grade F, #5 of 345 statewide, top 1%, 980 students, 0% FRL); Santa Fe Hs (math 36% / reading 52%, grade F, #18 of 447 statewide, top 4%, 2,796 students, 0% FRL) — zoned schools average 0% FRL vs 22% district-wide (22 pts lower); this property's tenant base skews higher-income than the district average.
- Market conditions: Rents rising (+3.1%/yr); 662 active listings in the ZIP; 30 comparable units currently listed for rent nearby; rentals leasing fast (median 14d on market — plan ~1-2 weeks tenant-placement turnaround); high-income renter base; 5,365 units permitted in Oklahoma County in 2024 (569 in 5+ unit buildings).
- This rent runs 36% of the median local income ($114k/yr) — at the standard rent-burdened threshold; future hikes will face affordability resistance.
Forward outlook
- Local home prices are declining (-3.0%/yr); year-one equity from $3k of loan paydown is wiped out by about $14k of value loss. Plan a longer hold.
- Oklahoma County population projected at +41% by 2050 — long-run rental-demand tailwind backs the buy-and-hold thesis.
Negotiation context
- It's been on market 41 days — a 3% lower offer ($436k) is reasonable based on typical stale-listing flexibility.
Risks & watch-outs
- Climate carrying-cost: extreme-heat days projected 7→20/yr by 2055 (HVAC capex compounding) — expect insurance premiums to compound above CPI over the hold.
Questions for the listing agent
- What do current leases actually rent for vs. the listed asking? Can we see a recent rent roll and the last 12 months of T-12 income?
- It's been on market 41 days. Have you received any prior offers? Is the seller open to a 24% concession, seller financing, or rate buy-down credit?
- Can we see the unit-by-unit rent roll, current vacancy, and any below-market leases? What's the average tenancy length?
- What capital expenditures (roof, boiler, parking lot, exteriors) have been made in the last 5 years, and what's planned in the next 2?
- Is there a deadline driving the sale (1031 exchange, divorce, estate, relocation)? That informs how much negotiation room exists.
- Schools are A-rated — typically a magnet for longer-tenancy family renters. What's the average tenant stay here, and is there a school-zone premium baked into asking?
- The area grade is low — what's the realistic commute time and amenity access for the typical tenant pool here? Any planned neighborhood developments (good or bad) we should know about?
- What's the average days-on-market for RENTAL listings here right now (not sales)? A rising rental-DOM trend means longer vacancies and softer asking-rent achievability than the comps imply.
- What's the recent tenant-quality profile in this submarket — average credit score on applications, eviction rate, late-payment / NSF rate, and stable-employment percentage? A property-management company in the area should have these aggregated.
- How much new apartment / multifamily construction is in the pipeline within 1–3 miles? Heavy new supply (>2% of stock underway) typically softens rents 12–24 months out; light construction supports rent growth.
Investment metrics
- 1% rule
- 0.76% ✗
- Cap rate
- 6.23%
- Cash-on-cash
- -0.21%
- DSCR
- 0.99
- GRM
- 10.9
CMA / ARV
No comps found within radius.
Projected returns pro-forma
-3.0% appreciation · 3.14% rent growth · sell at horizon
- IRR
- -16.6%
- Equity multiple
- 0.41×
- Total profit
- $-74,042
- Equity at exit
- $67,096
- IRR
- -8.2%
- Equity multiple
- 0.48×
- Total profit
- $-65,048
- Equity at exit
- $38,908
Cash invested: $126,000 (down + closing). Projections, not guarantees.
Landlord ↔ Tenant lean methodology
- Overall (STATE)
- 83 Strongly Landlord-Friendly
- State Oklahoma
- 83 Strongly Landlord-Friendly · R+20
- County
- — inherits STATE
- City
- — inherits STATE
ZIP-level market 73013
- Rents YoY
- 3.1%
- Active inventory
- 662
- Price-to-rent
- 21.9×
Monthly cashflow live
- Estimated rent
- $3,432 medium interval (Pro) →
- Mortgage (P&I)
- −$2,360
- Tax from tax record
- −$186 /mo · $2,236/yr
- Insurance
- −$188
- HOA
- −$0
- Vacancy / Maint / Mgmt
- −$721
- Net cashflow
- $-22
Break-even live
Sensitivity live
| Price | -10% $232 | -5% $105 | +0% $-22 | +5% $-150 | +10% $-277 |
|---|---|---|---|---|---|
| Rent | -10% $-294 | -5% $-158 | +0% $-22 | +5% $113 | +10% $249 |
| Rate | -1.0pp $204 | -0.5pp $92 | base $-22 | +0.5pp $-139 | +1.0pp $-258 |
2-unit breakdown (identical units grouped — click to expand)
| Units | Beds | Baths | Est. rent |
|---|---|---|---|
| 2× units | 3 | 2.5 | $3,432 |
| #1 | 3 | 2.5 | $1,716 |
| #2 | 3 | 2.5 | $1,716 |
| Total (2 units) | $3,432 | ||
UW: 25.0% down · 7.5% · 30yr · 1.5% tax · 5.0% vac · 8.0% maint · 8.0% mgmt
Financing live
Cash to close
- Down payment
- $112,500
- Closing costs
- $13,500
- Reserves months
- —
- Total cash needed
- —
Loan-product check · same deal, 3 products live
Conventional
25% down · 7.5% · 30yr
- Down + closing
- —
- Monthly P&I
- —
- Monthly cashflow
- —
- DSCR
- —
- Eligible?
- —
Personal DTI + credit; lowest rate.
DSCR
20% down · 8.5% · 30yr
- Down + closing
- —
- Monthly P&I
- —
- Monthly cashflow
- —
- DSCR
- —
- Eligible?
- —
No personal income docs; deal must DSCR.
Hard money
10% down · 12.0% · 12mo
- Down + closing
- —
- Monthly P&I
- —
- Monthly cashflow
- —
- DSCR
- —
- Eligible?
- —
Short-term bridge; refi at stabilization.
Rent comps 30 comps
| Address | Beds | Baths | Sqft | Rent | $/sqft | DOM | Units | Dist |
|---|---|---|---|---|---|---|---|---|
| 2149 Buena Vida Ln Edmond, OK | 3.0 | 2.5 | 1300 | $1,645 | $1.27 | 3d | 1 | 0.01mi |
| 2125 Buena Vida Ln Edmond, OK | 3.0 | 2.5 | 1458 | $1,699 | $1.17 | 3d | 1 | 0.02mi |
| 2172 Camino del Plaza Ln Edmond, OK | 3.0 | 2.0 | 1287 | $1,600 | $1.24 | 5d | 1 | 0.03mi |
| 2172 Camino del Plaza Ln Edmond, OK | 3.0 | 2.0 | 1274 | $1,600 | $1.26 | 25d | 1 | 0.03mi |
| 2116 Camino del Plaza Ln Edmond, OK | 3.0 | 2.0 | 1396 | $1,645 | $1.18 | 25d | 1 | 0.03mi |
| 2108 Buena Vida Ln Edmond, OK | 3.0 | 2.5 | 1357 | $1,640 | $1.21 | 25d | 1 | 0.04mi |
| 2013 Vanishing Trl Edmond, OK | 3.0 | 2.0 | 1555 | $1,705 | $1.10 | 16d | 1 | 0.14mi |
| 1909 Fountain Vw Edmond, OK | 3.0 | 2.0 | 1506 | $1,999 | $1.33 | 3d | 1 | 0.24mi |
| 16420 Del Mar Dr Edmond, OK | 3.0 | 2.0 | 1404 | $1,741 | $1.24 | 13d | 1 | 0.33mi |
| 13 NW 156th St Edmond, OK | 3.0 | 2.0 | 1746 | $2,200 | $1.26 | 25d | 1 | 0.35mi |
| 1318 Pennington Ave Edmond, OK | 2.0 | 2.0 | 1150 | $1,300 | $1.13 | 25d | 1 | 0.37mi |
| 1404 S Gemini Rd Edmond, OK | 3.0 | 2.0 | 1267 | $1,650 | $1.30 | 25d | 1 | 0.52mi |
| 1404 S Gemini Rd Edmond, OK | 3.0 | 2.0 | 1267 | $1,650 | $1.30 | 23d | 1 | 0.52mi |
| 1113 Countrywood Ln Edmond, OK | 3.0 | 2.0 | 1606 | $1,785 | $1.11 | 5d | 1 | 0.75mi |
| 2501 Kelley Pointe Pkwy Edmond, OK | 1.0–2.0 | 1.0–2.0 | 909 | $1,979 | $2.18 | 3d | 18 | 0.77mi |
| 804 Stag Trl Edmond, OK | 3.0 | 2.0 | 1250 | $1,550 | $1.24 | 5d | 1 | 0.83mi |
| 804 Stag Trl Edmond, OK | 3.0 | 2.0 | 1250 | $1,550 | $1.24 | 25d | 1 | 0.83mi |
| 1504 Apollo Rd Edmond, OK | 3.0 | 2.0 | 1435 | $1,475 | $1.03 | 13d | 1 | 0.83mi |
| 1013 Kelly Park Rd Edmond, OK | 4.0 | 2.0 | 1450 | $1,550 | $1.07 | 3d | 1 | 0.86mi |
| 913 Rolling Hills Ter Edmond, OK | 3.0 | 2.0 | 1829 | $1,895 | $1.04 | 5d | 1 | 0.97mi |
| 525 NW 171st St Edmond, OK | 3.0 | 2.0 | 1607 | $1,900 | $1.18 | 3d | 1 | 1.02mi |
| 16108 N Western Ave Edmond, OK | 3.0–4.0 | 2.5 | 1700 | $1,598 | $0.94 | 5d | 6 | 1.08mi |
| 1018 NW 166th Ter Edmond, OK | 3.0 | 2.0 | 1835 | $1,650 | $0.90 | 25d | 1 | 1.08mi |
| 17116 Sunny Hollow Rd Edmond, OK | 4.0 | 2.5 | 1690 | $2,100 | $1.24 | 3d | 1 | 1.09mi |
| 808 Mars Cir Unit 1 Edmond, OK | 3.0 | 1.0 | 1401 | $1,375 | $0.98 | 21d | 1 | 1.12mi |
| 1037 NW 166th St Edmond, OK | 3.0 | 2.0 | 1630 | $1,595 | $0.98 | 25d | 1 | 1.12mi |
| 1037 NW 166th St Edmond, OK | 3.0 | 2.0 | 1600 | $1,595 | $1.00 | 5d | 1 | 1.12mi |
| 17115 Cedar Dr Edmond, OK | 2.0 | 2.0 | 1563 | $1,495 | $0.96 | 13d | 1 | 1.28mi |
| 17629 Nantucket Ave Edmond, OK | 3.0 | 2.0 | 1632 | $1,925 | $1.18 | 3d | 1 | 1.30mi |
| 1005 Valley Ct Edmond, OK | 3.0 | 2.0 | 1455 | $1,795 | $1.23 | 25d | 1 | 1.31mi |
Listing history 14 events
-
2026-06-21days on market $450,000 Active 41 DOM
-
2026-06-18days on market $450,000 Active 38 DOM
-
2026-06-17days on market $450,000 Active 37 DOM
-
2026-06-16days on market $450,000 Active 36 DOM
-
2026-06-15days on market $450,000 Active 35 DOM
-
2026-06-13pricedays on market $450,000 Active 33 DOM
-
2026-06-09days on market $470,000 Active 29 DOM
-
2026-06-08days on market $470,000 Active 28 DOM
-
2026-06-07days on market $470,000 Active 27 DOM
-
2026-06-03days on market $470,000 Active 23 DOM
-
2026-06-02days on market $470,000 Active 22 DOM
-
2026-06-01days on market $470,000 Active 21 DOM
-
2026-05-31days on market $470,000 Active 20 DOM
-
2026-05-11$470,000 Active
ⓘ Source: listings_history table (triggers on properties + properties_extension) + one-shot
backfill from property_details.listing_events for pre-trigger history.
Tax reassessment forecast OK · Resets to sale price
- Current annual tax
- $2,236 · $186/mo
- Projected year-2 tax
- $4,050 · $337/mo
- Expected delta
- +$1,814/yr (+$151/mo · 81.1%)
ⓘ Screening estimate from a state-policy table — verify with the county assessor before closing.
Climate risk First Street
- Flood 1/10 Low FEMA zone X (unshaded) · 0% chance over 30 yrs
- Wildfire 2/10 Low
- Heat 6/10 Major 7 d/yr ≥107°F today · 20 d/yr by 30 yrs out
- Wind 2/10 Low 3% chance of damaging wind over 30 yrs
- Air quality 2/10 Low 2 unhealthy d/yr today · 2 by 30 yrs out
Nearby sold comps map
Loading sold comps map…
Walkable amenities ~0.75 mi
Loading nearby amenities…
Taxation est. · year 1
- Rental income
- $41,184
- − Mortgage interest
- −$25,207
- − Property taxes
- −$2,236
- − Insurance
- −$2,250
- − Repairs & maintenance
- −$3,295
- − Management
- −$3,295
- − Depreciation
- −$13,091
- Taxable loss
- −$8,189
- Est. tax savings @ 24.0%
- +$1,965
- After-tax cash flow
- $1,697/yr
For passive investors: Depreciation is non-cash, so a rental often shows a tax loss while cash-flowing — sheltering income. Rental losses are passive: they offset passive income freely, and up to $25,000/yr can offset ordinary (W-2) income if you actively participate and your MAGI is under $100k (phasing out to $0 by $150k); unused losses carry forward. On sale, claimed depreciation is recaptured at up to 25%, and gains may owe capital-gains tax (a 1031 exchange can defer both). Figures are a year-1 estimate at your 24.0% rate — not tax advice; consult a CPA.
Schools (NCES district)
- District
- Edmond
- NCES district ID
- 4010590
- Math proficiency
- 38% ▼ -12.00%
- Reading proficiency
- 40% ▼ -12.00%
- Median HH income
- $73,212
- Composite
- 35.88/100
- National rank
- #4814
- State rank
- #11 of 270 in OK
Livability — Edmond
- Score
- 78/100
- State rank
- #6
- US rank
- #2383
Category grades
Schools grade is shown separately in the Schools card above.
Census & demographics
- Census place
- Edmond, OK
- County
- Oklahoma County · 771,644 people
- City population
- 177,083
- Metro
- Oklahoma City, OK
- Population (ZIP)
- 58,023
- Household income
- $113,870
- Rent vs Own
- Severe rent burden
- 1313.0
Population outlook (Oklahoma County) Hauer SSP2
- Today (2025)
- 911,875 people
- By 2030
- 982,413 · +7.7%
- By 2040
- 1,130,468 · +24.0%
- By 2050
- 1,288,422 · +41.3%
- By 2075
- 1,711,482 · +87.7%
- By 2100
- 2,088,448 · +129.0%
Race, ethnicity, and origin ACS 2023
- Neighborhood character
- Predominantly White (67%)
- Race & ethnicity
- White 67% Two or more races 11% Black 9% Asian 7% Hispanic / Latino 5% Native American 2%
- Hispanic origin (detail)
- Mexican 2%
- Common ancestry
- Slovak 3% Italian 2% Lithuanian 2%
- Foreign-born
- 7% · Canada, Vietnam
- Languages at home
- 91% English-only · Other Indo-European 3% Spanish 2% Vietnamese 1%
Political lean MEDSL · Oklahoma
- 2024 margin
- Toss-up / Even · D 48.0% · R 49.7% · Other 2.3%
- 2008→2024 swing
- +15.1pp toward D · 2008: -16.8pp · 2024: -1.7pp
- All cycles
- 2024: R+1.7 2020: R+1.1 2016: R+10.5 2012: R+16.7 2008: R+16.8
Not yet ingested
- Civics
- —
Market trends
- HPI YoY
- ▼ -201.41%
- Current HPI
- 214.2251
- Rent YoY
- ▲ 3.14%
- Metro
- Oklahoma City, OK
- State GDP YoY
- ▲ 1.55%
- F500 in state
- 6
Industry mix (Fortune 500 HQ in OK)
| Industry | F500 HQs | Revenue |
|---|---|---|
| Energy | 3 | $48B |
|
||
Price history
1 event — show timeline
- 2026-05-11 Listed $470,000 MLSOK
Property tax history
+45.9%/yrLatest (2025): $2,236 · +5.1% YoY. Source: county tax records.
Cash-flow waterfall
monthlySold comps — $/sqft
last 12 mo · ≤1 miLoading sold comps…