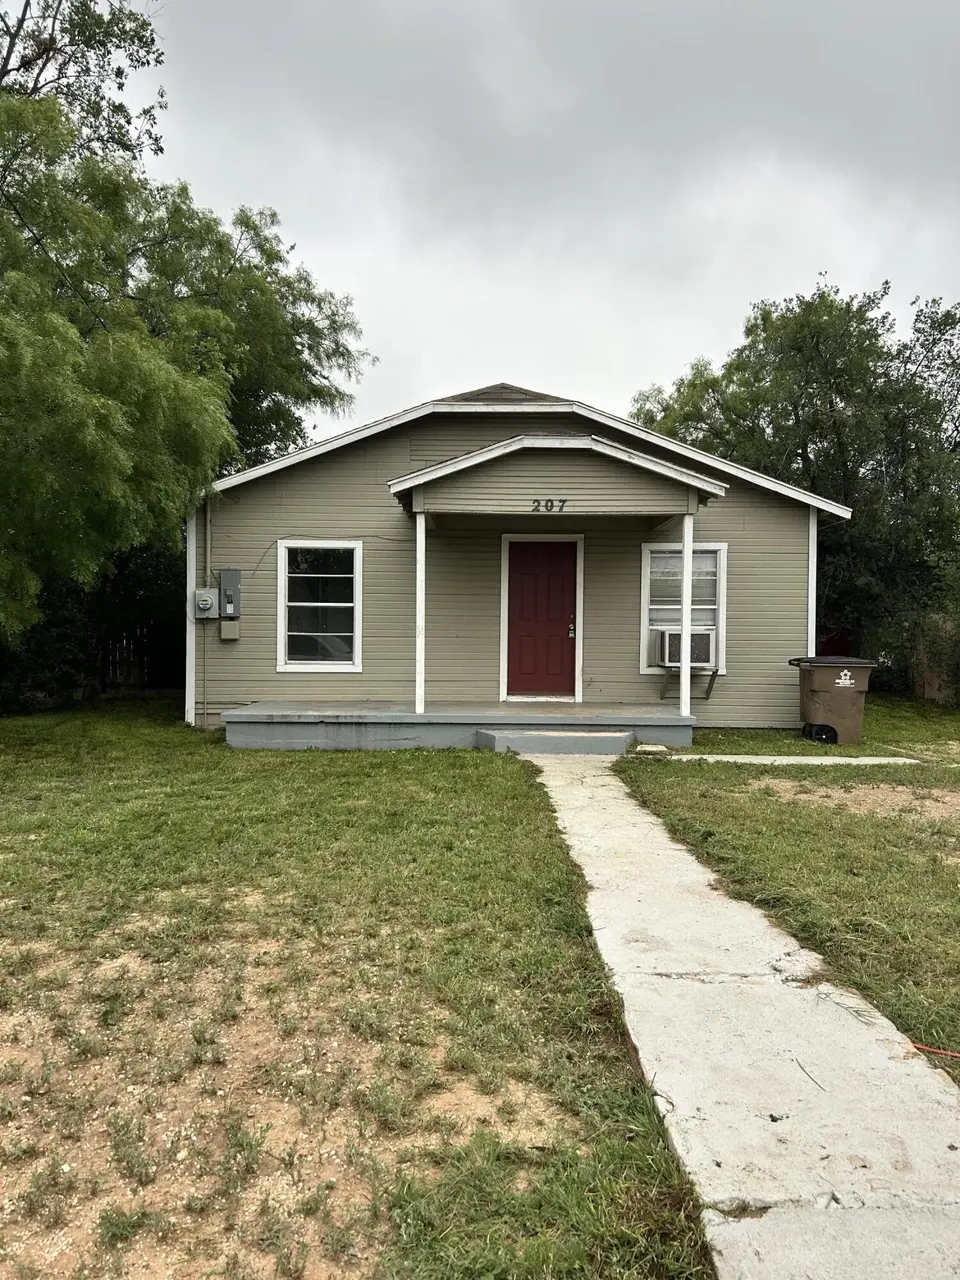
207 W 25th St · San Angelo, TX
Flood risk 1/10 · Minimal
- FEMA flood zone
- X (unshaded)
- Chance of flooding over 30 yrs
- 0.0%
- Est. flood insurance / yr
- $507 – $1,088
Fire risk 6/10 · Moderate
- Est. fire insurance / yr
- $1,222 – $2,270
Heat risk 7/10 · Major
- Hot days now (above 104°F)
- 7 days/yr
- Hot days in 30 yrs
- 23 days/yr
Wind risk 4/10 · Minor
- Chance of severe wind over 30 yrs
- 13.0%
Air-quality risk 1/10 · Minimal
- Unhealthy air days now
- 0 days/yr
- Unhealthy air days in 30 yrs
- 0 days/yr
Risk factors via First Street. Map © Google.
Why this score? — see what drove the C+ grade
The composite is a weighted blend of 9 inputs, each scored 0–100. Each bar is that input's sub-score; the figure is the points it added to the 100-point composite (weight × sub-score).
- Cash flow +21.3/30.0
- ARV discount +15.0/15.0
- DSCR +6.8/10.0
- 1% rule +6.5/10.0
- Rent growth +4.6/5.0
- Livability +3.7/5.0
- Schools +2.6/10.0
- Condition / age +2.5/5.0
- Appreciation +0.0/10.0
$98,500
🖨 Deal sheet 📄 Offer letter ✓ Due diligence
Listing remarks MLS
This bulk Property Package Portfolio features 15 residential properties located throughout San Angelo, TX. The portfolio offers affordable single-family homes ideal for investors seeking rental income, fix-and-flip opportunities, or long-term appreciation in a growing West Texas market. This portfolio Opportunity can also be split into two separate portfolios for investors seeking more targeted acquisitions. Ideal for investors seeking scale and long-term growth in a thriving market. Special Financing Incentive Available to Qualified Investors DO NOT DISTURB ANY TENANTS
Key facts
- Outdoor entertaining
- Large backyard
- Close to shopping
Tags
Neighborhood map
What this means for you Summary
Snapshot
- This is a 2-bed/1.0-bath single-family listed at $98k.
Deal economics
- At list price, monthly cash flow is $144 ($2k/yr) — positive.
- The deal already cash-flows at list — no discount required.
- Meets the 1% rule at list price ($1k rent vs $98k).
- Recommended offer: $97k (1.5% below list) — sets the bar for market timing.
- Cap rate 8.1% vs local median 3.8% in San Angelo — top-decile yield for the area; either an underpriced asset or a hidden risk that comps aren't pricing in. Stress-test before assuming the spread holds.
Location & tenants
- Location reads 73/100 on livability (#199 in TX) — a middle-class / working-renter tenant base. Strengths: cost of living A+, housing A+, health & safety A+; Watch: employment C-, schools F, amenities F.
- San Angelo ISD (urban): math 27% / reading 33% proficiency, ranked #627 of 826 in TX (top 76%) — families likely to look elsewhere, expect single-tenant / working-renter base with shorter leases.
- Market conditions: Rents rising fast (+8.5%/yr); 227 active listings in the ZIP; 17 comparable units currently listed for rent nearby; rentals at typical pace (median 21d on market — plan ~3-4 weeks tenant-placement turnaround); 41% of comp listings sitting > 30 days — soft ceiling on asking rent; 233 units permitted in Tom Green County in 2024 (0 in 5+ unit buildings).
Forward outlook
- Local home prices are declining (-3.0%/yr); year-one equity from $681 of loan paydown is wiped out by about $3k of value loss. Plan a longer hold.
- Tom Green County population projected at +35% by 2050 — long-run rental-demand tailwind backs the buy-and-hold thesis.
- At projected returns (-3.0% appreciation + 8.0% rent growth), your $28k cash investment doubles in ~9 years — after that, you're playing with house money.
Negotiation context
- It's been on market 19 days — a 2% lower offer ($97k) is reasonable based on typical stale-listing flexibility.
Risks & watch-outs
- Watch-outs: built in 1959 — expect roof / HVAC / electrical / plumbing capex.
- Climate carrying-cost: major wildfire risk; extreme-heat days projected 7→23/yr by 2055 (HVAC capex compounding) — expect insurance premiums to compound above CPI over the hold.
Questions for the listing agent
- Built in 1959 — when were the roof, HVAC, electrical panel, plumbing, and water heater last replaced?
- Is there a deadline driving the sale (1031 exchange, divorce, estate, relocation)? That informs how much negotiation room exists.
- Schools are F-rated, which usually means shorter tenancies and higher turnover. Who's the typical renter profile here, and what's been the actual vacancy rate?
- What's the average days-on-market for RENTAL listings here right now (not sales)? A rising rental-DOM trend means longer vacancies and softer asking-rent achievability than the comps imply.
- What's the recent tenant-quality profile in this submarket — average credit score on applications, eviction rate, late-payment / NSF rate, and stable-employment percentage? A property-management company in the area should have these aggregated.
- How much new for-sale + rental construction is in the pipeline within 1–3 miles? Heavy new supply typically softens prices + rents 12–24 months out; constrained supply supports both.
Investment metrics
- 1% rule
- 1.15% ✓
- Cap rate
- 8.05%
- Cash-on-cash
- 6.28%
- DSCR
- 1.28
- GRM
- 7.2
CMA / ARV
- ARV (median comp)
- $125,880
- List price
- $98,500
- Delta
- 1121.80%
- Verdict
- OVERPRICED
- Comps
- 20 within 1.0 mi
Show comp detail 10 sales within ~0.75 mi
| Address | Dist | Beds/Ba | Sqft | Sold | Price | $/sf | Match |
|---|---|---|---|---|---|---|---|
| 24 W 25th St | 0.15mi | 2/1.0 | 840 (0%) | 5mo | $114,000 | $136 | 89 |
| 101 W 22nd St | 0.24mi | 2/1.0 | 840 (0%) | 17mo | $64,000 | $76 | 75 |
| 22 W 20th St | 0.38mi | 2/1.0 | 856 (+2%) | 14mo | $57,650 | $67 | 68 |
| 2808 N Farr St | 0.26mi | 2/1.0 | 856 (+2%) | 21mo | $129,900 | $152 | 67 |
| 2103 Brown St | 0.46mi | 2/1.0 | 840 (0%) | 14mo | $129,999 | $155 | 66 |
| 56 E 32nd St | 0.72mi | 2/1.0 | 840 (0%) | 4mo | $90,000 | $107 | 64 |
| 2002 N Oakes St | 0.56mi | 2/1.0 | 798 (-5%) | 4mo | $40,000 | $50 | 63 |
| 15 E 24th St | 0.26mi | 2/1.5 | 945 (+12%) | 8mo | $130,000 | $138 | 58 |
| 724 W 17th St | 0.74mi | 2/1.0 | 888 (+6%) | 11mo | $95,000 | $107 | 47 |
| 326 E 26th St | 0.67mi | 2/2.0 | 928 (+10%) | 20mo | $145,000 | $156 | 31 |
Match score weights: distance 35% · size 25% · config 20% · recency 20%. Top-matched comps best support the ARV.
Projected returns pro-forma
-3.0% appreciation · 8.0% rent growth · sell at horizon
- IRR
- -0.7%
- Equity multiple
- 0.97×
- Total profit
- $-720
- Equity at exit
- $14,687
- IRR
- 14.0%
- Equity multiple
- 2.40×
- Total profit
- $38,727
- Equity at exit
- $8,516
Cash invested: $27,580 (down + closing). Projections, not guarantees.
Landlord ↔ Tenant lean methodology
- Overall (STATE)
- 87 Strongly Landlord-Friendly
- State Texas
- 87 Strongly Landlord-Friendly · R+5
- County
- — inherits STATE
- City
- — inherits STATE
ZIP-level market 76903
- Rents YoY
- 8.5%
- Active inventory
- 227
- Price-to-rent
- 7.2×
Monthly cashflow live
- Estimated rent
- $1,134 high interval (Pro) →
- Mortgage (P&I)
- −$517
- Tax from tax record
- −$194 /mo · $2,329/yr
- Insurance
- −$41
- HOA
- −$0
- Vacancy / Maint / Mgmt
- −$238
- Net cashflow
- $144
Break-even live
UW: 25.0% down · 7.5% · 30yr · 1.5% tax · 5.0% vac · 8.0% maint · 8.0% mgmt
Financing live
Cash to close
- Down payment
- $24,625
- Closing costs
- $2,955
- Reserves months
- —
- Total cash needed
- —
Loan-product check · same deal, 3 products live
Conventional
25% down · 7.5% · 30yr
- Down + closing
- —
- Monthly P&I
- —
- Monthly cashflow
- —
- DSCR
- —
- Eligible?
- —
Personal DTI + credit; lowest rate.
DSCR
20% down · 8.5% · 30yr
- Down + closing
- —
- Monthly P&I
- —
- Monthly cashflow
- —
- DSCR
- —
- Eligible?
- —
No personal income docs; deal must DSCR.
Hard money
10% down · 12.0% · 12mo
- Down + closing
- —
- Monthly P&I
- —
- Monthly cashflow
- —
- DSCR
- —
- Eligible?
- —
Short-term bridge; refi at stabilization.
Rent comps 17 comps
| Address | Beds | Baths | Sqft | Rent | $/sqft | DOM | Units | Dist |
|---|---|---|---|---|---|---|---|---|
| 810 W 19th St San Angelo, TX | 3.0 | 2.0 | 1090 | $1,249 | $1.15 | 20d | 1 | 0.69mi |
| 540 W 16th St San Angelo, TX | 3.0 | 2.0 | 1090 | $1,364 | $1.25 | 43d | 1 | 0.73mi |
| 2417 Oaklawn Blvd San Angelo, TX | 2.0 | 2.0 | 897 | $1,550 | $1.73 | 43d | 1 | 0.74mi |
| 504 E 17th St San Angelo, TX | 1.0 | 1.0 | 810 | $875 | $1.08 | 43d | 1 | 0.87mi |
| 3302 N Bryant Blvd San Angelo, TX | 3.0 | 1.0 | 559 | $850 | $1.52 | 20d | 1 | 0.89mi |
| 3310 N Bryant Blvd San Angelo, TX | 2.0 | 1.0 | 610 | $750 | $1.23 | 20d | 1 | 0.98mi |
| 510 E 28th St San Angelo, TX | 3.0 | 1.5 | 924 | $1,102 | $1.19 | 20d | 1 | 0.98mi |
| 939 LBJ Dr San Angelo, TX | 3.0 | 1.5 | 924 | $1,102 | $1.19 | 20d | 1 | 1.04mi |
| 2917 JFK Dr San Angelo, TX | 3.0 | 1.5 | 924 | $1,102 | $1.19 | 20d | 1 | 1.05mi |
| 2921 JFK Dr San Angelo, TX | 3.0 | 1.5 | 924 | $1,102 | $1.19 | 20d | 1 | 1.06mi |
| 940 LBJ Dr San Angelo, TX | 3.0 | 1.5 | 924 | $1,102 | $1.19 | 20d | 1 | 1.06mi |
| 134 E 11th St San Angelo, TX | 3.0 | 2.0 | 872 | $1,025 | $1.18 | 43d | 1 | 1.13mi |
| 1717 Greenwood St San Angelo, TX | 1.0 | 1.0 | 754 | $625 | $0.83 | 20d | 1 | 1.17mi |
| 902 Shiloh St Unit RE-908-16 San Angelo, TX | 2.0 | 1.0 | 875 | $1,125 | $1.29 | 43d | 1 | 1.34mi |
| 902 Shiloh St Unit RE-908-C San Angelo, TX | 2.0 | 1.5 | 925 | $1,175 | $1.27 | 43d | 1 | 1.34mi |
| 902 Shiloh St Unit RE-908-20 San Angelo, TX | 1.0 | 1.0 | 800 | $1,025 | $1.28 | 43d | 1 | 1.34mi |
| 1929 Raney St San Angelo, TX | 1.0–2.0 | 1.0–2.0 | 765 | $1,000 | $1.31 | 20d | 4 | 1.47mi |
Listing history 19 events
-
2026-06-19days on market $98,500 Active 19 DOM
-
2026-06-18days on market $98,500 Active 18 DOM
-
2026-06-17days on market $98,500 Active 17 DOM
-
2026-06-16days on market $98,500 Active 16 DOM
-
2026-06-15days on market $98,500 Active 15 DOM
-
2026-06-14days on market $98,500 Active 13 DOM
-
2026-06-13days on market $98,500 Active 12 DOM
-
2026-06-10days on market $98,500 Active 10 DOM
-
2026-06-09days on market $98,500 Active 9 DOM
-
2026-06-08days on market $98,500 Active 8 DOM
-
2026-06-07days on market $98,500 Active 7 DOM
-
2026-06-02days on market $98,500 Active 2 DOM
-
2026-06-01pricedays on market $98,500 Active 1 DOM
-
2026-05-31days on market $1,538,000 Active 75 DOM
-
2026-05-30days on market $1,538,000 Active 74 DOM
-
2026-03-11$1,538,000 Active 581-char remark
Show marketing remark (581 chars)
This bulk Property Package Portfolio features 15 residential properties located throughout San Angelo, TX. The portfolio offers affordable single-family homes ideal for investors seeking rental income, fix-and-flip opportunities, or long-term appreciation in a growing West Texas market. This portfolio Opportunity can also be split into two separate portfolios for investors seeking more targeted acquisitions. Ideal for investors seeking scale and long-term growth in a thriving market. Special Financing Incentive Available to Qualified Investors DO NOT DISTURB ANY TENANTS
-
2018-02-26soldstatus
-
2017-01-19soldstatus
-
2006-06-15soldstatus
ⓘ Source: listings_history table (triggers on properties + properties_extension) + one-shot
backfill from property_details.listing_events for pre-trigger history.
Tax reassessment forecast TX · Resets to sale price
- Current annual tax
- $2,329 · $194/mo
- Projected year-2 tax
- $2,329 · $194/mo
- Expected delta
- $0/yr ($0/mo · 0.0%)
ⓘ Screening estimate from a state-policy table — verify with the county assessor before closing.
Climate risk First Street
- Flood 1/10 Low FEMA zone X (unshaded) · 0% chance over 30 yrs
- Wildfire 6/10 Major
- Heat 7/10 Severe 7 d/yr ≥104°F today · 23 d/yr by 30 yrs out
- Wind 4/10 Moderate 13% chance of damaging wind over 30 yrs
- Air quality 1/10 Low 0 unhealthy d/yr today · 0 by 30 yrs out
Nearby sold comps map
Loading sold comps map…
Walkable amenities ~0.75 mi
Loading nearby amenities…
Taxation est. · year 1
- Rental income
- $13,609
- − Mortgage interest
- −$5,518
- − Property taxes
- −$2,329
- − Insurance
- −$492
- − Repairs & maintenance
- −$1,089
- − Management
- −$1,089
- − Depreciation
- −$2,865
- Taxable income
- $227
- Est. tax owed @ 24.0%
- −$54
- After-tax cash flow
- $1,676/yr
For passive investors: Depreciation is non-cash, so a rental often shows a tax loss while cash-flowing — sheltering income. Rental losses are passive: they offset passive income freely, and up to $25,000/yr can offset ordinary (W-2) income if you actively participate and your MAGI is under $100k (phasing out to $0 by $150k); unused losses carry forward. On sale, claimed depreciation is recaptured at up to 25%, and gains may owe capital-gains tax (a 1031 exchange can defer both). Figures are a year-1 estimate at your 24.0% rate — not tax advice; consult a CPA.
Schools (NCES district)
- District
- San Angelo ISD
- NCES district ID
- 4838700
- Math proficiency
- 27% ▼ -9.00%
- Reading proficiency
- 33% ▼ -3.00%
- Median HH income
- $43,501
- Composite
- 25.56/100
- National rank
- #7427
- State rank
- #627 of 826 in TX
Livability — San Angelo
- Score
- 73/100
- State rank
- #199
- US rank
- #5030
Category grades
Schools grade is shown separately in the Schools card above.
Census & demographics
- Census place
- San Angelo, TX
- County
- Tom Green County · 113,188 people
- City population
- 81,357
- Metro
- San Angelo, TX
- Population (ZIP)
- 29,947
- Household income
- $49,498
- Rent vs Own
- Severe rent burden
- 1255.0
Population outlook (Tom Green County) Hauer SSP2
- Today (2025)
- 135,110 people
- By 2030
- 144,090 · +6.6%
- By 2040
- 162,561 · +20.3%
- By 2050
- 182,158 · +34.8%
- By 2075
- 232,274 · +71.9%
- By 2100
- 268,218 · +98.5%
Race, ethnicity, and origin ACS 2023
- Neighborhood character
- Diverse neighborhood (Simpson 0.56)
- Race & ethnicity
- Hispanic / Latino 56% White 36% Two or more races 26% Black 5%
- Hispanic origin (detail)
- Mexican 49% Puerto Rican 1%
- Common ancestry
- Italian 1% Serbian 1% Slovak 1%
- Foreign-born
- 10% · Canada
- Languages at home
- 66% English-only · Spanish 33%
Political lean MEDSL · Tom Green
- 2024 margin
- Solid R (+48.0) · D 25.5% · R 73.5% · Other 1.0%
- 2008→2024 swing
- -6.3pp toward R · 2008: -41.7pp · 2024: -48.0pp
- All cycles
- 2024: R+48.0 2020: R+44.4 2016: R+47.9 2012: R+47.9 2008: R+41.7
Not yet ingested
- Civics
- —
Market trends
- HPI YoY
- ▼ -164.90%
- Current HPI
- 217.0406
- Rent YoY
- ▲ 8.46%
- Metro
- San Angelo, TX
- State GDP YoY
- ▲ 3.95%
- F500 in state
- 110
Industry mix (Fortune 500 HQ in TX)
| Industry | F500 HQs | Revenue |
|---|---|---|
| Energy | 16 | $1,198B |
|
||
| Technology | 5 | $198B |
|
||
| Engineering / Construction | 4 | $72B |
|
||
| Energy Services | 3 | $60B |
|
||
| Utilities | 3 | $41B |
|
||
| Healthcare | 2 | $330B |
|
||
Price history
4 events — show timeline
- 2026-03-11 Listed $1,538,000 SAAR TX
- 2018-02-26 Sold (Public Records) — Public Records
- 2017-01-19 Sold (Public Records) — Public Records
- 2006-06-15 Sold (Public Records) — Public Records
Property tax history
+17.7%/yrLatest (2025): $2,329 · +24.3% YoY. Source: county tax records.
Cash-flow waterfall
monthlySold comps — $/sqft
last 12 mo · ≤1 miLoading sold comps…