31 Shipyard Dr Unit 5B · Hilton Head Island, SC
Flood risk No data
- FEMA flood zone
- —
- Chance of flooding over 30 yrs
- —
- Est. flood insurance / yr
- —
Fire risk No data
- Est. fire insurance / yr
- —
Heat risk No data
- Hot days now (above threshold)
- —
- Hot days in 30 yrs
- —
Wind risk No data
- Chance of severe wind over 30 yrs
- —
Air-quality risk No data
- Unhealthy air days now
- —
- Unhealthy air days in 30 yrs
- —
Risk factors via First Street. Map © Google.
Why this score? — see what drove the F grade
The composite is a weighted blend of 9 inputs, each scored 0–100. Each bar is that input's sub-score; the figure is the points it added to the 100-point composite (weight × sub-score).
- ARV discount +7.5/15.0
- Appreciation +6.6/10.0
- Cash flow +5.6/30.0
- Schools +4.1/10.0
- Rent growth +3.3/5.0
- Livability +3.2/5.0
- Condition / age +2.5/5.0
- 1% rule +2.0/10.0
- DSCR +0.0/10.0
$575,000
🖨 Deal sheet 📄 Offer letter ✓ Due diligence
Listing remarks MLS
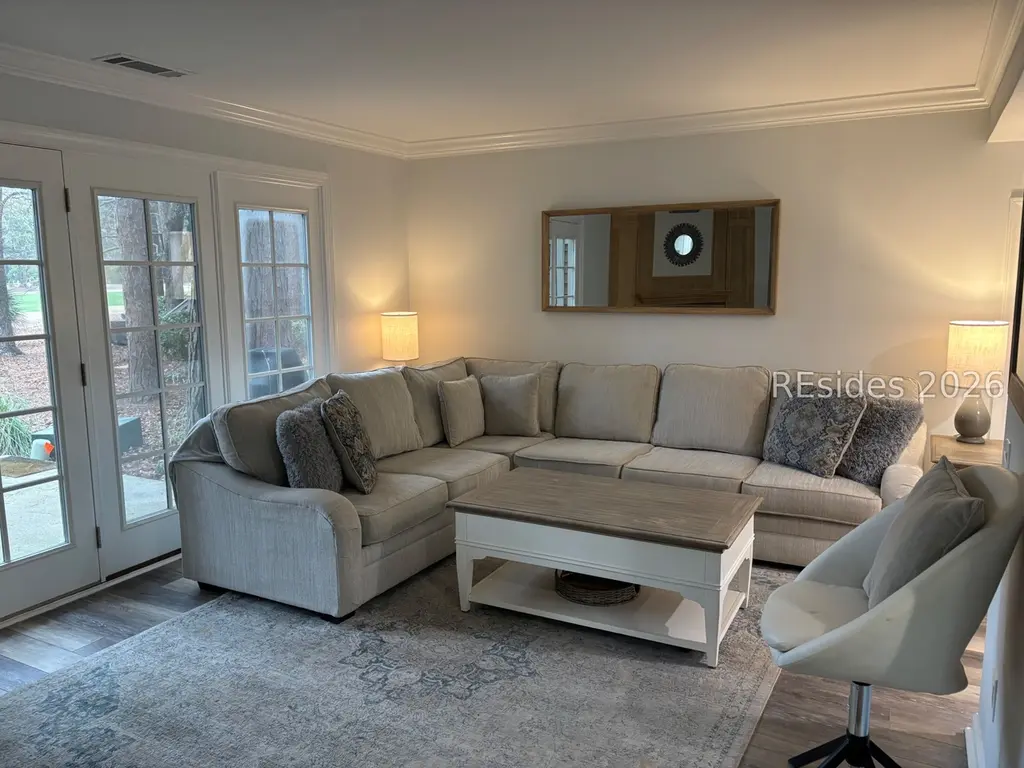
Furnished 2BD/2BA villa in desirable Shipyard perfect for a second home or turn-key rental! From the covered front porch, foyer entrance opens up to large open-concept floorplan w/ sleek LVP flooring. Grand wet bar runs b/w the dining area & spacious living room, making this perfect for entertaining! This modern kitchen w/ stainless steel appliances, all-white cabinets, & gorgeous countertops. Primary bedroom has beautiful views, large en-suite bathroom & plenty of closet space. Down the hall, 2nd bedroom is equipped w/ full bath perfect for guests. Outside includes a large back patio overlooking the golf course w/ outdoor grilling space.
Key facts
- Community pool
- Built 1980
- Listed 14 days
Property features AI
Finance
- Other: Community pool (including lap pool)
- HOA & community: Association amenities: Clubhouse, Fitness Center, Pool, Guard, Tennis courts, Trails; Association covers: Management, Common areas, Insurance, Grounds maintenance, Structure maintenance, Pest control, Sewer, Trash, Water
Exterior
- Parking: Unassigned parking
- Security: Building security; Smoke detector(s)
- Utilities: Public water
- Home design: 2 stories; Stucco construction; Asphalt roof
- Construction: Stucco exterior; Asphalt roof
- Exterior features: Patio; Outdoor grill; Balcony; Front porch; Patio (listed under porch features); Has view; Faces south
Interior
- Kitchen: Dishwasher; Disposal; Microwave; Range / Stove; Self-cleaning oven; Refrigerator
- Bedrooms: Upper level primary
- Flooring: Carpet; Laminate
- Bathrooms: 2 full bathrooms
- Heating & cooling: Central heating; Central air conditioning
- Interior features: Furnished; Attic; Ceiling fan(s); Fire extinguisher; Fireplace (with fireplace screen); Multiple closets; New paint; Smooth ceilings; Separate shower; Cable TV; Window treatments; Bay windows; Window screens
- Laundry & utility: Washer; Dryer
Neighborhood map
What this means for you Summary
Snapshot
- This is a 2-bed/2.0-bath condo listed at $575k.
Deal economics
- At list price, monthly cash flow is $-1k ($-15k/yr) — negative.
- To cash-flow at today's rent, offer at most $480k (16.5% below list).
- To meet the 1% rule (rent ≥ 1% of price), the offer needs to be $403k (29.9% below list).
- Recommended offer: $403k (29.9% below list) — sets the bar for 1% rule.
- Cap rate 3.8% vs local median 3.0% in Hilton Head Island — meaningfully above typical; check what's discounted (condition, days-on-market, listing class) to confirm the premium yield is real.
Location & tenants
- Location reads 64/100 on livability (#157 in SC) — a middle-class / working-renter tenant base. Strengths: employment A+, crime A-; Watch: amenities F, commute F, cost of living F.
- Beaufort 01 (town): math 42% / reading 51% proficiency, ranked #17 of 80 in SC (top 21%) — families likely to look elsewhere, expect single-tenant / working-renter base with shorter leases.
- Market conditions: Rents rising (+3.2%/yr); 838 active listings in the ZIP; 6 comparable units currently listed for rent nearby; rentals at typical pace (median 21d on market — plan ~3-4 weeks tenant-placement turnaround); solid renter incomes; 1,824 units permitted in Beaufort County in 2024 (618 in 5+ unit buildings).
- At $4,031/mo this rent would consume 50% of the median local household income ($98k/yr) (locally 216% of renters already pay >50% of income on rent) — very limited rent-growth headroom before tenants either downsize or default.
Forward outlook
- In year one you build about $22k of equity ($4k loan paydown + $18k appreciation (3.2% local appreciation)).
- Beaufort County population projected at +30% by 2050 — long-run rental-demand tailwind backs the buy-and-hold thesis.
- By year 2, paydown + projected appreciation supports a ~$36k cash-out refi (75% LTV) — recoverable capital for the next deal without selling this one.
Negotiation context
- Only 14 days on market — expect competitive offers; lowballing is unlikely to land.
- 8 sale attempts since 15y ago with the ask held roughly flat each time — persistent listings suggest the price (not the market) is what's stuck; bring a comps-based counter.
Questions for the listing agent
- What do current leases actually rent for vs. the listed asking? Can we see a recent rent roll and the last 12 months of T-12 income?
- What does the HOA fee cover, when was the last increase, and are there any pending special assessments or reserve-fund shortfalls?
- Any open or pending special assessments — roof, HVAC, plumbing, elevator, façade? What's the per-unit balance and payoff schedule, and is the seller paying it off at close or rolling it to the buyer?
- Is there a deadline driving the sale (1031 exchange, divorce, estate, relocation)? That informs how much negotiation room exists.
- Schools are B-rated — typically a magnet for longer-tenancy family renters. What's the average tenant stay here, and is there a school-zone premium baked into asking?
- The area grade is low — what's the realistic commute time and amenity access for the typical tenant pool here? Any planned neighborhood developments (good or bad) we should know about?
- What's the average days-on-market for RENTAL listings here right now (not sales)? A rising rental-DOM trend means longer vacancies and softer asking-rent achievability than the comps imply.
- What's the recent tenant-quality profile in this submarket — average credit score on applications, eviction rate, late-payment / NSF rate, and stable-employment percentage? A property-management company in the area should have these aggregated.
- How much new apartment / multifamily construction is in the pipeline within 1–3 miles? Heavy new supply (>2% of stock underway) typically softens rents 12–24 months out; light construction supports rent growth.
Investment metrics
- 1% rule
- 0.70% ✗
- Cap rate
- 3.76%
- Cash-on-cash
- -9.03%
- DSCR
- 0.60
- GRM
- 11.9
CMA / ARV
No comps found within radius.
Projected returns pro-forma
3.21% appreciation · 3.23% rent growth · sell at horizon
- IRR
- -0.0%
- Equity multiple
- 1.00×
- Total profit
- $-313
- Equity at exit
- $265,286
- IRR
- 4.0%
- Equity multiple
- 1.63×
- Total profit
- $101,118
- Equity at exit
- $414,158
Cash invested: $161,000 (down + closing). Projections, not guarantees.
Landlord ↔ Tenant lean methodology
- Overall (STATE)
- 90 Strongly Landlord-Friendly
- State South Carolina
- 90 Strongly Landlord-Friendly · R+6
- County
- — inherits STATE
- City
- — inherits STATE
ZIP-level market 29928
- Home prices YoY
- 1.3%
- Rents YoY
- 3.2%
- Active inventory
- 838
- Price-to-rent
- 11.9×
Monthly cashflow live
- Estimated rent
- $4,031 high interval (Pro) →
- Mortgage (P&I)
- −$3,015
- Tax from tax record
- −$466 /mo · $5,592/yr
- Insurance
- −$240
- HOA est. from 4 same-building comps
- −$675
- Vacancy / Maint / Mgmt
- −$846
- Net cashflow
- $-1,212
Break-even live
UW: 25.0% down · 7.5% · 30yr · 1.5% tax · 5.0% vac · 8.0% maint · 8.0% mgmt
Financing live
Cash to close
- Down payment
- $143,750
- Closing costs
- $17,250
- Reserves months
- —
- Total cash needed
- —
Loan-product check · same deal, 3 products live
Conventional
25% down · 7.5% · 30yr
- Down + closing
- —
- Monthly P&I
- —
- Monthly cashflow
- —
- DSCR
- —
- Eligible?
- —
Personal DTI + credit; lowest rate.
DSCR
20% down · 8.5% · 30yr
- Down + closing
- —
- Monthly P&I
- —
- Monthly cashflow
- —
- DSCR
- —
- Eligible?
- —
No personal income docs; deal must DSCR.
Hard money
10% down · 12.0% · 12mo
- Down + closing
- —
- Monthly P&I
- —
- Monthly cashflow
- —
- DSCR
- —
- Eligible?
- —
Short-term bridge; refi at stabilization.
Rent comps 6 comps
| Address | Beds | Baths | Sqft | Rent | $/sqft | DOM | Units | Dist |
|---|---|---|---|---|---|---|---|---|
| 125 Shipyard Dr #148 Hilton Head Island, SC | 3.0 | 3.0 | 1400 | $3,200 | $2.29 | 43d | 1 | 0.75mi |
| 183 Beachwalk Unit 1366633P Hilton Head Island, SC | 3.0 | 3.5 | 1797 | $3,943 | $2.19 | 20d | 1 | 0.89mi |
| 10 N Forest Beach Dr Unit 1470517P Hilton Head Island, SC | 2.0 | 2.0 | 1323 | $5,684 | $4.30 | 20d | 1 | 1.03mi |
| 36 Deallyon Ave Unit 1498585P Hilton Head Island, SC | 2.0 | 2.5 | 990 | $2,706 | $2.73 | 13d | 1 | 1.07mi |
| 77 Ocean Ln Unit 1316255P Hilton Head Island, SC | 2.0 | 2.0 | 1162 | $6,002 | $5.17 | 13d | 1 | 1.26mi |
| 19 Lemoyne Ave Unit 1470518P Hilton Head Island, SC | 2.0 | 2.5 | 1033 | $2,673 | $2.59 | 13d | 1 | 1.33mi |
HOA detail condo
- Monthly dues
- $0 · $0/yr
- Assessments
- None detected in remarks — confirm with the listing agent.
Listing history 12 events
-
2026-06-18days on market $575,000 Active 14 DOM
-
2026-06-17days on market $575,000 Active 13 DOM
-
2026-06-16days on market $575,000 Active 12 DOM
-
2026-06-15days on market $575,000 Active 11 DOM
-
2026-06-14days on market $575,000 Active 9 DOM
-
2026-06-13days on market $575,000 Active 8 DOM
-
2026-06-10days on market $575,000 Active 6 DOM
-
2026-06-09days on market $575,000 Active 5 DOM
-
2026-06-08days on market $575,000 Active 4 DOM
-
2026-06-07days on market $575,000 Active 3 DOM
-
2026-06-05remarks 682-char remark
-
2026-06-05$575,000 Active 1 DOM
ⓘ Source: listings_history table (triggers on properties + properties_extension) + one-shot
backfill from property_details.listing_events for pre-trigger history.
Tax reassessment forecast SC · Resets to sale price
- Current annual tax
- $5,592 · $466/mo
- Projected year-2 tax
- $5,592 · $466/mo
- Expected delta
- $0/yr ($0/mo · 0.0%)
ⓘ Screening estimate from a state-policy table — verify with the county assessor before closing.
Nearby sold comps map
Loading sold comps map…
Walkable amenities ~0.75 mi
Loading nearby amenities…
Taxation est. · year 1
- Rental income
- $48,369
- − Mortgage interest
- −$32,209
- − Property taxes
- −$5,592
- − Insurance
- −$2,875
- − Repairs & maintenance
- −$3,870
- − Management
- −$3,870
- − HOA
- −$8,100
- − Depreciation
- −$16,727
- Taxable loss
- −$24,874
- Est. tax savings @ 24.0%
- +$5,970
- After-tax cash flow
- $-8,570/yr
For passive investors: Depreciation is non-cash, so a rental often shows a tax loss while cash-flowing — sheltering income. Rental losses are passive: they offset passive income freely, and up to $25,000/yr can offset ordinary (W-2) income if you actively participate and your MAGI is under $100k (phasing out to $0 by $150k); unused losses carry forward. On sale, claimed depreciation is recaptured at up to 25%, and gains may owe capital-gains tax (a 1031 exchange can defer both). Figures are a year-1 estimate at your 24.0% rate — not tax advice; consult a CPA.
Schools (NCES district)
- District
- Beaufort 01
- NCES district ID
- 4501110
- Math proficiency
- 42% ▼ -8.00%
- Reading proficiency
- 51% ▲ 2.00%
- Median HH income
- $57,430
- Composite
- 40.56/100
- National rank
- #3699
- State rank
- #17 of 80 in SC
Livability — Hilton Head Island
- Score
- 64/100
- State rank
- #157
- US rank
- #14648
Category grades
Schools grade is shown separately in the Schools card above.
Census & demographics
- Census place
- Hilton Head Island, SC
- County
- Beaufort County · 163,770 people
- City population
- 40,243
- Metro
- Hilton Head Island-Bluffton, SC
- Population (ZIP)
- 15,785
- Household income
- $97,576
- Rent vs Own
- Severe rent burden
- 216.0
Population outlook (Beaufort County) Hauer SSP2
- Today (2025)
- 211,915 people
- By 2030
- 227,272 · +7.2%
- By 2040
- 253,861 · +19.8%
- By 2050
- 275,126 · +29.8%
- By 2075
- 311,022 · +46.8%
- By 2100
- 321,286 · +51.6%
Race, ethnicity, and origin ACS 2023
- Neighborhood character
- Predominantly White (87%)
- Race & ethnicity
- White 87% Hispanic / Latino 6% Two or more races 2% Black 2% Asian 1%
- Hispanic origin (detail)
- Mexican 3%
- Common ancestry
- Lithuanian 4% Slovak 4% Romanian 4%
- Foreign-born
- 9% · Canada, China
- Languages at home
- 91% English-only · Spanish 5% French/Haitian/Cajun 1% Chinese 1%
Political lean MEDSL · Beaufort
- 2024 margin
- R (+14.5) · D 42.1% · R 56.6% · Other 1.2%
- 2008→2024 swing
- -3.7pp toward R · 2008: -10.8pp · 2024: -14.5pp
- All cycles
- 2024: R+14.5 2020: R+10.0 2016: R+14.3 2012: R+17.5 2008: R+10.8
Not yet ingested
- Civics
- —
Market trends
- HPI YoY
- ▲ 3.21%
- Current HPI
- 243.4136
- Rent YoY
- ▲ 3.23%
- Metro
- Hilton Head Island-Bluffton, SC
- State GDP YoY
- ▲ 4.51%
- F500 in state
- 2
Industry mix (Fortune 500 HQ in SC)
| Industry | F500 HQs | Revenue |
|---|---|---|
| Packaging | 1 | $7B |
|
||
Price history
+316.7% since first listed27 events — show timeline
- 2026-06-04 Listed $575,000 RSMLS
- 2022-11-28 Sold (Public Records) $520,000 Public Records
- 2022-11-18 Sold (MLS) $520,000 RSMLS
- 2022-11-18 Sold (MLS) $520,000 LRMLS
- 2022-10-12 Pending — LRMLS
- 2022-10-12 Pending — RSMLS
- 2022-09-29 Listed $525,000 LRMLS
- 2022-09-29 Relisted — RSMLS
- 2022-09-21 Listed $525,000 RSMLS
- 2021-05-13 Sold (Public Records) $365,000 Public Records
- 2021-05-03 Sold (MLS) $365,000 RSMLS
- 2021-04-02 Listed $339,000 RSMLS
- 2019-05-14 Sold (Public Records) $240,000 Public Records
- 2019-05-10 Sold (MLS) $240,000 RSMLS
- 2019-04-03 Listed $249,000 RSMLS
- 2014-10-08 Sold (Public Records) $210,000 Public Records
- 2014-09-30 Sold (MLS) $210,000 RSMLS
- 2014-05-23 Listed $227,500 RSMLS
- 2012-08-03 Sold (Public Records) $225,000 Public Records
- 2012-07-31 Sold (MLS) $225,000 RSMLS
- 2011-12-15 Listed $235,000 RSMLS
- 1997-08-15 Sold (Public Records) $137,000 Public Records
- 1996-10-03 Sold (Public Records) $130,000 Public Records
- 1996-10-03 Sold (Public Records) $130,000 Public Records
- 1994-04-25 Sold (Public Records) $94,000 Public Records
- 1988-08-01 Sold (Public Records) $92,500 Public Records
- 1981-06-01 Sold (Public Records) $138,000 Public Records
Property tax history
+6.1%/yrLatest (2025): $5,592 · +1.1% YoY. Source: county tax records.
Cash-flow waterfall
monthlySold comps — $/sqft
last 12 mo · ≤1 miLoading sold comps…