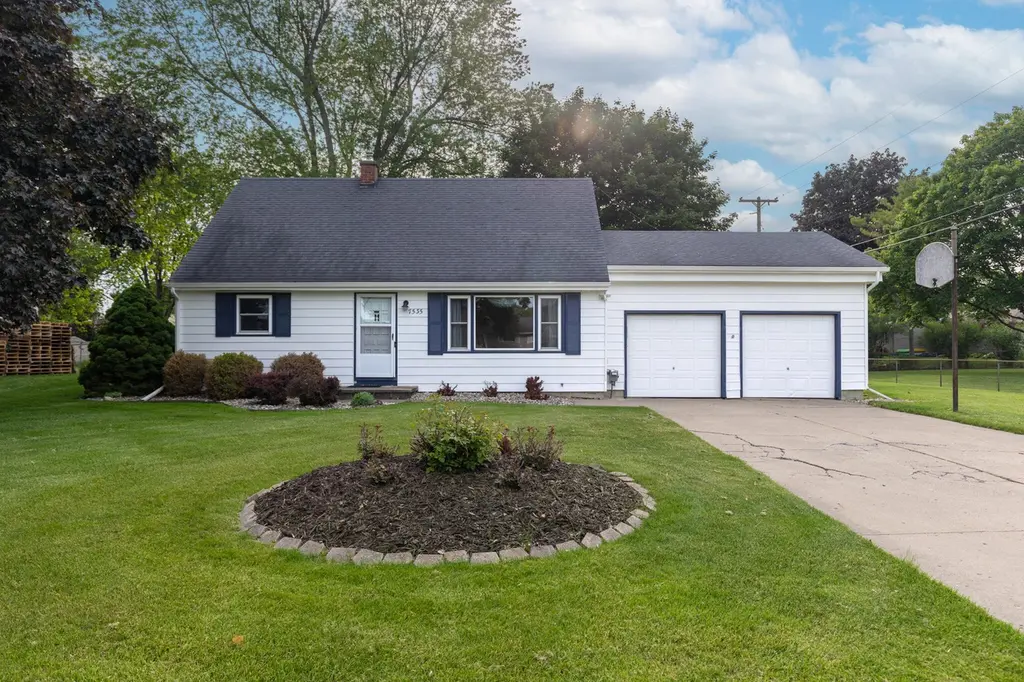
7535 Yorktown Rd · Waverly, MI
Flood risk 1/10 · Minimal
- FEMA flood zone
- X (unshaded)
- Chance of flooding over 30 yrs
- 0.0%
- Est. flood insurance / yr
- $507 – $1,088
Fire risk 1/10 · Minimal
- Est. fire insurance / yr
- $784 – $1,456
Heat risk 3/10 · Minor
- Hot days now (above 97°F)
- 7 days/yr
- Hot days in 30 yrs
- 16 days/yr
Wind risk 2/10 · Minimal
- Chance of severe wind over 30 yrs
- —
Air-quality risk 2/10 · Minimal
- Unhealthy air days now
- 1 days/yr
- Unhealthy air days in 30 yrs
- 2 days/yr
Risk factors via First Street. Map © Google.
Why this score? — see what drove the C grade
The composite is a weighted blend of 9 inputs, each scored 0–100. Each bar is that input's sub-score; the figure is the points it added to the 100-point composite (weight × sub-score).
- Cash flow +17.8/30.0
- ARV discount +13.7/15.0
- DSCR +5.6/10.0
- 1% rule +4.7/10.0
- Livability +4.2/5.0
- Schools +4.0/10.0
- Rent growth +3.7/5.0
- Condition / age +2.5/5.0
- Appreciation +0.0/10.0
$225,000
🖨 Deal sheet 📄 Offer letter ✓ Due diligence
Listing remarks MLS
Available for the first time ever, one of the most loved homes in the Grand Ledge school district, 7535 Yorktown. Cherished and lived in by the same owners for over 60 years this 4 bedroom 2.5 bath home is ready for new owners who are ready to make this house their home. This home offers over 1,500 square feet above grade, and a full basement with endless potential! The main level features a large living room, centrally located kitchen, large family room, 2 bedrooms, 2 full bathrooms, and a convenient main-floor laundry room. Enjoy additional living and entertaining space in the enclosed porch. Upstairs, you'll find 2 additional bedrooms and a half bathroom - the perfect setup for guests, children, or a home office retreat. The full basement provides abundant storage, utility space, and room for a recreation area, home gym, or future finished living space. An attached garage offers convenience and protection from the elements. Do not miss this coveted Delta Township area home!
Key facts
- Attached garage
- Full basement
- Enclosed porch
Tags
Property features AI
Exterior
- Parking: Attached garage; 2-car garage
- Utilities: Public water
- Home design: Single family residence; Other architectural style
- Construction: Built in 1962; Vinyl siding; Composition roof; Foundation: (not specified)
- Exterior features: Shed on property; Paved road access
Interior
- Kitchen: Dishwasher; Microwave; Oven; Range; Refrigerator
- Bathrooms: Two full bathrooms; One half bathroom
- Heating & cooling: Forced air heating; Central cooling
- Interior features: Fireplace; 11 total rooms; Full basement
- Laundry & utility: Washer; Dryer
Neighborhood map
What this means for you Summary
Snapshot
- This is a 4-bed/2.5-bath single-family listed at $225k.
Deal economics
- At list price, monthly cash flow is $184 ($2k/yr) — positive.
- The deal already cash-flows at list — no discount required.
- To meet the 1% rule (rent ≥ 1% of price), the offer needs to be $219k (2.6% below list).
- Recommended offer: $219k (2.6% below list) — sets the bar for 1% rule.
- Cap rate 7.3% vs local median 4.6% in Waverly — top-decile yield for the area; either an underpriced asset or a hidden risk that comps aren't pricing in. Stress-test before assuming the spread holds.
Location & tenants
- Location reads 84/100 on livability (#39 in MI, #805 nationally) — a professional / high-income tenant draw. Strengths: amenities A+, cost of living A+, housing A+; Watch: commute F.
- Grand Ledge Public Schools (suburban): math 36% / reading 54% proficiency, ranked #131 of 540 in MI (top 24%) — families likely to look elsewhere, expect single-tenant / working-renter base with shorter leases.
- Market conditions: Rents rising fast (+4.7%/yr); 99 active listings in the ZIP; 3 comparable units currently listed for rent nearby; rentals leasing fast (median 14d on market — plan ~1-2 weeks tenant-placement turnaround); 98 units permitted in Eaton County in 2024 (0 in 5+ unit buildings).
- This rent runs 37% of the median local income ($71k/yr) — at the standard rent-burdened threshold; future hikes will face affordability resistance.
Forward outlook
- Local home prices are declining (-3.0%/yr); year-one equity from $2k of loan paydown is wiped out by about $7k of value loss. Plan a longer hold.
- Eaton County population projected to shrink 5% by 2050 — rents likely to lag national; underwrite the cash flow, not the appreciation.
Negotiation context
- Only 7 days on market — expect competitive offers; lowballing is unlikely to land.
- 3 sale attempts with the ask held roughly flat each time — persistent listings suggest the price (not the market) is what's stuck; bring a comps-based counter.
Questions for the listing agent
- Built in 1962 — when were the roof, HVAC, electrical panel, plumbing, and water heater last replaced?
- Is there a deadline driving the sale (1031 exchange, divorce, estate, relocation)? That informs how much negotiation room exists.
- Schools are B-rated — typically a magnet for longer-tenancy family renters. What's the average tenant stay here, and is there a school-zone premium baked into asking?
- What's the average days-on-market for RENTAL listings here right now (not sales)? A rising rental-DOM trend means longer vacancies and softer asking-rent achievability than the comps imply.
- What's the recent tenant-quality profile in this submarket — average credit score on applications, eviction rate, late-payment / NSF rate, and stable-employment percentage? A property-management company in the area should have these aggregated.
- How much new for-sale + rental construction is in the pipeline within 1–3 miles? Heavy new supply typically softens prices + rents 12–24 months out; constrained supply supports both.
Investment metrics
- 1% rule
- 0.97% ✗
- Cap rate
- 7.27%
- Cash-on-cash
- 3.50%
- DSCR
- 1.16
- GRM
- 8.6
CMA / ARV
- ARV (on-the-fly)
- $260,776
- Comps found
- 7
Show comp detail 7 sales within ~0.75 mi
| Address | Dist | Beds/Ba | Sqft | Sold | Price | $/sf | Match |
|---|---|---|---|---|---|---|---|
| 7520 Williamsburg Rd | 0.06mi | 3/2.0 (-1) | 1,872 (+6%) | 6mo | $236,700 | $126 | 75 |
| 611 S Canal Rd | 0.12mi | 3/1.0 (-1) | 1,944 (+10%) | 6mo | $255,000 | $131 | 62 |
| 340 Williamsburg Rd | 0.21mi | 3/3.0 (-1) | 1,900 (+8%) | 18mo | $314,900 | $166 | 55 |
| 404 Gettysburg Dr | 0.32mi | 3/1.5 (-1) | 1,935 (+10%) | 8mo | $285,000 | $147 | 53 |
| 7402 Williamsburg Road Rd | 0.11mi | 3/1.5 (-1) | 2,022 (+15%) | 16mo | $311,000 | $154 | 48 |
| 6634 Shiloh Way | 0.74mi | 4/2.5 | 1,755 (-0%) | 21mo | $260,000 | $148 | 47 |
| 415 Harpers Way | 0.65mi | 3/1.5 (-1) | 1,778 (+1%) | 23mo | $285,000 | $160 | 41 |
Match score weights: distance 35% · size 25% · config 20% · recency 20%. Top-matched comps best support the ARV.
Projected returns pro-forma
-3.0% appreciation · 4.74% rent growth · sell at horizon
- IRR
- -8.9%
- Equity multiple
- 0.67×
- Total profit
- $-20,815
- Equity at exit
- $33,548
- IRR
- 2.8%
- Equity multiple
- 1.22×
- Total profit
- $13,668
- Equity at exit
- $19,454
Cash invested: $63,000 (down + closing). Projections, not guarantees.
Landlord ↔ Tenant lean methodology
- Overall (STATE)
- 62 Landlord-Friendly
- State Michigan
- 62 Landlord-Friendly · EVEN
- County
- — inherits STATE
- City
- — inherits STATE
ZIP-level market 48917
- Rents YoY
- 4.7%
- Active inventory
- 99
- Price-to-rent
- 8.6×
Monthly cashflow live
- Estimated rent
- $2,192 medium interval (Pro) →
- Mortgage (P&I)
- −$1,180
- Tax from tax record
- −$274 /mo · $3,285/yr
- Insurance
- −$94
- HOA
- −$0
- Vacancy / Maint / Mgmt
- −$460
- Net cashflow
- $184
Break-even live
UW: 25.0% down · 7.5% · 30yr · 1.5% tax · 5.0% vac · 8.0% maint · 8.0% mgmt
Financing live
Cash to close
- Down payment
- $56,250
- Closing costs
- $6,750
- Reserves months
- —
- Total cash needed
- —
Loan-product check · same deal, 3 products live
Conventional
25% down · 7.5% · 30yr
- Down + closing
- —
- Monthly P&I
- —
- Monthly cashflow
- —
- DSCR
- —
- Eligible?
- —
Personal DTI + credit; lowest rate.
DSCR
20% down · 8.5% · 30yr
- Down + closing
- —
- Monthly P&I
- —
- Monthly cashflow
- —
- DSCR
- —
- Eligible?
- —
No personal income docs; deal must DSCR.
Hard money
10% down · 12.0% · 12mo
- Down + closing
- —
- Monthly P&I
- —
- Monthly cashflow
- —
- DSCR
- —
- Eligible?
- —
Short-term bridge; refi at stabilization.
Rent comps 3 comps
| Address | Beds | Baths | Sqft | Rent | $/sqft | DOM | Units | Dist |
|---|---|---|---|---|---|---|---|---|
| 215 N Canal Rd Lansing, MI | 3.0 | 2.0 | 1248 | $1,424 | $1.14 | 43d | 1 | 0.37mi |
| 1040 Broken Ridge Dr Lansing, MI | 4.0 | 2.5 | 1810 | $2,695 | $1.49 | 13d | 1 | 0.75mi |
| 1048 Broken Ridge Dr Lansing, MI | 4.0 | 2.5 | 1810 | $2,995 | $1.65 | 13d | 1 | 0.78mi |
Listing history 7 events
-
2026-06-10status $225,000 Pending 7 DOM
-
2026-06-09days on market $225,000 Active 7 DOM
-
2026-06-08days on market $225,000 Active 6 DOM
-
2026-06-07days on market $225,000 Active 5 DOM
-
2026-06-05days on market $225,000 Active 2 DOM
-
2026-06-03remarks 699-char remark
-
2026-06-03$225,000 Active 1 DOM
ⓘ Source: listings_history table (triggers on properties + properties_extension) + one-shot
backfill from property_details.listing_events for pre-trigger history.
Tax reassessment forecast MI · Partial reset (capped growth)
- Current annual tax
- $3,285 · $274/mo
- Projected year-2 tax
- $3,375 · $281/mo
- Expected delta
- +$90/yr (+$8/mo · 2.7%)
ⓘ Screening estimate from a state-policy table — verify with the county assessor before closing.
Climate risk First Street
- Flood 1/10 Low FEMA zone X (unshaded) · 0% chance over 30 yrs
- Wildfire 1/10 Low
- Heat 3/10 Moderate 7 d/yr ≥97°F today · 16 d/yr by 30 yrs out
- Wind 2/10 Low
- Air quality 2/10 Low 1 unhealthy d/yr today · 2 by 30 yrs out
Nearby sold comps map
Loading sold comps map…
Walkable amenities ~0.75 mi
Loading nearby amenities…
Taxation est. · year 1
- Rental income
- $26,298
- − Mortgage interest
- −$12,603
- − Property taxes
- −$3,285
- − Insurance
- −$1,125
- − Repairs & maintenance
- −$2,104
- − Management
- −$2,104
- − Depreciation
- −$6,545
- Taxable loss
- −$1,468
- Est. tax savings @ 24.0%
- +$352
- After-tax cash flow
- $2,559/yr
For passive investors: Depreciation is non-cash, so a rental often shows a tax loss while cash-flowing — sheltering income. Rental losses are passive: they offset passive income freely, and up to $25,000/yr can offset ordinary (W-2) income if you actively participate and your MAGI is under $100k (phasing out to $0 by $150k); unused losses carry forward. On sale, claimed depreciation is recaptured at up to 25%, and gains may owe capital-gains tax (a 1031 exchange can defer both). Figures are a year-1 estimate at your 24.0% rate — not tax advice; consult a CPA.
Schools (NCES district)
- District
- Grand Ledge Public Schools
- NCES district ID
- 2616410
- Math proficiency
- 36% ▼ -16.00%
- Reading proficiency
- 54% ▼ -6.00%
- Median HH income
- $62,300
- Composite
- 39.74/100
- National rank
- #3893
- State rank
- #131 of 540 in MI
Livability — Waverly
- Score
- 84/100
- State rank
- #39
- US rank
- #805
Category grades
Schools grade is shown separately in the Schools card above.
Census & demographics
- Census place
- Waverly, MI
- County
- Eaton County · 52,430 people
- City population
- 32,029
- Metro
- Lansing-East Lansing, MI
- Population (ZIP)
- 32,483
- Household income
- $70,990
- Rent vs Own
- Severe rent burden
- 1196.0
Population outlook (Eaton County) Hauer SSP2
- Today (2025)
- 110,811 people
- By 2030
- 110,598 · -0.2%
- By 2040
- 108,304 · -2.3%
- By 2050
- 104,961 · -5.3%
- By 2075
- 97,197 · -12.3%
- By 2100
- 85,150 · -23.2%
Race, ethnicity, and origin ACS 2023
- Neighborhood character
- Predominantly White (67%)
- Race & ethnicity
- White 67% Black 14% Hispanic / Latino 9% Two or more races 8% Asian 5%
- Hispanic origin (detail)
- Mexican 6%
- Common ancestry
- Romanian 5% Iranian 3% Lithuanian 2%
- Foreign-born
- 8% · Canada, Vietnam, South Korea
- Languages at home
- 88% English-only · Spanish 4% Other Indo-European 2% Other Asian/Pacific 2%
Political lean MEDSL · Eaton
- 2024 margin
- Toss-up / Even · D 47.6% · R 50.8% · Other 1.6%
- 2008→2024 swing
- -11.6pp toward R · 2008: 8.4pp · 2024: -3.1pp
- All cycles
- 2024: R+3.1 2020: R+0.8 2016: R+5.5 2012: D+3.1 2008: D+8.4
Not yet ingested
- Civics
- —
Market trends
- HPI YoY
- ▼ -191.60%
- Current HPI
- 189.2075
- Rent YoY
- ▲ 4.74%
- Metro
- Lansing-East Lansing, MI
- State GDP YoY
- ▲ 1.37%
- F500 in state
- 28
Industry mix (Fortune 500 HQ in MI)
| Industry | F500 HQs | Revenue |
|---|---|---|
| Automotive Parts | 3 | $48B |
|
||
| Automotive | 2 | $372B |
|
||
| Chemicals | 1 | $45B |
|
||
| Automotive Retail | 1 | $29B |
|
||
| Healthcare / Medical Devices | 1 | $23B |
|
||
| Automotive Technology | 1 | $20B |
|
||
Price history
+0.0% since first listed3 events — show timeline
- 2026-06-02 Listed $225,000 MiRealSource-MiMLS
- 2026-06-02 Listed $225,000 REALCOMP
- 2026-06-02 Listed $225,000 SW Michigan MLS
Property tax history
+3.2%/yrLatest (2025): $3,285 · +4.0% YoY. Source: county tax records.
Cash-flow waterfall
monthlySold comps — $/sqft
last 12 mo · ≤1 miLoading sold comps…