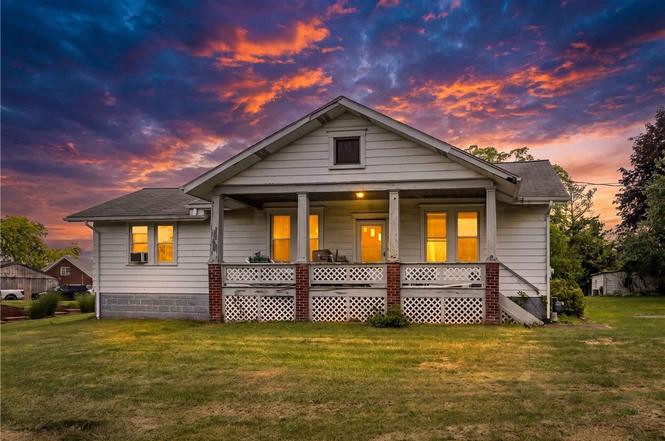
103 Seibert Rd · Moon, PA
Flood risk 1/10 · Minimal
- FEMA flood zone
- X (unshaded)
- Chance of flooding over 30 yrs
- 0.0%
- Est. flood insurance / yr
- $473 – $860
Fire risk 1/10 · Minimal
- Est. fire insurance / yr
- $511 – $949
Heat risk 3/10 · Minor
- Hot days now (above 97°F)
- 7 days/yr
- Hot days in 30 yrs
- 17 days/yr
Wind risk 2/10 · Minimal
- Chance of severe wind over 30 yrs
- —
Air-quality risk 3/10 · Minor
- Unhealthy air days now
- 2 days/yr
- Unhealthy air days in 30 yrs
- 3 days/yr
Risk factors via First Street. Map © Google.
Why this score? — see what drove the B- grade
The composite is a weighted blend of 9 inputs, each scored 0–100. Each bar is that input's sub-score; the figure is the points it added to the 100-point composite (weight × sub-score).
- Cash flow +25.1/30.0
- ARV discount +15.0/15.0
- DSCR +8.2/10.0
- 1% rule +6.5/10.0
- Schools +5.3/10.0
- Rent growth +3.5/5.0
- Livability +2.5/5.0
- Condition / age +2.5/5.0
- Appreciation +0.0/10.0
$170,000
🖨 Deal sheet 📄 Offer letter ✓ Due diligence
Listing remarks
103 Seibert Drive presents an excellent opportunity to restore and reimagine a property in the Moon Township/Coraopolis area. Offered strictly as-is, this home requires substantial updates and renovations throughout and provides a blank canvas for its next owner. The traditional layout and existing footprint offer flexibility for a variety of potential design and improvement options, creating an opportunity to add value through renovation. Conveniently located near Pittsburgh International Airport, Robinson Town Centre, shopping, dining, parks, and major transportation routes, the property combines renovation potential with an accessible location. Bring your vision and creativity to unlock
Key facts
- Accessible location
- Substantial updates
- 0.92 acre lot
Tags
Property features AI
Exterior
- Parking: Detached garage
- Utilities: Public water; Public sewer
- Home design: 2 stories; Asphalt roof
- Exterior features: Lot of just under 1 acre (approximately 0.92 acres)
Interior
- Bathrooms: One full bathroom; One half bathroom
- Interior features: Resale condition
Neighborhood map
What this means for you Summary
Snapshot
- This is a 3-bed/1.5-bath single-family listed at $170k.
Deal economics
- At list price, monthly cash flow is $374 ($4k/yr) — positive.
- The deal already cash-flows at list — no discount required.
- Meets the 1% rule at list price ($2k rent vs $170k).
Location & tenants
- Location reads: area grade B — affects rentability + tenant quality, not the cash-flow math above.
- Moon Area SD (suburban): math 50% / reading 70% proficiency, ranked #62 of 539 in PA (top 12%) — acceptable for families but not a draw, mixed tenant base, ~2y average lease; only 16% free/reduced lunch — higher-income household profile.
- Market conditions: Rents rising fast (+4.1%/yr); 177 active listings in the ZIP; 5 comparable units currently listed for rent nearby; rentals at typical pace (median 17d on market — plan ~3-4 weeks tenant-placement turnaround); solid renter incomes; 2,996 units permitted in Allegheny County in 2024 (1,588 in 5+ unit buildings).
Forward outlook
- Local home prices are declining (-3.0%/yr); year-one equity from $1k of loan paydown is wiped out by about $5k of value loss. Plan a longer hold.
- At projected returns (-3.0% appreciation + 4.1% rent growth), your $48k cash investment doubles in ~10 years — after that, you're playing with house money.
Negotiation context
- Only 2 days on market — expect competitive offers; lowballing is unlikely to land.
Risks & watch-outs
- Watch-outs: built in 1900 — expect roof / HVAC / electrical / plumbing capex.
Questions for the listing agent
- Built in 1900 — when were the roof, HVAC, electrical panel, plumbing, and water heater last replaced?
- Is there a deadline driving the sale (1031 exchange, divorce, estate, relocation)? That informs how much negotiation room exists.
- What's the average days-on-market for RENTAL listings here right now (not sales)? A rising rental-DOM trend means longer vacancies and softer asking-rent achievability than the comps imply.
- What's the recent tenant-quality profile in this submarket — average credit score on applications, eviction rate, late-payment / NSF rate, and stable-employment percentage? A property-management company in the area should have these aggregated.
- How much new for-sale + rental construction is in the pipeline within 1–3 miles? Heavy new supply typically softens prices + rents 12–24 months out; constrained supply supports both.
Investment metrics
- 1% rule
- 1.15% ✓
- Cap rate
- 8.93%
- Cash-on-cash
- 9.43%
- DSCR
- 1.42
- GRM
- 7.3
CMA / ARV
- ARV (on-the-fly)
- $250,740
- Comps found
- 12
Show comp detail 12 sales within ~0.75 mi
| Address | Dist | Beds/Ba | Sqft | Sold | Price | $/sf | Match |
|---|---|---|---|---|---|---|---|
| 1312 Hiland Ave | 0.66mi | 3/2.0 | 2,018 (+1%) | 6mo | $216,500 | $107 | 60 |
| 103 Lansdowne Dr | 0.33mi | 4/2.5 (+1) | 2,002 (+1%) | 18mo | $335,000 | $167 | 59 |
| 1050 Rose Ave | 0.53mi | 3/2.5 | 2,040 (+2%) | 10mo | $215,000 | $105 | 58 |
| 221 Disney Dr | 0.62mi | 4/2.5 (+1) | 1,979 (-1%) | 5mo | $372,000 | $188 | 57 |
| 1705 Hassam | 0.45mi | 4/2.5 (+1) | 1,850 (-7%) | 2mo | $375,950 | $203 | 56 |
| 920 Watson St | 0.57mi | 4/3.0 (+1) | 1,926 (-3%) | 3mo | $205,000 | $106 | 54 |
| 113 Claridge Dr | 0.55mi | 3/2.0 | 1,839 (-8%) | 9mo | $232,000 | $126 | 52 |
| 1050 Vance Ave | 0.66mi | 3/1.5 | 1,755 (-12%) | 5mo | $112,000 | $64 | 46 |
| 101 Lansdowne Dr | 0.32mi | 4/2.5 (+1) | 1,716 (-14%) | 16mo | $319,900 | $186 | 40 |
| 839 Hiland Ave | 0.66mi | 3/1.5 | 1,732 (-13%) | 10mo | $184,000 | $106 | 39 |
| 1324 Hiland Ave | 0.68mi | 3/2.0 | 1,694 (-15%) | 8mo | $225,900 | $133 | 35 |
| 849 Hiland Ave | 0.65mi | 4/2.0 (+1) | 1,704 (-14%) | 10mo | $167,500 | $98 | 30 |
Match score weights: distance 35% · size 25% · config 20% · recency 20%. Top-matched comps best support the ARV.
Projected returns pro-forma
-3.0% appreciation · 4.13% rent growth · sell at horizon
- IRR
- -0.8%
- Equity multiple
- 0.97×
- Total profit
- $-1,453
- Equity at exit
- $25,348
- IRR
- 10.0%
- Equity multiple
- 1.82×
- Total profit
- $38,949
- Equity at exit
- $14,698
Cash invested: $47,600 (down + closing). Projections, not guarantees.
Landlord ↔ Tenant lean methodology
- Overall (STATE)
- 62 Landlord-Friendly
- State Pennsylvania
- 62 Landlord-Friendly · EVEN
- County
- — inherits STATE
- City
- — inherits STATE
ZIP-level market 15108
- Rents YoY
- 4.1%
- Active inventory
- 177
- Price-to-rent
- 7.3×
Monthly cashflow live
- Estimated rent
- $1,954 high interval (Pro) →
- Mortgage (P&I)
- −$891
- Tax from tax record
- −$207 /mo · $2,487/yr
- Insurance
- −$71
- HOA
- −$0
- Vacancy / Maint / Mgmt
- −$410
- Net cashflow
- $374
Break-even live
UW: 25.0% down · 7.5% · 30yr · 1.5% tax · 5.0% vac · 8.0% maint · 8.0% mgmt
Financing live
Cash to close
- Down payment
- $42,500
- Closing costs
- $5,100
- Reserves months
- —
- Total cash needed
- —
Loan-product check · same deal, 3 products live
Conventional
25% down · 7.5% · 30yr
- Down + closing
- —
- Monthly P&I
- —
- Monthly cashflow
- —
- DSCR
- —
- Eligible?
- —
Personal DTI + credit; lowest rate.
DSCR
20% down · 8.5% · 30yr
- Down + closing
- —
- Monthly P&I
- —
- Monthly cashflow
- —
- DSCR
- —
- Eligible?
- —
No personal income docs; deal must DSCR.
Hard money
10% down · 12.0% · 12mo
- Down + closing
- —
- Monthly P&I
- —
- Monthly cashflow
- —
- DSCR
- —
- Eligible?
- —
Short-term bridge; refi at stabilization.
Rent comps 5 comps
| Address | Beds | Baths | Sqft | Rent | $/sqft | DOM | Units | Dist |
|---|---|---|---|---|---|---|---|---|
| 1669 Charlton Heights Rd Coraopolis, PA | 3.0 | 2.5 | 1738 | $2,500 | $1.44 | 17d | 1 | 0.37mi |
| 1865 Montour St Coraopolis, PA | 3.0 | 1.5 | 1360 | $1,499 | $1.10 | 43d | 1 | 0.87mi |
| 1865 Montour St Coraopolis, PA | 3.0 | 1.5 | 1360 | $1,499 | $1.10 | 23d | 1 | 0.87mi |
| 105 Broadway St Coraopolis, PA | 3.0 | 1.5 | 1672 | $1,799 | $1.08 | 7d | 1 | 1.06mi |
| 1704 State Ave Coraopolis, PA | 3.0 | 2.0 | 1456 | $1,500 | $1.03 | 7d | 1 | 1.09mi |
Listing history 3 events
-
2026-06-18days on market $170,000 Active 2 DOM
-
2026-06-17remarks 699-char remark
-
2026-06-17$170,000 Active 1 DOM
ⓘ Source: listings_history table (triggers on properties + properties_extension) + one-shot
backfill from property_details.listing_events for pre-trigger history.
Tax reassessment forecast PA · Partial reset (capped growth)
- Current annual tax
- $2,487 · $207/mo
- Projected year-2 tax
- $2,587 · $216/mo
- Expected delta
- +$99/yr (+$8/mo · 4.0%)
ⓘ Screening estimate from a state-policy table — verify with the county assessor before closing.
Climate risk First Street
- Flood 1/10 Low FEMA zone X (unshaded) · 0% chance over 30 yrs
- Wildfire 1/10 Low
- Heat 3/10 Moderate 7 d/yr ≥97°F today · 17 d/yr by 30 yrs out
- Wind 2/10 Low
- Air quality 3/10 Moderate 2 unhealthy d/yr today · 3 by 30 yrs out
Nearby sold comps map
Loading sold comps map…
Walkable amenities ~0.75 mi
Loading nearby amenities…
Taxation est. · year 1
- Rental income
- $23,447
- − Mortgage interest
- −$9,523
- − Property taxes
- −$2,487
- − Insurance
- −$850
- − Repairs & maintenance
- −$1,876
- − Management
- −$1,876
- − Depreciation
- −$4,945
- Taxable income
- $1,890
- Est. tax owed @ 24.0%
- −$454
- After-tax cash flow
- $4,035/yr
For passive investors: Depreciation is non-cash, so a rental often shows a tax loss while cash-flowing — sheltering income. Rental losses are passive: they offset passive income freely, and up to $25,000/yr can offset ordinary (W-2) income if you actively participate and your MAGI is under $100k (phasing out to $0 by $150k); unused losses carry forward. On sale, claimed depreciation is recaptured at up to 25%, and gains may owe capital-gains tax (a 1031 exchange can defer both). Figures are a year-1 estimate at your 24.0% rate — not tax advice; consult a CPA.
Schools (NCES district)
- District
- Moon Area SD
- NCES district ID
- 4215830
- Math proficiency
- 50% ▼ -15.00%
- Reading proficiency
- 70% ▼ -10.00%
- Median HH income
- $70,464
- Composite
- 52.95/100
- National rank
- #1528
- State rank
- #62 of 539 in PA
Livability — Moon
No livability data for this city. (Only ~50 U.S. cities are tracked.)
Census & demographics
- County
- Allegheny County · 1,022,028 people
- Metro
- Pittsburgh, PA
- Population (ZIP)
- 42,799
- Household income
- $100,859
- Rent vs Own
- Severe rent burden
- 890.0
Population outlook (Allegheny County) Hauer SSP2
- Today (2025)
- 1,250,282 people
- By 2030
- 1,256,482 · +0.5%
- By 2040
- 1,256,318 · +0.5%
- By 2050
- 1,244,169 · -0.5%
- By 2075
- 1,197,693 · -4.2%
- By 2100
- 1,093,187 · -12.6%
Race, ethnicity, and origin ACS 2023
- Neighborhood character
- Predominantly White (85%)
- Race & ethnicity
- White 85% Black 5% Two or more races 5% Asian 4% Hispanic / Latino 2%
- Common ancestry
- Romanian 7% Subsaharan African 4% Slovak 2%
- Foreign-born
- 6% · Canada, Vietnam
- Languages at home
- 93% English-only · Spanish 2% Other Indo-European 1% Other Asian/Pacific 1%
Political lean MEDSL · Allegheny
- 2024 margin
- Strong D (+20.3) · D 59.7% · R 39.4%
- 2008→2024 swing
- +4.8pp toward D · 2008: 15.5pp · 2024: 20.3pp
- All cycles
- 2024: D+20.3 2020: D+20.4 2016: D+16.4 2012: D+14.4 2008: D+15.5
Not yet ingested
- Civics
- —
Market trends
- HPI YoY
- ▼ -220.09%
- Current HPI
- 250.7623
- Rent YoY
- ▲ 4.13%
- Metro
- Pittsburgh, PA
- State GDP YoY
- ▲ 1.68%
- F500 in state
- 34
Industry mix (Fortune 500 HQ in PA)
| Industry | F500 HQs | Revenue |
|---|---|---|
| Healthcare | 2 | $309B |
|
||
| Insurance | 2 | $27B |
|
||
| Telecommunications / Media | 1 | $124B |
|
||
| Industrial Distribution | 1 | $22B |
|
||
| Financial Services | 1 | $20B |
|
||
| Chemicals / Materials | 1 | $18B |
|
||
Price history
1 event — show timeline
- 2026-06-15 Listed $170,000 West Penn MLS
Property tax history
+2.6%/yrLatest (2026): $2,487 · +6.8% YoY. Source: county tax records.
Cash-flow waterfall
monthlySold comps — $/sqft
last 12 mo · ≤1 miLoading sold comps…