 Fourplex
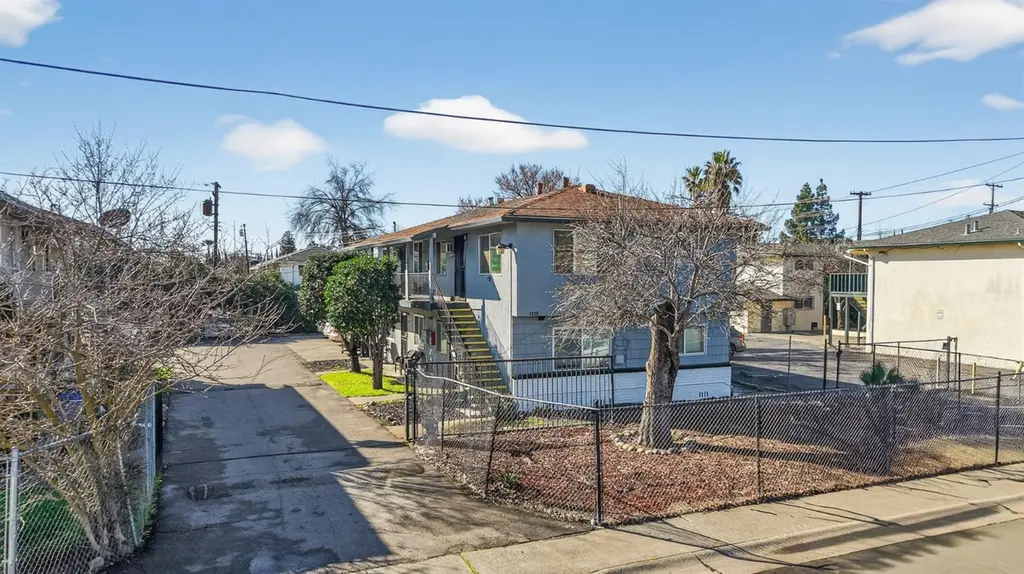
3836 43rd Ave · Lemon Hill, CA
Flood risk 1/10 · Minimal
- FEMA flood zone
- X (shaded)
- Chance of flooding over 30 yrs
- 0.0%
- Est. flood insurance / yr
- $507 – $1,088
Fire risk 1/10 · Minimal
- Est. fire insurance / yr
- $659 – $1,223
Heat risk 7/10 · Major
- Hot days now (above 102°F)
- 7 days/yr
- Hot days in 30 yrs
- 15 days/yr
Wind risk 1/10 · Minimal
- Chance of severe wind over 30 yrs
- —
Air-quality risk 10/10 · Severe
- Unhealthy air days now
- 25 days/yr
- Unhealthy air days in 30 yrs
- 26 days/yr
Risk factors via First Street. Map © Google.
Why this score? — see what drove the D grade
The composite is a weighted blend of 9 inputs, each scored 0–100. Each bar is that input's sub-score; the figure is the points it added to the 100-point composite (weight × sub-score).
- Cash flow +18.3/30.0
- DSCR +5.7/10.0
- 1% rule +4.9/10.0
- Rent growth +4.1/5.0
- Schools +3.5/10.0
- Livability +2.2/5.0
- Condition / age +2.2/5.0
- ARV discount +0.0/15.0
- Appreciation +0.0/10.0
$598,000
🖨 Deal sheet 📄 Offer letter ✓ Due diligence
Multi-family units
County records classify this as Multi-Family (2-4 Unit). Listing-text estimate: 4 units. confirmed
Listing remarks
* * * 3836 43rd Avenue must be purchased with 3441 & 3445 Altos Avenue, This is a portfolio sale of three separate 4plexes that must be purchased together as a package * * * Colliers is pleased to present an attractive multifamily value-add opportunity in the Sacramento region: 3441-3445 Altos Avenue and 3836 43rd Avenue. This portfolio features three well-located, income-producing 4-plex properties totaling 12 units, 3836 43rd Avenue, built in 1958 a solid 4-plex investment positioned in the South Sacramento submarket, The property comes with Four 1Bedroom/1Bathroom Units and parking. 3445 Altos Avenue comprises two identical 4-plex buildings constructed in 1973, each approximat
Key facts
- 7,405 sq ft lot
- 4 parking spots
- Built 1958
Neighborhood map
What this means for you Summary
Snapshot
- This is a 4 × 1-bed/1-bath units multifamily listed at $598k. Condition is rated fair.
Deal economics
- At list price, monthly cash flow is $547 ($7k/yr) — positive. Per door: $137/mo.
- The deal already cash-flows at list — no discount required.
- To meet the 1% rule (rent ≥ 1% of price), the offer needs to be $592k (0.9% below list).
- Recommended offer: $544k (9.0% below list) — sets the bar for market timing.
- Cap rate 7.4% vs local median 3.8% in Lemon Hill — top-decile yield for the area; either an underpriced asset or a hidden risk that comps aren't pricing in. Stress-test before assuming the spread holds.
Location & tenants
- Location reads 45/100 on livability (#1,302 in CA) — a working-class tenant base; expect higher turnover. Strengths: housing A; Watch: health & safety D, schools F, crime F.
- Sacramento City Unified (urban): math 32% / reading 43% proficiency, ranked #804 of 1,400 in CA (top 57%) — families likely to look elsewhere, expect single-tenant / working-renter base with shorter leases; 63% free/reduced lunch — lower-income household profile, screen leases tightly.
- Market conditions: Rents rising fast (+6.4%/yr); 67 active listings in the ZIP; 6,825 units permitted in Sacramento County in 2024 (1,752 in 5+ unit buildings).
- At $5,924/mo this rent would consume 126% of the median local household income ($56k/yr) (locally 1671% of renters already pay >50% of income on rent) — very limited rent-growth headroom before tenants either downsize or default.
Forward outlook
- Local home prices are declining (-3.0%/yr); year-one equity from $4k of loan paydown is wiped out by about $18k of value loss. Plan a longer hold.
- Sacramento County population projected at +17% by 2050 — long-run rental-demand tailwind backs the buy-and-hold thesis.
Negotiation context
- It's been on market 99 days — a 9% lower offer ($544k) is reasonable based on typical stale-listing flexibility.
- Current owner paid $310k; list at $598k implies a 93% gain — meaningful room to come down on a strong offer.
Risks & watch-outs
- Watch-outs: built in 1958 — expect roof / HVAC / electrical / plumbing capex.
- Climate carrying-cost: extreme-heat days projected 7→15/yr by 2055 (HVAC capex compounding) — expect insurance premiums to compound above CPI over the hold.
Questions for the listing agent
- It's been on market 99 days. Have you received any prior offers? Is the seller open to a 9% concession, seller financing, or rate buy-down credit?
- Can we see the unit-by-unit rent roll, current vacancy, and any below-market leases? What's the average tenancy length?
- What capital expenditures (roof, boiler, parking lot, exteriors) have been made in the last 5 years, and what's planned in the next 2?
- Have any recent inspections been done? Can we get a copy of the seller's disclosures and any deferred-maintenance estimates?
- Built in 1958 — when were the roof, HVAC, electrical panel, plumbing, and water heater last replaced?
- Why hasn't it sold? Are there any deal-killer items the seller is aware of (foundation, flood, title, zoning, code violations)?
- Is there a deadline driving the sale (1031 exchange, divorce, estate, relocation)? That informs how much negotiation room exists.
- Schools are F-rated, which usually means shorter tenancies and higher turnover. Who's the typical renter profile here, and what's been the actual vacancy rate?
- Crime grade is F in this area — have there been break-ins, vandalism, or insurance claims at this property in the last 3 years? What carrier currently insures it and at what premium?
- The area grade is low — what's the realistic commute time and amenity access for the typical tenant pool here? Any planned neighborhood developments (good or bad) we should know about?
- What's the average days-on-market for RENTAL listings here right now (not sales)? A rising rental-DOM trend means longer vacancies and softer asking-rent achievability than the comps imply.
- What's the recent tenant-quality profile in this submarket — average credit score on applications, eviction rate, late-payment / NSF rate, and stable-employment percentage? A property-management company in the area should have these aggregated.
- How much new apartment / multifamily construction is in the pipeline within 1–3 miles? Heavy new supply (>2% of stock underway) typically softens rents 12–24 months out; light construction supports rent growth.
Investment metrics
- 1% rule
- 0.99% ✗
- Cap rate
- 7.39%
- Cash-on-cash
- 3.92%
- DSCR
- 1.17
- GRM
- 8.4
CMA / ARV
- ARV (median comp)
- $482,226
- List price
- $598,000
- Delta
- 24.01%
- Verdict
- OVERPRICED
- Comps
- 20 within 1.0 mi
Projected returns pro-forma
-3.0% appreciation · 6.44% rent growth · sell at horizon
- IRR
- -6.3%
- Equity multiple
- 0.76×
- Total profit
- $-40,743
- Equity at exit
- $89,164
- IRR
- 7.1%
- Equity multiple
- 1.62×
- Total profit
- $103,198
- Equity at exit
- $51,704
Cash invested: $167,440 (down + closing). Projections, not guarantees.
Landlord ↔ Tenant lean methodology
- Overall (STATE)
- 18 Strongly Tenant-Friendly
- State California
- 18 Strongly Tenant-Friendly · D+13
- County
- — inherits STATE
- City
- — inherits STATE
ZIP-level market 95824
- Rents YoY
- 6.4%
- Active inventory
- 67
- Price-to-rent
- 33.7×
Monthly cashflow live
- Estimated rent
- $5,924 high interval (Pro) →
- Mortgage (P&I)
- −$3,136
- Tax est. 1.5%
- −$748 /mo · $8,970/yr
- Insurance
- −$249
- HOA
- −$0
- Vacancy / Maint / Mgmt
- −$1,244
- Net cashflow
- $547
Break-even live
4-unit breakdown (identical units grouped — click to expand)
| Units | Beds | Baths | Est. rent |
|---|---|---|---|
| 4× units | 1 | 1 | $5,924 |
| #1 | 1 | 1 | $1,481 |
| #2 | 1 | 1 | $1,481 |
| #3 | 1 | 1 | $1,481 |
| #4 | 1 | 1 | $1,481 |
| Total (4 units) | $5,924 | ||
UW: 25.0% down · 7.5% · 30yr · 1.5% tax · 5.0% vac · 8.0% maint · 8.0% mgmt
Financing live
Cash to close
- Down payment
- $149,500
- Closing costs
- $17,940
- Reserves months
- —
- Total cash needed
- —
Loan-product check · same deal, 3 products live
Conventional
25% down · 7.5% · 30yr
- Down + closing
- —
- Monthly P&I
- —
- Monthly cashflow
- —
- DSCR
- —
- Eligible?
- —
Personal DTI + credit; lowest rate.
DSCR
20% down · 8.5% · 30yr
- Down + closing
- —
- Monthly P&I
- —
- Monthly cashflow
- —
- DSCR
- —
- Eligible?
- —
No personal income docs; deal must DSCR.
Hard money
10% down · 12.0% · 12mo
- Down + closing
- —
- Monthly P&I
- —
- Monthly cashflow
- —
- DSCR
- —
- Eligible?
- —
Short-term bridge; refi at stabilization.
Listing history 17 events
-
2026-06-18days on market $598,000 Active 99 DOM
-
2026-06-17days on market $598,000 Active 98 DOM
-
2026-06-16days on market $598,000 Active 97 DOM
-
2026-06-15days on market $598,000 Active 96 DOM
-
2026-06-13days on market $598,000 Active 94 DOM
-
2026-06-13pricedays on market $598,000 Active 93 DOM
-
2026-06-09days on market $599,000 Active 90 DOM
-
2026-06-08days on market $599,000 Active 89 DOM
-
2026-06-07days on market $599,000 Active 88 DOM
-
2026-06-05days on market $599,000 Active 85 DOM
-
2026-06-03days on market $599,000 Active 84 DOM
-
2026-06-02days on market $599,000 Active 83 DOM
-
2026-06-01days on market $599,000 Active 82 DOM
-
2026-05-31days on market $599,000 Active 81 DOM
-
2004-07-15soldstatus $310,000
-
2004-03-21historical
-
2004-03-16$305,000
ⓘ Source: listings_history table (triggers on properties + properties_extension) + one-shot
backfill from property_details.listing_events for pre-trigger history.
Climate risk First Street
- Flood 1/10 Low FEMA zone X (shaded) · 0% chance over 30 yrs
- Wildfire 1/10 Low
- Heat 7/10 Severe 7 d/yr ≥102°F today · 15 d/yr by 30 yrs out
- Wind 1/10 Low
- Air quality 10/10 Extreme 25 unhealthy d/yr today · 26 by 30 yrs out
Nearby sold comps map
Loading sold comps map…
Walkable amenities ~0.75 mi
Loading nearby amenities…
Taxation est. · year 1
- Rental income
- $71,088
- − Mortgage interest
- −$33,497
- − Property taxes
- −$8,970
- − Insurance
- −$2,990
- − Repairs & maintenance
- −$5,687
- − Management
- −$5,687
- − Depreciation
- −$17,396
- Taxable loss
- −$3,140
- Est. tax savings @ 24.0%
- +$754
- After-tax cash flow
- $7,321/yr
For passive investors: Depreciation is non-cash, so a rental often shows a tax loss while cash-flowing — sheltering income. Rental losses are passive: they offset passive income freely, and up to $25,000/yr can offset ordinary (W-2) income if you actively participate and your MAGI is under $100k (phasing out to $0 by $150k); unused losses carry forward. On sale, claimed depreciation is recaptured at up to 25%, and gains may owe capital-gains tax (a 1031 exchange can defer both). Figures are a year-1 estimate at your 24.0% rate — not tax advice; consult a CPA.
Condition & rehab AI · 8 photos
This 4plex property requires moderate renovations to update kitchens and bathrooms, repair exterior siding, and replace HVAC units. These updates will significantly increase its resale and rental value.
Repairs flagged
- Moderate kitchen cabinets — dated and in need of replacement
- Moderate kitchen appliances — outdated and in need of replacement
- Moderate bathroom fixtures — standard and in need of updating
- Moderate exterior siding — moderate wear and tear
Value-add opportunities
- Both update kitchen cabinets and appliances — modernizing the kitchen will appeal to buyers and renters
- Both update bathrooms — modernizing bathrooms will appeal to buyers and renters
- Both repair and paint exterior — improving the exterior will enhance curb appeal and property value
- Both replace HVAC units — modernizing HVAC systems will improve comfort and energy efficiency
Renovation cost estimate screening
| Repair item | Severity | Est. cost |
|---|---|---|
| kitchen cabinets · dated and in need of replacement | Moderate | $3,000–15,000 |
| kitchen appliances · outdated and in need of replacement | Moderate | $3,000–15,000 |
| bathroom fixtures · standard and in need of updating | Moderate | $3,000–15,000 |
| exterior siding · moderate wear and tear | Moderate | $3,000–15,000 |
| Total estimated repair cost · 4 items | $12,000–60,000 |
Value-add ROI direction
- Both update kitchen cabinets and appliances — modernizing the kitchen will appeal to buyers and renters ↑
- Both update bathrooms — modernizing bathrooms will appeal to buyers and renters ↑
- Both repair and paint exterior — improving the exterior will enhance curb appeal and property value ↑
- Both replace HVAC units — modernizing HVAC systems will improve comfort and energy efficiency ↑
ⓘ Cost ranges are severity-bucket heuristics (US national rule-of-thumb). Get contractor quotes + a written scope before underwriting a rehab budget.
Schools (NCES district)
- District
- Sacramento City Unified
- NCES district ID
- 0633840
- Math proficiency
- 32% ▬ 0.00%
- Reading proficiency
- 43% ▲ 3.00%
- Median HH income
- $49,280
- Composite
- 34.86/100
- National rank
- #10000
- State rank
- #804 of 1400 in CA
Livability — Lemon Hill
- Score
- 45/100
- State rank
- #1302
- US rank
- #26608
Category grades
Schools grade is shown separately in the Schools card above.
Census & demographics
- Census place
- Lemon Hill, CA
- County
- Sacramento County · 1,539,646 people
- Metro
- Sacramento-Roseville-Folsom, CA
- Population (ZIP)
- 33,083
- Household income
- $56,477
- Rent vs Own
- Severe rent burden
- 1671.0
Population outlook (Sacramento County) Hauer SSP2
- Today (2025)
- 1,660,763 people
- By 2030
- 1,732,990 · +4.3%
- By 2040
- 1,855,755 · +11.7%
- By 2050
- 1,941,335 · +16.9%
- By 2075
- 2,046,162 · +23.2%
- By 2100
- 1,961,444 · +18.1%
Race, ethnicity, and origin ACS 2023
- Neighborhood character
- Highly diverse neighborhood (Simpson 0.70)
- Race & ethnicity
- Hispanic / Latino 43% Asian 29% White 13% Two or more races 12% Black 10% Native American 2% Pacific Islander 2%
- Hispanic origin (detail)
- Mexican 38%
- Common ancestry
- Lithuanian 1% Russian 1%
- Foreign-born
- 33% · Canada, Vietnam, China
- Languages at home
- 44% English-only · Spanish 29% Other Asian/Pacific 12% Vietnamese 5%
Political lean MEDSL · Sacramento
- 2024 margin
- D (+19.7) · D 58.1% · R 38.4% · Other 3.5%
- 2008→2024 swing
- +0.7pp no change · 2008: 19.0pp · 2024: 19.7pp
- All cycles
- 2024: D+19.7 2020: D+25.3 2016: D+23.7 2012: D+16.3 2008: D+19.0
Not yet ingested
- Civics
- —
Market trends
- HPI YoY
- ▼ -341.41%
- Current HPI
- 409.6203
- Rent YoY
- ▲ 6.44%
- Metro
- Sacramento-Roseville-Folsom, CA
- State GDP YoY
- ▲ 3.21%
- F500 in state
- 116
Industry mix (Fortune 500 HQ in CA)
| Industry | F500 HQs | Revenue |
|---|---|---|
| Technology | 27 | $1,492B |
|
||
| Financial Services | 3 | $174B |
|
||
| Retail | 3 | $44B |
|
||
| Insurance | 3 | $26B |
|
||
| Media / Entertainment | 2 | $115B |
|
||
| Pharmaceuticals / Biotech | 2 | $62B |
|
||
Price history
+1.6% since first listed3 events — show timeline
- 2004-07-15 Sold (MLS) $310,000 bridgeMLS, Bay East AOR, or Contra Costa AOR
- 2004-03-21 Listing Removed — bridgeMLS, Bay East AOR, or Contra Costa AOR
- 2004-03-16 Listed $305,000 bridgeMLS, Bay East AOR, or Contra Costa AOR
Cash-flow waterfall
monthlySold comps — $/sqft
last 12 mo · ≤1 miLoading sold comps…