151 Winding Chestnut Dr · Columbia, SC
Flood risk No data
- FEMA flood zone
- —
- Chance of flooding over 30 yrs
- —
- Est. flood insurance / yr
- —
Fire risk No data
- Est. fire insurance / yr
- —
Heat risk No data
- Hot days now (above threshold)
- —
- Hot days in 30 yrs
- —
Wind risk No data
- Chance of severe wind over 30 yrs
- —
Air-quality risk No data
- Unhealthy air days now
- —
- Unhealthy air days in 30 yrs
- —
Risk factors via First Street. Map © Google.
Why this score? — see what drove the D+ grade
The composite is a weighted blend of 9 inputs, each scored 0–100. Each bar is that input's sub-score; the figure is the points it added to the 100-point composite (weight × sub-score).
- Cash flow +14.4/30.0
- ARV discount +7.5/15.0
- Appreciation +5.0/10.0
- Schools +4.5/10.0
- DSCR +4.4/10.0
- 1% rule +4.0/10.0
- Livability +3.9/5.0
- Rent growth +2.5/5.0
- Condition / age +2.5/5.0
$225,999
🖨 Deal sheet 📄 Offer letter ✓ Due diligence
Listing remarks
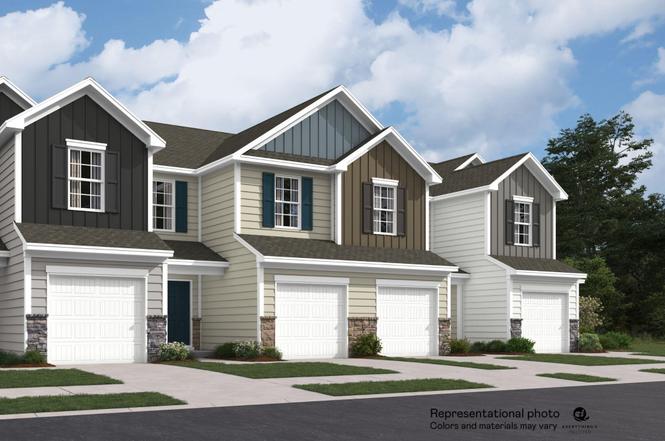
Move In Ready! Nature lovers, welcome to your stunning NEW 3-bedroom, 2.5-bath Aspen interior plan, perfectly situated for easy commuting in Columbia and nearby Irmo, SC. This brand new community is tucked into an established neighborhood that houses attractions like river access, boat ramps, fishing, hiking, community events. Enjoy the convenience of nearby shopping, Riverbanks Zoo, River Walk Park, and just a 20-minute drive to downtown Columbia. your new home features elegant quartz countertops in the kitchen and baths and wood-inspired vinyl plank flooring throughout the first floor. The open kitchen has spacious counters, an expansive island, and modern stainless-steel appliances, incl
Key facts
- Quartz countertops
- River access
- Fishing
Tags
Neighborhood map
What this means for you Summary
Snapshot
- This is a 3-bed/2.5-bath townhouse listed at $226k.
Deal economics
- At list price, monthly cash flow is $47 ($566/yr) — positive.
- The deal already cash-flows at list — no discount required.
- To meet the 1% rule (rent ≥ 1% of price), the offer needs to be $204k (9.9% below list).
- Recommended offer: $204k (9.9% below list) — sets the bar for 1% rule.
- Cap rate 6.5% vs local median 5.0% in Columbia — meaningfully above typical; check what's discounted (condition, days-on-market, listing class) to confirm the premium yield is real.
Location & tenants
- Location reads 78/100 on livability (#18 in SC, #2,436 nationally) — a middle-class / working-renter tenant base. Strengths: amenities A+, commute A+, cost of living A+; Watch: employment D, crime F.
- Lexington 05 (suburban): math 47% / reading 55% proficiency, ranked #5 of 80 in SC (top 6%) — acceptable for families but not a draw, mixed tenant base, ~2y average lease.
- Zoned schools: Oak Pointe Elementary (math 63% / reading 62%, grade B, #69 of 597 statewide, top 12%, 520 students, 48% FRL); Dutch Fork High (math 54% / reading 86%, grade B+, #58 of 196 statewide, top 30%, 1,726 students, 52% FRL) — zoned schools average 50% FRL vs 27% district-wide (23 pts higher); higher-poverty schools than district average — tighter screening recommended.
- Zoned-school proficiency averages 66% at this address vs 51% district-wide (+15 pts) — the actual schools serving this property are materially stronger than the Lexington 05 average implies; a family-tenant draw the district grade alone would hide.
- Market conditions: 5 active listings in the ZIP; 36 comparable units currently listed for rent nearby; rentals leasing fast (median 3d on market — plan ~1-2 weeks tenant-placement turnaround); 3,472 units permitted in Richland County in 2024 (1,096 in 5+ unit buildings).
Forward outlook
- In year one you build about $8k of equity ($2k loan paydown + $7k appreciation (3.0% local appreciation)).
- Richland County population projected at +30% by 2050 — long-run rental-demand tailwind backs the buy-and-hold thesis.
- At projected returns (3.0% appreciation + 3.0% rent growth), your $63k cash investment doubles in ~6 years — after that, you're playing with house money.
- By year 5, paydown + projected appreciation supports a ~$36k cash-out refi (75% LTV) — recoverable capital for the next deal without selling this one.
Negotiation context
- It's been on market 92 days — a 9% lower offer ($206k) is reasonable based on typical stale-listing flexibility.
Questions for the listing agent
- It's been on market 92 days. Have you received any prior offers? Is the seller open to a 10% concession, seller financing, or rate buy-down credit?
- Why hasn't it sold? Are there any deal-killer items the seller is aware of (foundation, flood, title, zoning, code violations)?
- Is there a deadline driving the sale (1031 exchange, divorce, estate, relocation)? That informs how much negotiation room exists.
- Schools are D-rated, which usually means shorter tenancies and higher turnover. Who's the typical renter profile here, and what's been the actual vacancy rate?
- Crime grade is F in this area — have there been break-ins, vandalism, or insurance claims at this property in the last 3 years? What carrier currently insures it and at what premium?
- The area grade is low — what's the realistic commute time and amenity access for the typical tenant pool here? Any planned neighborhood developments (good or bad) we should know about?
- What's the average days-on-market for RENTAL listings here right now (not sales)? A rising rental-DOM trend means longer vacancies and softer asking-rent achievability than the comps imply.
- What's the recent tenant-quality profile in this submarket — average credit score on applications, eviction rate, late-payment / NSF rate, and stable-employment percentage? A property-management company in the area should have these aggregated.
- How much new for-sale + rental construction is in the pipeline within 1–3 miles? Heavy new supply typically softens prices + rents 12–24 months out; constrained supply supports both.
Investment metrics
- 1% rule
- 0.90% ✗
- Cap rate
- 6.54%
- Cash-on-cash
- 0.89%
- DSCR
- 1.04
- GRM
- 9.2
CMA / ARV
No comps found within radius.
Projected returns pro-forma
3.0% appreciation · 3.0% rent growth · sell at horizon
- IRR
- 8.3%
- Equity multiple
- 1.48×
- Total profit
- $30,261
- Equity at exit
- $101,619
- IRR
- 10.9%
- Equity multiple
- 2.64×
- Total profit
- $103,591
- Equity at exit
- $156,607
Cash invested: $63,280 (down + closing). Projections, not guarantees.
Landlord ↔ Tenant lean methodology
- Overall (STATE)
- 90 Strongly Landlord-Friendly
- State South Carolina
- 90 Strongly Landlord-Friendly · R+6
- County
- — inherits STATE
- City
- — inherits STATE
ZIP-level market 29053-5555
- Active inventory
- 5
- Price-to-rent
- 9.2×
Monthly cashflow live
- Estimated rent
- $2,037 high interval (Pro) →
- Mortgage (P&I)
- −$1,185
- Tax est. 1.5%
- −$282 /mo · $3,390/yr
- Insurance
- −$94
- HOA
- −$0
- Vacancy / Maint / Mgmt
- −$428
- Net cashflow
- $47
Break-even live
UW: 25.0% down · 7.5% · 30yr · 1.5% tax · 5.0% vac · 8.0% maint · 8.0% mgmt
Financing live
Cash to close
- Down payment
- $56,500
- Closing costs
- $6,780
- Reserves months
- —
- Total cash needed
- —
Loan-product check · same deal, 3 products live
Conventional
25% down · 7.5% · 30yr
- Down + closing
- —
- Monthly P&I
- —
- Monthly cashflow
- —
- DSCR
- —
- Eligible?
- —
Personal DTI + credit; lowest rate.
DSCR
20% down · 8.5% · 30yr
- Down + closing
- —
- Monthly P&I
- —
- Monthly cashflow
- —
- DSCR
- —
- Eligible?
- —
No personal income docs; deal must DSCR.
Hard money
10% down · 12.0% · 12mo
- Down + closing
- —
- Monthly P&I
- —
- Monthly cashflow
- —
- DSCR
- —
- Eligible?
- —
Short-term bridge; refi at stabilization.
Rent comps 36 comps
| Address | Beds | Baths | Sqft | Rent | $/sqft | DOM | Units | Dist |
|---|---|---|---|---|---|---|---|---|
| 185 Winding Chestnut Dr Columbia, SC | 3.0 | 2.5 | 1335 | $1,975 | $1.48 | 23d | 1 | 0.06mi |
| 174 Winding Chestnut Dr Columbia, SC | 3.0 | 2.5 | 1335 | $1,875 | $1.40 | 23d | 1 | 0.07mi |
| 193 Winding Chestnut Dr Columbia, SC | 3.0 | 2.5 | 1335 | $1,975 | $1.48 | 23d | 1 | 0.08mi |
| 197 Winding Chestnut Dr Columbia, SC | 3.0 | 2.5 | 1335 | $1,875 | $1.40 | 23d | 1 | 0.08mi |
| 201 Winding Chestnut Dr Columbia, SC | 3.0 | 2.5 | 1335 | $1,975 | $1.48 | 23d | 1 | 0.09mi |
| 200 Winding Chestnut Dr Columbia, SC | 3.0 | 2.5 | 1335 | $1,975 | $1.48 | 23d | 1 | 0.10mi |
| 204 Winding Chestnut Dr Columbia, SC | 3.0 | 2.5 | 1335 | $1,875 | $1.40 | 23d | 1 | 0.10mi |
| 208 Winding Chestnut Dr Columbia, SC | 3.0 | 2.5 | 1335 | $2,125 | $1.59 | 2d | 1 | 0.11mi |
| 209 Winding Chestnut Dr Columbia, SC | 3.0 | 2.5 | 1335 | $2,125 | $1.59 | 2d | 1 | 0.11mi |
| 211 Winding Chestnut Dr Columbia, SC | 3.0 | 2.5 | 1335 | $2,025 | $1.52 | 2d | 1 | 0.12mi |
| 210 Winding Chestnut Dr Columbia, SC | 3.0 | 2.5 | 1335 | $2,025 | $1.52 | 2d | 1 | 0.12mi |
| 213 Winding Chestnut Dr Columbia, SC | 3.0 | 2.5 | 1335 | $2,025 | $1.52 | 2d | 1 | 0.12mi |
| 212 Winding Chestnut Dr Columbia, SC | 3.0 | 2.5 | 1335 | $2,025 | $1.52 | 2d | 1 | 0.12mi |
| 215 Winding Chestnut Dr Columbia, SC | 3.0 | 2.5 | 1335 | $2,125 | $1.59 | 2d | 1 | 0.12mi |
| 214 Winding Chestnut Dr Columbia, SC | 3.0 | 2.5 | 1335 | $2,125 | $1.59 | 2d | 1 | 0.12mi |
| 217 Winding Chestnut Dr Columbia, SC | 3.0 | 2.5 | 1335 | $2,125 | $1.59 | 2d | 1 | 0.13mi |
| 220 Winding Chestnut Dr Columbia, SC | 3.0 | 2.5 | 1335 | $2,125 | $1.59 | 2d | 1 | 0.13mi |
| 219 Winding Chestnut Dr Columbia, SC | 3.0 | 2.5 | 1335 | $2,025 | $1.52 | 2d | 1 | 0.13mi |
| 222 Winding Chestnut Dr Columbia, SC | 3.0 | 2.5 | 1335 | $2,025 | $1.52 | 2d | 1 | 0.14mi |
| 221 Winding Chestnut Dr Columbia, SC | 3.0 | 2.5 | 1335 | $2,025 | $1.52 | 2d | 1 | 0.14mi |
| 224 Winding Chestnut Dr Columbia, SC | 3.0 | 2.5 | 1335 | $2,025 | $1.52 | 2d | 1 | 0.14mi |
| 223 Winding Chestnut Dr Columbia, SC | 3.0 | 2.5 | 1335 | $2,125 | $1.59 | 2d | 1 | 0.14mi |
| 225 Winding Chestnut Dr Columbia, SC | 3.0 | 2.5 | 1335 | $2,125 | $1.59 | 2d | 1 | 0.15mi |
| 226 Winding Chestnut Dr Columbia, SC | 3.0 | 2.5 | 1335 | $2,125 | $1.59 | 2d | 1 | 0.15mi |
| 227 Winding Chestnut Dr Columbia, SC | 3.0 | 2.5 | 1335 | $2,025 | $1.52 | 2d | 1 | 0.15mi |
| 228 Winding Chestnut Dr Columbia, SC | 3.0 | 2.5 | 1335 | $2,125 | $1.59 | 2d | 1 | 0.15mi |
| 229 Winding Chestnut Dr Columbia, SC | 3.0 | 2.5 | 1335 | $2,025 | $1.52 | 2d | 1 | 0.15mi |
| 230 Winding Chestnut Dr Columbia, SC | 3.0 | 2.5 | 1335 | $2,025 | $1.52 | 2d | 1 | 0.16mi |
| 231 Winding Chestnut Dr Columbia, SC | 3.0 | 2.5 | 1335 | $2,125 | $1.59 | 2d | 1 | 0.16mi |
| 232 Winding Chestnut Dr Columbia, SC | 3.0 | 2.5 | 1335 | $2,025 | $1.52 | 2d | 1 | 0.16mi |
| 233 Winding Chestnut Dr Columbia, SC | 3.0 | 2.5 | 1335 | $2,125 | $1.59 | 2d | 1 | 0.16mi |
| 234 Winding Chestnut Dr Columbia, SC | 3.0 | 2.5 | 1335 | $2,125 | $1.59 | 2d | 1 | 0.16mi |
| 235 Winding Chestnut Dr Columbia, SC | 3.0 | 2.5 | 1335 | $2,025 | $1.52 | 2d | 1 | 0.17mi |
| 237 Winding Chestnut Dr Columbia, SC | 3.0 | 2.5 | 1335 | $2,125 | $1.59 | 2d | 1 | 0.17mi |
| 2 Beagle Ct Irmo, SC | 3.0 | 2.0 | 1289 | $1,849 | $1.43 | 11d | 1 | 1.00mi |
| 316 Stamport Cir Irmo, SC | 3.0 | 2.5 | 1500 | $1,575 | $1.05 | 3d | 1 | 1.46mi |
Listing history 13 events
-
2026-06-18days on market $225,999 Active 92 DOM
-
2026-06-17days on market $225,999 Active 91 DOM
-
2026-06-16days on market $225,999 Active 90 DOM
-
2026-06-15days on market $225,999 Active 89 DOM
-
2026-06-14days on market $225,999 Active 87 DOM
-
2026-06-13days on market $225,999 Active 86 DOM
-
2026-06-10days on market $225,999 Active 84 DOM
-
2026-06-09days on market $225,999 Active 83 DOM
-
2026-06-08days on market $225,999 Active 82 DOM
-
2026-06-07pricestatusdays on market $225,999 Active 81 DOM
-
2026-04-14status Pending
-
2026-02-06price $219,999
-
2026-01-26$216,999 Active
ⓘ Source: listings_history table (triggers on properties + properties_extension) + one-shot
backfill from property_details.listing_events for pre-trigger history.
Nearby sold comps map
Loading sold comps map…
Walkable amenities ~0.75 mi
Loading nearby amenities…
Taxation est. · year 1
- Rental income
- $24,441
- − Mortgage interest
- −$12,659
- − Property taxes
- −$3,390
- − Insurance
- −$1,130
- − Repairs & maintenance
- −$1,955
- − Management
- −$1,955
- − Depreciation
- −$6,575
- Taxable loss
- −$3,224
- Est. tax savings @ 24.0%
- +$774
- After-tax cash flow
- $1,340/yr
For passive investors: Depreciation is non-cash, so a rental often shows a tax loss while cash-flowing — sheltering income. Rental losses are passive: they offset passive income freely, and up to $25,000/yr can offset ordinary (W-2) income if you actively participate and your MAGI is under $100k (phasing out to $0 by $150k); unused losses carry forward. On sale, claimed depreciation is recaptured at up to 25%, and gains may owe capital-gains tax (a 1031 exchange can defer both). Figures are a year-1 estimate at your 24.0% rate — not tax advice; consult a CPA.
Schools (NCES district)
- District
- Lexington 05
- NCES district ID
- 4502820
- Math proficiency
- 47% ▼ -7.00%
- Reading proficiency
- 55% ▼ -4.00%
- Median HH income
- $67,732
- Composite
- 45.28/100
- National rank
- #2656
- State rank
- #5 of 80 in SC
Livability — Columbia
- Score
- 78/100
- State rank
- #18
- US rank
- #2436
Category grades
Schools grade is shown separately in the Schools card above.
Census & demographics
- Census place
- Columbia, SC
Population outlook (Richland County) Hauer SSP2
- Today (2025)
- 459,667 people
- By 2030
- 487,524 · +6.1%
- By 2040
- 542,035 · +17.9%
- By 2050
- 595,371 · +29.5%
- By 2075
- 732,998 · +59.5%
- By 2100
- 820,415 · +78.5%
Not yet ingested
- Political lean
- —
- Race & ethnicity
- —
- Common origin
- —
- Civics
- —
Market trends
- HPI YoY
- —
- Current HPI
- —
- Rent YoY
- —
- Metro
- —
- State GDP YoY
- ▲ 4.51%
- F500 in state
- 2
Industry mix (Fortune 500 HQ in SC)
| Industry | F500 HQs | Revenue |
|---|---|---|
| Packaging | 1 | $7B |
|
||
Price history
+1.4% since first listed3 events — show timeline
- 2026-04-14 Pending — Consolidated MLS
- 2026-02-06 Price Changed $219,999 Consolidated MLS
- 2026-01-26 Listed $216,999 Consolidated MLS
Cash-flow waterfall
monthlySold comps — $/sqft
last 12 mo · ≤1 miLoading sold comps…