 10-Plex
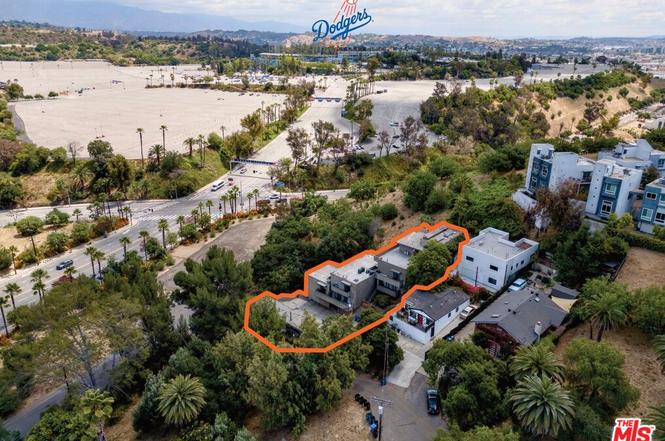
1188 Innes Ave · Los Angeles, CA
Flood risk 4/10 · Minor
- FEMA flood zone
- X (unshaded)
- Chance of flooding over 30 yrs
- 0.13%
- Est. flood insurance / yr
- $507 – $1,088
Fire risk 1/10 · Minimal
- Est. fire insurance / yr
- $659 – $1,223
Heat risk 5/10 · Moderate
- Hot days now (above 94°F)
- 7 days/yr
- Hot days in 30 yrs
- 21 days/yr
Wind risk 1/10 · Minimal
- Chance of severe wind over 30 yrs
- —
Air-quality risk 6/10 · Moderate
- Unhealthy air days now
- 11 days/yr
- Unhealthy air days in 30 yrs
- 12 days/yr
Risk factors via First Street. Map © Google.
Why this score? — see what drove the C- grade
The composite is a weighted blend of 9 inputs, each scored 0–100. Each bar is that input's sub-score; the figure is the points it added to the 100-point composite (weight × sub-score).
- Cash flow +21.5/30.0
- ARV discount +7.5/15.0
- DSCR +6.9/10.0
- 1% rule +5.7/10.0
- Condition / age +3.8/5.0
- Schools +3.6/10.0
- Livability +3.4/5.0
- Rent growth +2.5/5.0
- Appreciation +0.0/10.0
$3,500,000
🖨 Deal sheet 📄 Offer letter ✓ Due diligence
Multi-family units
County records classify this as Multi-Family (5+ Unit). Listing-text estimate: 10 units. confirmed
5+ unit building — per-unit beds/baths from public records are typically unavailable; the breakdown below (if shown) is an estimate from the listing text.
Listing remarks
We are proud to present for sale for the first time ever an architecturally distinct 10 Unit non-RSO apartment building in the Echo Park hills, right at the entrance to Dodger Stadium and very close to the scenic retreat that is Elysian Park! Designed by the innovative architect James Stevens, who began his career working at Frank Lloyd Wright's Taliesin West, then alongside renowned architect John Lautner, Stevens' work has been described as seamlessly blending form and function, creating spaces with "thoughtful integration of natural elements but also incredibly practical, " and envisioning spaces that "transcended conventional norms. " Lovingly maintained since the
Key facts
- Gated building
- Solar panels
- 0.29 acre lot
Tags
Property features AI
Finance
- Other: Listed As-Is; Possession at close of escrow; Located next to Dodger Stadium at the Vin Scully Ave entrance, just north of Sunset Blvd in the Echo Park area
- Financial info: Actual annual gross rent: $327,720; Gross operating income: $317,888; Net operating income: $212,389; Total annual expenses: $105,500; Cap rate: 6.07%; Gross rent multiplier: 10.68; Vacancy rate listed as 40%
- HOA & community: Complex contains 10 total units
Exterior
- Parking: Total of 11 parking spaces; All 11 covered parking spaces; Two-car attached garage structures (2 garage structures, 4 garage spaces total); Additional detached carport spaces (7 carport spaces); Concrete driveway; Side-by-side covered parking; gated and private garage options
- Security: Gated garage / parking
- Home design: Residential income property; Single building containing all units; Four total floors; Fee land
- Construction: Attached construction
- Exterior features: Property has a view; Other detached structures on the lot; Zoned QR3
Interior
- Bedrooms: Seven 1-bedroom units; Two 2-bedroom units; One 2-bedroom unit with 2 baths
- Bathrooms: Seven 1-bath units; Two 1-bath units; One 2-bath unit
- Heating & cooling: Central heating; Air conditioning
- Interior features: Attached building with common walls; Multi-level building; Has city, green belt and panoramic views
Neighborhood map
What this means for you Summary
Snapshot
- This is a 10 × 13-bed/11.0-bath units multifamily listed at $3.50M. Condition is rated good.
Deal economics
- At list price, monthly cash flow is $5k ($63k/yr) — positive. Per door: $527/mo.
- The deal already cash-flows at list — no discount required.
- Meets the 1% rule at list price ($37k rent vs $3.50M).
- Cap rate 8.1% vs local median 2.1% in Los Angeles — top-decile yield for the area; either an underpriced asset or a hidden risk that comps aren't pricing in. Stress-test before assuming the spread holds.
Location & tenants
- Location reads 68/100 on livability (#273 in CA) — a middle-class / working-renter tenant base. Strengths: amenities A+, commute A+, employment B; Watch: health & safety C-, schools D+, crime F.
- Los Angeles Unified (urban): math 29% / reading 54% proficiency, ranked #223 of 517 in CA (top 43%) — families likely to look elsewhere, expect single-tenant / working-renter base with shorter leases; 67% free/reduced lunch — lower-income household profile, screen leases tightly.
- Market conditions: Rents soft (-0.0%/yr); 179 active listings in the ZIP; solid renter incomes; 19,697 units permitted in Los Angeles County in 2024 (9,426 in 5+ unit buildings).
- At $37,286/mo this rent would consume 512% of the median local household income ($87k/yr) (locally 4974% of renters already pay >50% of income on rent) — very limited rent-growth headroom before tenants either downsize or default.
Forward outlook
- Local home prices are declining (-3.0%/yr); year-one equity from $24k of loan paydown is wiped out by about $105k of value loss. Plan a longer hold.
- Los Angeles County population projected at +9% by 2050 — modest demand growth; plan on rents tracking national, not racing it.
Negotiation context
- Only 8 days on market — expect competitive offers; lowballing is unlikely to land.
Risks & watch-outs
- Climate carrying-cost: extreme-heat days projected 7→21/yr by 2055 (HVAC capex compounding) — expect insurance premiums to compound above CPI over the hold.
Questions for the listing agent
- Can we see the unit-by-unit rent roll, current vacancy, and any below-market leases? What's the average tenancy length?
- What capital expenditures (roof, boiler, parking lot, exteriors) have been made in the last 5 years, and what's planned in the next 2?
- Is there a deadline driving the sale (1031 exchange, divorce, estate, relocation)? That informs how much negotiation room exists.
- Schools are D-rated, which usually means shorter tenancies and higher turnover. Who's the typical renter profile here, and what's been the actual vacancy rate?
- Crime grade is F in this area — have there been break-ins, vandalism, or insurance claims at this property in the last 3 years? What carrier currently insures it and at what premium?
- What's the average days-on-market for RENTAL listings here right now (not sales)? A rising rental-DOM trend means longer vacancies and softer asking-rent achievability than the comps imply.
- What's the recent tenant-quality profile in this submarket — average credit score on applications, eviction rate, late-payment / NSF rate, and stable-employment percentage? A property-management company in the area should have these aggregated.
- How much new apartment / multifamily construction is in the pipeline within 1–3 miles? Heavy new supply (>2% of stock underway) typically softens rents 12–24 months out; light construction supports rent growth.
Investment metrics
- 1% rule
- 1.07% ✓
- Cap rate
- 8.10%
- Cash-on-cash
- 6.45%
- DSCR
- 1.29
- GRM
- 7.8
CMA / ARV
No comps found within radius.
Projected returns pro-forma
-3.0% appreciation · 0.0% rent growth · sell at horizon
- IRR
- -9.8%
- Equity multiple
- 0.65×
- Total profit
- $-340,322
- Equity at exit
- $521,861
- IRR
- -5.1%
- Equity multiple
- 0.71×
- Total profit
- $-284,293
- Equity at exit
- $302,616
Cash invested: $980,000 (down + closing). Projections, not guarantees.
Landlord ↔ Tenant lean methodology
- Overall (CITY)
- 0 Strongly Tenant-Friendly
- State California
- 18 Strongly Tenant-Friendly · D+13
- County
- — inherits STATE
- City Los Angeles
- 0 Strongly Tenant-Friendly · D+22
ZIP-level market 90026
- Rents YoY
- -0.0%
- Active inventory
- 179
- Price-to-rent
- 78.2×
Monthly cashflow live
- Estimated rent
- $37,286 medium interval (Pro) →
- Mortgage (P&I)
- −$18,354
- Tax est. 1.5%
- −$4,375 /mo · $52,500/yr
- Insurance
- −$1,458
- HOA
- −$0
- Vacancy / Maint / Mgmt
- −$7,830
- Net cashflow
- $5,268
Break-even live
10-unit breakdown (identical units grouped — click to expand)
| Units | Beds | Baths | Est. rent |
|---|---|---|---|
| 10× units | 13 | 11 | $37,290 |
| #1 | 13 | 11 | $3,729 |
| #2 | 13 | 11 | $3,729 |
| #3 | 13 | 11 | $3,729 |
| #4 | 13 | 11 | $3,729 |
| #5 | 13 | 11 | $3,729 |
| #6 | 13 | 11 | $3,729 |
| #7 | 13 | 11 | $3,729 |
| #8 | 13 | 11 | $3,729 |
| #9 | 13 | 11 | $3,729 |
| #10 | 13 | 11 | $3,729 |
| Total (10 units) | $37,286 | ||
UW: 25.0% down · 7.5% · 30yr · 1.5% tax · 5.0% vac · 8.0% maint · 8.0% mgmt
Financing live
Cash to close
- Down payment
- $875,000
- Closing costs
- $105,000
- Reserves months
- —
- Total cash needed
- —
Loan-product check · same deal, 3 products live
Conventional
25% down · 7.5% · 30yr
- Down + closing
- —
- Monthly P&I
- —
- Monthly cashflow
- —
- DSCR
- —
- Eligible?
- —
Personal DTI + credit; lowest rate.
DSCR
20% down · 8.5% · 30yr
- Down + closing
- —
- Monthly P&I
- —
- Monthly cashflow
- —
- DSCR
- —
- Eligible?
- —
No personal income docs; deal must DSCR.
Hard money
10% down · 12.0% · 12mo
- Down + closing
- —
- Monthly P&I
- —
- Monthly cashflow
- —
- DSCR
- —
- Eligible?
- —
Short-term bridge; refi at stabilization.
Listing history 6 events
-
2026-06-18days on market $3,500,000 Active 8 DOM
-
2026-06-17days on market $3,500,000 Active 7 DOM
-
2026-06-16days on market $3,500,000 Active 6 DOM
-
2026-06-15days on market $3,500,000 Active 5 DOM
-
2026-06-13remarks 679-char remark
-
2026-06-13$3,500,000 Active 3 DOM
ⓘ Source: listings_history table (triggers on properties + properties_extension) + one-shot
backfill from property_details.listing_events for pre-trigger history.
Climate risk First Street
- Flood 4/10 Moderate FEMA zone X (unshaded) · 13% chance over 30 yrs
- Wildfire 1/10 Low
- Heat 5/10 Major 7 d/yr ≥94°F today · 21 d/yr by 30 yrs out
- Wind 1/10 Low
- Air quality 6/10 Major 11 unhealthy d/yr today · 12 by 30 yrs out
Nearby sold comps map
Loading sold comps map…
Walkable amenities ~0.75 mi
Loading nearby amenities…
Taxation est. · year 1
- Rental income
- $447,432
- − Mortgage interest
- −$196,054
- − Property taxes
- −$52,500
- − Insurance
- −$17,500
- − Repairs & maintenance
- −$35,795
- − Management
- −$35,795
- − Depreciation
- −$101,818
- Taxable income
- $7,970
- Est. tax owed @ 24.0%
- −$1,913
- After-tax cash flow
- $61,306/yr
For passive investors: Depreciation is non-cash, so a rental often shows a tax loss while cash-flowing — sheltering income. Rental losses are passive: they offset passive income freely, and up to $25,000/yr can offset ordinary (W-2) income if you actively participate and your MAGI is under $100k (phasing out to $0 by $150k); unused losses carry forward. On sale, claimed depreciation is recaptured at up to 25%, and gains may owe capital-gains tax (a 1031 exchange can defer both). Figures are a year-1 estimate at your 24.0% rate — not tax advice; consult a CPA.
Condition & rehab AI · 12 photos
This 10-unit apartment building is in good condition with a good condition score of 75. It has a cosmetic rehab level and requires minor maintenance. The highest-ROI updates are painting the exterior and replacing the water heater.
Value-add opportunities
- Both paint exterior — enhances curb appeal and resale value
- Both replace water heater — improves comfort and reduces maintenance costs
Renovation cost estimate screening
Value-add ROI direction
- Both paint exterior — enhances curb appeal and resale value ↑
- Both replace water heater — improves comfort and reduces maintenance costs ↑
ⓘ Cost ranges are severity-bucket heuristics (US national rule-of-thumb). Get contractor quotes + a written scope before underwriting a rehab budget.
Schools (NCES district)
- District
- Los Angeles Unified
- NCES district ID
- 0622710
- Math proficiency
- 29% ▼ -4.00%
- Reading proficiency
- 54% ▲ 10.00%
- Median HH income
- $50,403
- Composite
- 35.67/100
- National rank
- #4875
- State rank
- #223 of 517 in CA
Livability — Los Angeles
- Score
- 68/100
- State rank
- #273
- US rank
- #9237
Category grades
Schools grade is shown separately in the Schools card above.
Census & demographics
- Census place
- Los Angeles, CA
- County
- Los Angeles County · 9,444,647 people
- City population
- 3,838,149
- Metro
- Los Angeles-Long Beach-Anaheim, CA
- Population (ZIP)
- 62,692
- Household income
- $87,334
- Rent vs Own
- Severe rent burden
- 4974.0
Population outlook (Los Angeles County) Hauer SSP2
- Today (2025)
- 10,940,515 people
- By 2030
- 11,256,481 · +2.9%
- By 2040
- 11,729,929 · +7.2%
- By 2050
- 11,948,407 · +9.2%
- By 2075
- 11,818,114 · +8.0%
- By 2100
- 10,842,928 · -0.9%
Race, ethnicity, and origin ACS 2023
- Neighborhood character
- Diverse neighborhood (Simpson 0.67)
- Race & ethnicity
- Hispanic / Latino 46% White 31% Asian 13% Two or more races 13% Black 4% Native American 1%
- Hispanic origin (detail)
- Mexican 26%
- Common ancestry
- Lithuanian 2% Italian 2% Romanian 1%
- Foreign-born
- 34% · Canada, China, South Korea
- Languages at home
- 47% English-only · Spanish 39% Tagalog/Filipino 5% Chinese 2%
Political lean MEDSL · Los Angeles
- 2024 margin
- Solid D (+32.9) · D 64.8% · R 31.9% · Other 3.3%
- 2008→2024 swing
- -7.4pp toward R · 2008: 40.4pp · 2024: 32.9pp
- All cycles
- 2024: D+32.9 2020: D+44.2 2016: D+48.0 2012: D+40.0 2008: D+40.4
Not yet ingested
- Civics
- —
Market trends
- HPI YoY
- ▼ -1087.70%
- Current HPI
- 456.3465
- Rent YoY
- ▬ -0.01%
- Metro
- Los Angeles-Long Beach-Anaheim, CA
- State GDP YoY
- ▲ 3.21%
- F500 in state
- 116
Industry mix (Fortune 500 HQ in CA)
| Industry | F500 HQs | Revenue |
|---|---|---|
| Technology | 27 | $1,492B |
|
||
| Financial Services | 3 | $174B |
|
||
| Retail | 3 | $44B |
|
||
| Insurance | 3 | $26B |
|
||
| Media / Entertainment | 2 | $115B |
|
||
| Pharmaceuticals / Biotech | 2 | $62B |
|
||
Price history
1 event — show timeline
- 2026-06-10 Listed $3,500,000 TheMLS
Cash-flow waterfall
monthlySold comps — $/sqft
last 12 mo · ≤1 miLoading sold comps…