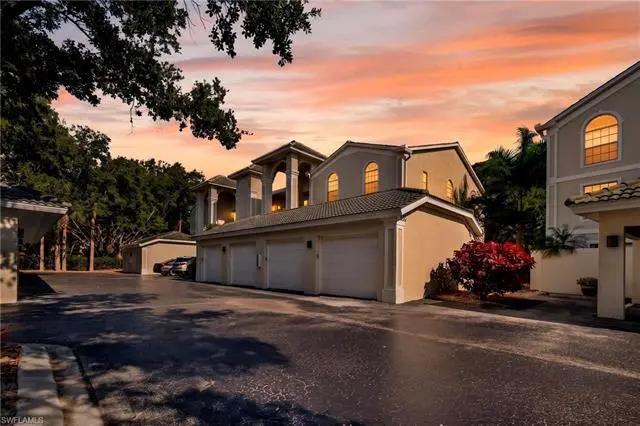
15395 Cedarwood Ln #104 · Bonita Springs, FL
Flood risk 7/10 · Major
- FEMA flood zone
- X (shaded)
- Chance of flooding over 30 yrs
- 0.94%
- Est. flood insurance / yr
- $507 – $1,088
Fire risk 3/10 · Minor
- Est. fire insurance / yr
- $947 – $1,759
Heat risk 10/10 · Severe
- Hot days now (above 107°F)
- 7 days/yr
- Hot days in 30 yrs
- 31 days/yr
Wind risk 10/10 · Severe
- Chance of severe wind over 30 yrs
- 99.0%
Air-quality risk 2/10 · Minimal
- Unhealthy air days now
- 1 days/yr
- Unhealthy air days in 30 yrs
- 1 days/yr
Risk factors via First Street. Map © Google.
Why this score? — see what drove the D+ grade
The composite is a weighted blend of 9 inputs, each scored 0–100. Each bar is that input's sub-score; the figure is the points it added to the 100-point composite (weight × sub-score).
- Cash flow +17.1/30.0
- ARV discount +7.5/15.0
- 1% rule +6.4/10.0
- DSCR +5.3/10.0
- Schools +5.0/10.0
- Livability +3.5/5.0
- Condition / age +2.5/5.0
- Rent growth +2.2/5.0
- Appreciation +0.0/10.0
$425,000
🖨 Deal sheet 📄 Offer letter ✓ Due diligence
Listing remarks
Enjoy the best of indoor-outdoor living with this rarely available “garden unit” in the highly desirable Bermuda Bay at Bay Forest—being offered turnkey furnished for immediate enjoyment. This first-floor end unit stands out with two private outdoor spaces, including a walled front patio perfect for gardening, grilling, or relaxing in your own secluded setting. You’ll also love the direct access from the attached one-car garage, allowing you to enter your home conveniently through the patio—no elevators or long hallways. Inside, the spacious layout features a large kitchen with ample cabinetry, pantry storage, and in-unit laundry for added convenience. The open
Key facts
- Screened rear lanai
- In-unit laundry
- Walled front patio
Tags
Property features AI
Finance
- Other: One unit per floor in the building; building contains 15 units; complex has 87 units; single-floor unit
- Financial info: Quarterly condo fee (listed); Total annual recurring fees reported; Total one-time fees reported
- HOA & community: Mandatory HOA; Quarterly condo fee; Professional management; Community amenities include clubhouse, community pool and spa, exercise room, tennis, pickleball, bocce, shuffleboard, bike/jog path, library, streetlights; Maintenance coverage: insurance, irrigation water, lawn/land maintenance, pest control (exterior), sewer, street maintenance, trash removal, water, reserve, manager, legal/accounting, master association fee included
Exterior
- Parking: Detached 1-car garage
- Security: Gated community
- Utilities: Central water (assessment paid); Central sewer (assessment paid); Cable available
- Home design: Residential low-rise building (1–3 stories); Built in 2001; Concrete block construction; Rear exposure faces southwest; Located in the Bay Forest development (Bermuda Bay, lot/unit 104); Regular lot, wooded area view
- Construction: Tile roof; Concrete block construction; Stucco finish; Built in 2001
- Exterior features: Courtyard; Shutters for storm protection; Single-hung windows; Stucco exterior
Interior
- Kitchen: Electric cooktop; Self-cleaning oven; Microwave; Dishwasher; Refrigerator / refrigerator-freezer
- Bedrooms: 2 bedrooms plus den
- Flooring: Carpet; Tile
- Bathrooms: 2 full bathrooms; Master bath with dual sinks and shower (no tub)
- Heating & cooling: Central electric heat; Central electric cooling
- Interior features: High-speed internet available; Smoke detectors; Walk-in closet; Split bedroom floor plan; Den (study); Family room; Screened lanai/porch; Dining area (family); Dining area (living); Turnkey furnished; Common elevator
- Laundry & utility: Washer and dryer included; Washer/dryer hookup; Laundry in residence
Neighborhood map
What this means for you Summary
Snapshot
- This is a 2-bed/2.0-bath condo listed at $425k.
Deal economics
- At list price, monthly cash flow is $228 ($3k/yr) — positive.
- The deal already cash-flows at list — no discount required.
- Meets the 1% rule at list price ($5k rent vs $425k).
- Recommended offer: $412k (3.0% below list) — sets the bar for market timing.
- Cap rate 7.1% vs local median 1.7% in Bonita Springs — top-decile yield for the area; either an underpriced asset or a hidden risk that comps aren't pricing in. Stress-test before assuming the spread holds.
Location & tenants
- Location reads 70/100 on livability (#428 in FL) — a middle-class / working-renter tenant base. Strengths: crime A+, housing A+, employment A; Watch: schools C-, cost of living C-, health & safety D.
- Collier (suburban): math 60% / reading 56% proficiency, ranked #16 of 73 in FL (top 22%) — acceptable for families but not a draw, mixed tenant base, ~2y average lease.
- Market conditions: Rents soft (-1.1%/yr); 595 active listings in the ZIP; 40 comparable units currently listed for rent nearby; rentals at typical pace (median 24d on market — plan ~3-4 weeks tenant-placement turnaround); solid renter incomes; 3,520 units permitted in Collier County in 2024 (959 in 5+ unit buildings).
- At $4,847/mo this rent would consume 60% of the median local household income ($98k/yr) (locally 1006% of renters already pay >50% of income on rent) — very limited rent-growth headroom before tenants either downsize or default.
Forward outlook
- Local home prices are declining (-3.0%/yr); year-one equity from $3k of loan paydown is wiped out by about $13k of value loss. Plan a longer hold.
- Collier County population projected at +30% by 2050 — long-run rental-demand tailwind backs the buy-and-hold thesis.
Negotiation context
- It's been on market 56 days — a 3% lower offer ($412k) is reasonable based on typical stale-listing flexibility.
- Current owner paid $165k; list at $425k implies a 158% gain — meaningful room to come down on a strong offer.
Risks & watch-outs
- Watch-outs: flood insurance adds $66/mo.
- Climate carrying-cost: major flood risk; severe wind risk, 99% chance of damaging wind over 30y; extreme-heat days projected 7→31/yr by 2055 (HVAC capex compounding) — expect insurance premiums to compound above CPI over the hold.
Questions for the listing agent
- It's been on market 56 days. Have you received any prior offers? Is the seller open to a 3% concession, seller financing, or rate buy-down credit?
- What's the actual annual flood-insurance premium (NFIP or private), and is the property in a SFHA with mandatory coverage?
- What does the HOA fee cover, when was the last increase, and are there any pending special assessments or reserve-fund shortfalls?
- Any open or pending special assessments — roof, HVAC, plumbing, elevator, façade? What's the per-unit balance and payoff schedule, and is the seller paying it off at close or rolling it to the buyer?
- Is there a deadline driving the sale (1031 exchange, divorce, estate, relocation)? That informs how much negotiation room exists.
- The area grade is low — what's the realistic commute time and amenity access for the typical tenant pool here? Any planned neighborhood developments (good or bad) we should know about?
- What's the average days-on-market for RENTAL listings here right now (not sales)? A rising rental-DOM trend means longer vacancies and softer asking-rent achievability than the comps imply.
- What's the recent tenant-quality profile in this submarket — average credit score on applications, eviction rate, late-payment / NSF rate, and stable-employment percentage? A property-management company in the area should have these aggregated.
- How much new apartment / multifamily construction is in the pipeline within 1–3 miles? Heavy new supply (>2% of stock underway) typically softens rents 12–24 months out; light construction supports rent growth.
Investment metrics
- 1% rule
- 1.14% ✓
- Cap rate
- 7.13%
- Cash-on-cash
- 2.97%
- DSCR
- 1.13
- GRM
- 7.3
CMA / ARV
No comps found within radius.
Projected returns pro-forma
-3.0% appreciation · 0.0% rent growth · sell at horizon
- IRR
- -16.7%
- Equity multiple
- 0.43×
- Total profit
- $-68,038
- Equity at exit
- $63,369
- IRR
- -17.0%
- Equity multiple
- 0.21×
- Total profit
- $-93,445
- Equity at exit
- $36,746
Cash invested: $119,000 (down + closing). Projections, not guarantees.
Landlord ↔ Tenant lean methodology
- Overall (STATE)
- 87 Strongly Landlord-Friendly
- State Florida
- 87 Strongly Landlord-Friendly · R+3
- County
- — inherits STATE
- City
- — inherits STATE
ZIP-level market 34110
- Rents YoY
- -1.1%
- Active inventory
- 595
- Price-to-rent
- 7.3×
Monthly cashflow live
- Estimated rent
- $4,847 high interval (Pro) →
- Mortgage (P&I)
- −$2,229
- Tax from tax record
- −$265 /mo · $3,180/yr
- Insurance
- −$177
- Flood insurance flood zone
- −$66 /mo · $798/yr
- HOA
- −$863
- Vacancy / Maint / Mgmt
- −$1,018
- Net cashflow
- $228
Break-even live
UW: 25.0% down · 7.5% · 30yr · 1.5% tax · 5.0% vac · 8.0% maint · 8.0% mgmt
Financing live
Cash to close
- Down payment
- $106,250
- Closing costs
- $12,750
- Reserves months
- —
- Total cash needed
- —
Loan-product check · same deal, 3 products live
Conventional
25% down · 7.5% · 30yr
- Down + closing
- —
- Monthly P&I
- —
- Monthly cashflow
- —
- DSCR
- —
- Eligible?
- —
Personal DTI + credit; lowest rate.
DSCR
20% down · 8.5% · 30yr
- Down + closing
- —
- Monthly P&I
- —
- Monthly cashflow
- —
- DSCR
- —
- Eligible?
- —
No personal income docs; deal must DSCR.
Hard money
10% down · 12.0% · 12mo
- Down + closing
- —
- Monthly P&I
- —
- Monthly cashflow
- —
- DSCR
- —
- Eligible?
- —
Short-term bridge; refi at stabilization.
Rent comps 40 comps
| Address | Beds | Baths | Sqft | Rent | $/sqft | DOM | Units | Dist |
|---|---|---|---|---|---|---|---|---|
| 15415 Cedarwood Ln Unit 3 Naples, FL | 2.0 | 2.0 | 1428 | $2,200 | $1.54 | 14d | 1 | 0.04mi |
| 285 Naples Cove Dr #1103 Naples, FL | 2.0 | 2.0 | 1267 | $2,475 | $1.95 | 23d | 1 | 0.05mi |
| 15400 Cedarwood Ln Unit 1-201 Naples, FL | 2.0 | 2.0 | 1286 | $6,000 | $4.67 | 23d | 1 | 0.07mi |
| 15400 Cedarwood Ln #102 Naples, FL | 2.0 | 2.0 | 1286 | $6,300 | $4.90 | 14d | 1 | 0.07mi |
| 270 Naples Cove Dr #3506 Naples, FL | 3.0 | 2.0 | 1475 | $2,500 | $1.69 | 21d | 1 | 0.08mi |
| 290 Naples Cove Dr Naples, FL | 2.0 | 2.0 | 1327 | $3,400 | $2.56 | 23d | 3 | 0.09mi |
| 15191 Cedarwood Ln #2602 Naples, FL | 2.0 | 2.0 | 1267 | $2,300 | $1.82 | 23d | 1 | 0.14mi |
| 15161 Cedarwood Ln Naples, FL | 2.0 | 2.0 | 1267 | $4,000 | $3.16 | 23d | 3 | 0.19mi |
| 386 Emerald Bay Cir Unit G4 Naples, FL | 3.0 | 2.0 | 1490 | $2,500 | $1.68 | 23d | 1 | 0.27mi |
| 341 Emerald Bay Cir Unit T5 Naples, FL | 3.0 | 2.0 | 1611 | $4,500 | $2.79 | 23d | 1 | 0.34mi |
| 306 Emerald Bay Cir Unit J8 Naples, FL | 2.0 | 2.0 | 1350 | $4,000 | $2.96 | 23d | 1 | 0.36mi |
| 306 Emerald Bay Cir Unit J5 Naples, FL | 3.0 | 2.0 | 1490 | $5,900 | $3.96 | 23d | 1 | 0.36mi |
| 298 Emerald Bay Cir Unit K6 Naples, FL | 2.0 | 2.0 | 1202 | $4,750 | $3.95 | 23d | 1 | 0.38mi |
| 505 Lake Louise Cir #101 Naples, FL | 2.0 | 2.0 | 1444 | $5,500 | $3.81 | 23d | 1 | 0.53mi |
| 1001 Arbor Lake Dr Naples, FL | 2.0–3.0 | 2.0–2.5 | 1755 | $3,800 | $2.16 | 23d | 2 | 0.54mi |
| 513 Lake Louise Cir #202 Naples, FL | 2.0 | 2.0 | 1444 | $5,300 | $3.67 | 23d | 1 | 0.60mi |
| 28940 Bermuda Pointe Cir #102 Bonita Springs, FL | 2.0 | 2.0 | 1076 | $5,500 | $5.11 | 23d | 1 | 0.61mi |
| 28720 Bermuda Bay Way #205 Bonita Springs, FL | 2.0 | 2.0 | 1097 | $2,200 | $2.01 | 14d | 1 | 0.72mi |
| 526 Lake Louise Cir Unit 4-403 Naples, FL | 3.0 | 2.0 | 1740 | $6,500 | $3.74 | 23d | 1 | 0.75mi |
| 14780 Glen Eden Dr Naples, FL | 3.0 | 2.5 | 2184 | $8,000 | $3.66 | 23d | 1 | 0.77mi |
| 28712 Carmel Way Bonita Springs, FL | 3.0 | 2.5 | 1626 | $9,250 | $5.69 | 23d | 1 | 0.84mi |
| 3930 Windward Passage Cir #202 Bonita Springs, FL | 2.0 | 2.0 | 1478 | $1,900 | $1.29 | 16d | 1 | 0.87mi |
| 999 E Valley Dr Unit 1073522P Bonita Springs, FL | 3.0 | 2.5 | 1668 | $9,929 | $5.95 | 21d | 1 | 0.87mi |
| 62 8th St Unit 1073526P Bonita Springs, FL | 2.0 | 2.0 | 1593 | $5,435 | $3.41 | 23d | 1 | 0.90mi |
| 28070 Winthrop Cir Bonita Springs, FL | 3.0 | 3.0 | 2008 | $12,000 | $5.98 | 23d | 1 | 0.91mi |
| 3951 Windward Passage Cir #102 Bonita Springs, FL | 2.0 | 2.0 | 1397 | $5,200 | $3.72 | 23d | 1 | 0.91mi |
| 265 Barefoot Beach Blvd Bonita Springs, FL | 2.0–3.0 | 2.0 | 1604 | $9,500 | $5.92 | 23d | 3 | 0.92mi |
| 265 Barefoot Beach Blvd #203 Bonita Springs, FL | 3.0 | 2.0 | 1604 | $13,000 | $8.10 | 13d | 1 | 0.93mi |
| 262 Barefoot Beach Blvd Bonita Springs, FL | 3.0 | 2.0–3.0 | 1864 | $10,500 | $5.63 | 23d | 2 | 0.93mi |
| 74 7th St Bonita Springs, FL | 3.0 | 2.0 | 1124 | $3,150 | $2.80 | 23d | 1 | 0.97mi |
| 28211 Winthrop Cir Bonita Springs, FL | 3.0 | 2.0 | 1918 | $10,500 | $5.47 | 23d | 1 | 0.97mi |
| 3941 Leeward Passage Ct #203 Bonita Springs, FL | 2.0 | 2.0 | 1204 | $2,000 | $1.66 | 23d | 1 | 0.97mi |
| 3921 Leeward Passage Ct #203 Bonita Springs, FL | 2.0 | 2.0 | 1204 | $3,500 | $2.91 | 23d | 1 | 0.99mi |
| 28650 Carriage Home Dr Unit 1049692P Bonita Springs, FL | 3.0 | 2.0 | 1528 | $3,980 | $2.60 | 16d | 1 | 1.07mi |
| 28450 Winthrop Cir Unit 1546014P Bonita Springs, FL | 3.0 | 2.0 | 1894 | $7,804 | $4.12 | 14d | 1 | 1.07mi |
| 211 6th St Bonita Springs, FL | 3.0 | 2.0 | 2000 | $11,900 | $5.95 | 23d | 1 | 1.07mi |
| 64 4th St Bonita Springs, FL | 2.0 | 2.0 | 1231 | $3,700 | $3.01 | 23d | 2 | 1.13mi |
| 28611 Carriage Home Dr #101 Bonita Springs, FL | 2.0 | 2.0 | 1433 | $2,550 | $1.78 | 23d | 1 | 1.15mi |
| 60 4th St Bonita Springs, FL | 3.0 | 2.0 | 1860 | $11,400 | $6.13 | 23d | 1 | 1.16mi |
| 255 Barefoot Beach Blvd Bonita Springs, FL | 2.0–3.0 | 2.0–3.5 | 1864 | $9,700 | $5.20 | 14d | 2 | 1.17mi |
HOA detail condo
- Monthly dues
- $863 · $10,356/yr
- Assessments
- None detected in remarks — confirm with the listing agent.
Listing history 12 events
-
2026-06-18days on market $425,000 Active 56 DOM
-
2026-06-17days on market $425,000 Active 55 DOM
-
2026-06-16days on market $425,000 Active 54 DOM
-
2026-06-15days on market $425,000 Active 53 DOM
-
2026-06-14days on market $425,000 Active 51 DOM
-
2026-06-10days on market $425,000 Active 48 DOM
-
2026-06-09days on market $425,000 Active 47 DOM
-
2026-06-08days on market $425,000 Active 46 DOM
-
2026-06-07days on market $425,000 Active 45 DOM
-
2026-06-03days on market $425,000 Active 41 DOM
-
2026-06-03remarks 669-char remark
-
2026-06-03$425,000 Active 40 DOM
ⓘ Source: listings_history table (triggers on properties + properties_extension) + one-shot
backfill from property_details.listing_events for pre-trigger history.
Tax reassessment forecast FL · Resets to sale price
- Current annual tax
- $3,180 · $265/mo
- Projected year-2 tax
- $3,528 · $294/mo
- Expected delta
- +$347/yr (+$29/mo · 10.9%)
ⓘ Screening estimate from a state-policy table — verify with the county assessor before closing.
Climate risk First Street
- Flood 7/10 Severe FEMA zone X (shaded) · 94% chance over 30 yrs
- Wildfire 3/10 Moderate
- Heat 10/10 Extreme 7 d/yr ≥107°F today · 31 d/yr by 30 yrs out
- Wind 10/10 Extreme 99% chance of damaging wind over 30 yrs
- Air quality 2/10 Low 1 unhealthy d/yr today · 1 by 30 yrs out
Nearby sold comps map
Loading sold comps map…
Walkable amenities ~0.75 mi
Loading nearby amenities…
Taxation est. · year 1
- Rental income
- $58,159
- − Mortgage interest
- −$23,807
- − Property taxes
- −$3,180
- − Insurance
- −$2,922
- − Repairs & maintenance
- −$4,653
- − Management
- −$4,653
- − HOA
- −$10,356
- − Depreciation
- −$12,364
- Taxable loss
- −$3,775
- Est. tax savings @ 24.0%
- +$906
- After-tax cash flow
- $3,648/yr
For passive investors: Depreciation is non-cash, so a rental often shows a tax loss while cash-flowing — sheltering income. Rental losses are passive: they offset passive income freely, and up to $25,000/yr can offset ordinary (W-2) income if you actively participate and your MAGI is under $100k (phasing out to $0 by $150k); unused losses carry forward. On sale, claimed depreciation is recaptured at up to 25%, and gains may owe capital-gains tax (a 1031 exchange can defer both). Figures are a year-1 estimate at your 24.0% rate — not tax advice; consult a CPA.
Schools (NCES district)
- District
- Collier
- NCES district ID
- 1200330
- Math proficiency
- 60% ▼ -4.00%
- Reading proficiency
- 56% ▼ -2.00%
- Median HH income
- $58,275
- Composite
- 50.23/100
- National rank
- #1892
- State rank
- #16 of 73 in FL
Livability — Bonita Springs
- Score
- 70/100
- State rank
- #428
- US rank
- #7576
Category grades
Schools grade is shown separately in the Schools card above.
Census & demographics
- County
- Collier County · 396,295 people
- City population
- 64,727
- Metro
- Naples-Marco Island, FL
- Population (ZIP)
- 25,630
- Household income
- $97,564
- Rent vs Own
- Severe rent burden
- 1006.0
Population outlook (Collier County) Hauer SSP2
- Today (2025)
- 420,858 people
- By 2030
- 450,054 · +6.9%
- By 2040
- 502,232 · +19.3%
- By 2050
- 544,932 · +29.5%
- By 2075
- 627,203 · +49.0%
- By 2100
- 659,015 · +56.6%
Race, ethnicity, and origin ACS 2023
- Neighborhood character
- Predominantly White (84%)
- Race & ethnicity
- White 84% Hispanic / Latino 10% Two or more races 9% Asian 2% Black 1%
- Hispanic origin (detail)
- Mexican 2% Puerto Rican 1% Cuban 3%
- Common ancestry
- Romanian 4% Lithuanian 3% Slovak 2%
- Foreign-born
- 11% · Canada, South Korea
- Languages at home
- 87% English-only · Spanish 7% Other Indo-European 3% French/Haitian/Cajun 1%
Political lean MEDSL · Collier
- 2024 margin
- Solid R (+33.1) · D 33.1% · R 66.2%
- 2008→2024 swing
- -10.6pp toward R · 2008: -22.5pp · 2024: -33.1pp
- All cycles
- 2024: R+33.1 2020: R+24.7 2016: R+26.0 2012: R+30.1 2008: R+22.5
Not yet ingested
- Civics
- —
Market trends
- HPI YoY
- ▼ -172.68%
- Current HPI
- 267.4644
- Rent YoY
- ▼ -1.06%
- Metro
- Naples-Marco Island, FL
- State GDP YoY
- ▲ 3.28%
- F500 in state
- 36
Industry mix (Fortune 500 HQ in FL)
| Industry | F500 HQs | Revenue |
|---|---|---|
| Industrial Technology | 2 | $29B |
|
||
| Insurance | 2 | $17B |
|
||
| Retail | 1 | $60B |
|
||
| Technology Distribution | 1 | $58B |
|
||
| Homebuilding | 1 | $35B |
|
||
| Technology Manufacturing | 1 | $35B |
|
||
Price history
+157.6% since first listed2 events — show timeline
- 2026-04-23 Listed $425,000 NAPLESMLS
- 2001-05-21 Sold (Public Records) $165,000 Public Records
Property tax history
+4.2%/yrLatest (2025): $3,180 · +1.5% YoY. Source: county tax records.
Cash-flow waterfall
monthlySold comps — $/sqft
last 12 mo · ≤1 miLoading sold comps…