 🔨 Auction
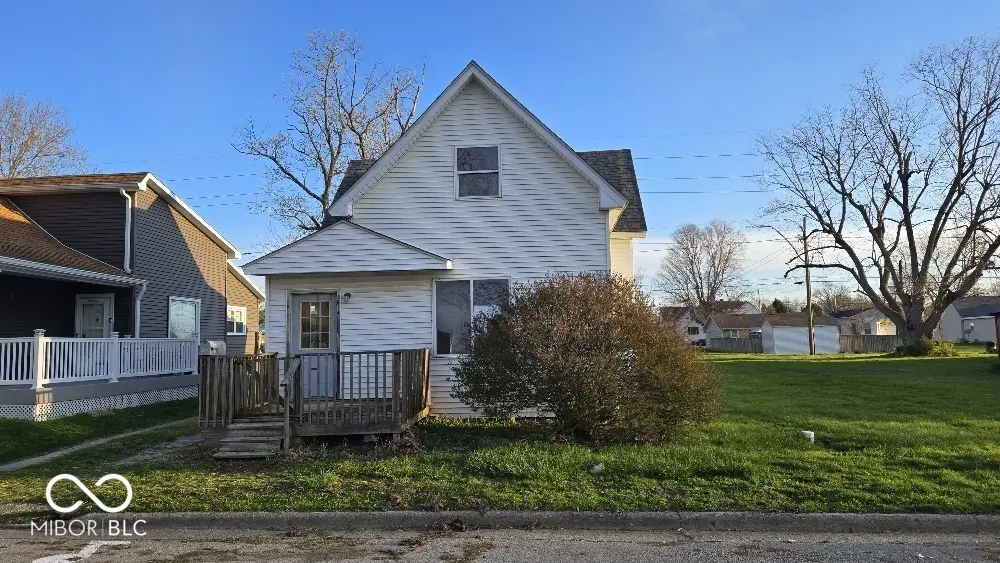
1914 S L St · Elwood, IN
Flood risk 1/10 · Minimal
- FEMA flood zone
- X (unshaded)
- Chance of flooding over 30 yrs
- 0.0%
- Est. flood insurance / yr
- $473 – $860
Fire risk 1/10 · Minimal
- Est. fire insurance / yr
- $717 – $1,331
Heat risk 3/10 · Minor
- Hot days now (above 102°F)
- 7 days/yr
- Hot days in 30 yrs
- 18 days/yr
Wind risk 2/10 · Minimal
- Chance of severe wind over 30 yrs
- —
Air-quality risk 4/10 · Minor
- Unhealthy air days now
- 3 days/yr
- Unhealthy air days in 30 yrs
- 5 days/yr
Risk factors via First Street. Map © Google.
Why this score? — see what drove the F grade
The composite is a weighted blend of 9 inputs, each scored 0–100. Each bar is that input's sub-score; the figure is the points it added to the 100-point composite (weight × sub-score).
- Cash flow +10.4/30.0
- ARV discount +7.5/15.0
- Livability +3.1/5.0
- DSCR +3.0/10.0
- Rent growth +2.5/5.0
- Condition / age +2.5/5.0
- 1% rule +1.9/10.0
- Schools +1.6/10.0
- Appreciation +0.0/10.0
$49,900
🖨 Deal sheet 📄 Offer letter ✓ Due diligence
Listing remarks MLS
Great investment opportunity on the southeast side of Elwood. This 2-3 bedroom home has tons of potential and sits on a desirable lot. The home is being sold through an auction (see below). Auction is from 4/27/2026 - 4/29/2026.
Key facts
- 5,400 sq ft lot
- Built 1896
- Listed 31 days
Neighborhood map
What this means for you Summary
Snapshot
- This is a 3-bed/1.0-bath single-family listed at $50k.
Deal economics
- At list price, monthly cash flow is $-87 ($-1k/yr) — negative.
- The deal already cash-flows at list — no discount required.
- Meets the 1% rule at list price ($1k rent vs $50k).
- Recommended offer: $48k (3.0% below list) — sets the bar for market timing.
Location & tenants
- Location reads 62/100 on livability (#482 in IN) — a middle-class / working-renter tenant base. Strengths: crime A+, cost of living A+, housing A+; Watch: schools F, amenities F, commute F.
- Elwood Community School Corporation (town): math 18% / reading 19% proficiency, ranked #283 of 301 in IN (top 94%) — low school quality limits family demand, transient renter base, plan for 1-2y turnover.
- Market conditions: 100 active listings in the ZIP; 8 comparable units currently listed for rent nearby; rentals leasing fast (median 2d on market — plan ~1-2 weeks tenant-placement turnaround); 184 units permitted in Madison County in 2024 (0 in 5+ unit buildings).
Forward outlook
- Local home prices are declining (-3.0%/yr); year-one equity from $1k of loan paydown is wiped out by about $5k of value loss. Plan a longer hold.
- Madison County population projected at -14% by 2050 — secular population decline; favor cash flow + early exit over multi-decade hold.
Negotiation context
- It's been on market 31 days — a 3% lower offer ($48k) is reasonable based on typical stale-listing flexibility.
- 3 sale attempts since 25y ago with the ask held roughly flat each time — persistent listings suggest the price (not the market) is what's stuck; bring a comps-based counter.
Risks & watch-outs
- Watch-outs: built in 1896 — expect roof / HVAC / electrical / plumbing capex.
Questions for the listing agent
- What do current leases actually rent for vs. the listed asking? Can we see a recent rent roll and the last 12 months of T-12 income?
- It's been on market 31 days. Have you received any prior offers? Is the seller open to a 3% concession, seller financing, or rate buy-down credit?
- Built in 1896 — when were the roof, HVAC, electrical panel, plumbing, and water heater last replaced?
- Is there a deadline driving the sale (1031 exchange, divorce, estate, relocation)? That informs how much negotiation room exists.
- Schools are F-rated, which usually means shorter tenancies and higher turnover. Who's the typical renter profile here, and what's been the actual vacancy rate?
- The area grade is low — what's the realistic commute time and amenity access for the typical tenant pool here? Any planned neighborhood developments (good or bad) we should know about?
- What's the average days-on-market for RENTAL listings here right now (not sales)? A rising rental-DOM trend means longer vacancies and softer asking-rent achievability than the comps imply.
- What's the recent tenant-quality profile in this submarket — average credit score on applications, eviction rate, late-payment / NSF rate, and stable-employment percentage? A property-management company in the area should have these aggregated.
- How much new for-sale + rental construction is in the pipeline within 1–3 miles? Heavy new supply typically softens prices + rents 12–24 months out; constrained supply supports both.
Investment metrics
- 1% rule
- 0.69% ✗
- Cap rate
- 5.66%
- Cash-on-cash
- -2.25%
- DSCR
- 0.90
- GRM
- 12.1
CMA / ARV
- ARV (median comp)
- $166,500
- List price
- $49,900
- Delta
- -70.03%
- Verdict
- UNDERPRICED
- Comps
- 20 within 1.0 mi
Show comp detail 12 sales within ~0.75 mi
| Address | Dist | Beds/Ba | Sqft | Sold | Price | $/sf | Match |
|---|---|---|---|---|---|---|---|
| 1815 S M St | 0.12mi | 3/2.0 | 1,041 (+7%) | 1mo | $158,000 | $152 | 79 |
| 2111 S I | 0.24mi | 2/1.0 (-1) | 960 (-2%) | 4mo | $140,000 | $146 | 77 |
| 1412 S 26th St | 0.46mi | 3/1.0 | 1,008 (+3%) | 11mo | $149,900 | $149 | 64 |
| 2232 S H St | 0.40mi | 2/1.0 (-1) | 870 (-11%) | 2mo | $70,000 | $80 | 56 |
| 1518 S G St | 0.40mi | 2/1.0 (-1) | 1,072 (+10%) | 6mo | $40,000 | $37 | 55 |
| 1304 S H St | 0.53mi | 2/1.0 (-1) | 886 (-9%) | 1mo | $89,000 | $100 | 54 |
| 2428 S C St | 0.72mi | 2/1.0 (-1) | 1,007 (+3%) | 7mo | $119,900 | $119 | 50 |
| 1300 S K St | 0.46mi | 2/1.0 (-1) | 850 (-13%) | 3mo | $146,900 | $173 | 50 |
| 10880 N 23rd St | 0.43mi | 2/1.0 (-1) | 866 (-11%) | 10mo | $152,000 | $176 | 48 |
| 2500 S N St | 0.43mi | 2/1.0 (-1) | 860 (-12%) | 9mo | $159,900 | $186 | 47 |
| 1924 S A St | 0.72mi | 2/2.0 (-1) | 983 (+1%) | 12mo | $140,000 | $142 | 46 |
| 1303 S D St | 0.66mi | 2/1.0 (-1) | 1,056 (+8%) | 11mo | $95,000 | $90 | 42 |
Match score weights: distance 35% · size 25% · config 20% · recency 20%. Top-matched comps best support the ARV.
Projected returns pro-forma
-3.0% appreciation · 3.0% rent growth · sell at horizon
- IRR
- -20.1%
- Equity multiple
- 0.30×
- Total profit
- $-32,629
- Equity at exit
- $24,826
- IRR
- -13.2%
- Equity multiple
- 0.23×
- Total profit
- $-35,909
- Equity at exit
- $14,396
Cash invested: $46,620 (down + closing). Projections, not guarantees.
Landlord ↔ Tenant lean methodology
- Overall (STATE)
- 90 Strongly Landlord-Friendly
- State Indiana
- 90 Strongly Landlord-Friendly · R+11
- County
- — inherits STATE
- City
- — inherits STATE
ZIP-level market 46036
- Home prices YoY
- -18.3%
- Active inventory
- 100
- Price-to-rent
- 3.6×
Monthly cashflow live
- Estimated rent
- $1,145 high interval (Pro) →
- Mortgage (P&I)
- −$873
- Tax from tax record
- −$50 /mo · $595/yr
- Insurance
- −$69
- HOA
- −$0
- Vacancy / Maint / Mgmt
- −$240
- Net cashflow
- $-87
Break-even live
UW: 25.0% down · 7.5% · 30yr · 1.5% tax · 5.0% vac · 8.0% maint · 8.0% mgmt
Financing live
Cash to close
- Down payment
- $41,625
- Closing costs
- $4,995
- Reserves months
- —
- Total cash needed
- —
Loan-product check · same deal, 3 products live
Conventional
25% down · 7.5% · 30yr
- Down + closing
- —
- Monthly P&I
- —
- Monthly cashflow
- —
- DSCR
- —
- Eligible?
- —
Personal DTI + credit; lowest rate.
DSCR
20% down · 8.5% · 30yr
- Down + closing
- —
- Monthly P&I
- —
- Monthly cashflow
- —
- DSCR
- —
- Eligible?
- —
No personal income docs; deal must DSCR.
Hard money
10% down · 12.0% · 12mo
- Down + closing
- —
- Monthly P&I
- —
- Monthly cashflow
- —
- DSCR
- —
- Eligible?
- —
Short-term bridge; refi at stabilization.
Rent comps 8 comps
| Address | Beds | Baths | Sqft | Rent | $/sqft | DOM | Units | Dist |
|---|---|---|---|---|---|---|---|---|
| 1775 Antler Ct Elwood, IN | 2.0 | 1.0 | 1000 | $935 | $0.94 | 1d | 1 | 0.54mi |
| 1349 S B St Unit 4 Elwood, IN | 2.0 | 1.0 | 950 | $1,400 | $1.47 | 12d | 1 | 0.68mi |
| 1349 S B St Unit 1 Elwood, IN | 2.0 | 1.0 | 850 | $1,250 | $1.47 | 14d | 1 | 0.68mi |
| 209 S 16th St Elwood, IN | 2.0 | 2.0 | 1060 | $1,135 | $1.07 | 1d | 1 | 0.70mi |
| 9401 Frans Way Elwood, IN | 1.0–2.0 | 1.0–2.0 | 815 | $1,325 | $1.63 | 1d | 6 | 0.76mi |
| 3033 S P St Elwood, IN | 2.0 | 1.0 | 576 | $925 | $1.61 | 1d | 1 | 0.84mi |
| 2107 N B St Elwood, IN | 2.0 | 1.0 | 672 | $1,100 | $1.64 | 16d | 1 | 0.91mi |
| 239 N 13th St Elwood, IN | 1.0–2.0 | 1.0 | 629 | $1,055 | $1.68 | 1d | 3 | 0.99mi |
Listing history 7 events
-
2026-05-08status Pending 230-char remark
Show marketing remark (230 chars)
Great investment opportunity on the southeast side of Elwood. This 2-3 bedroom home has tons of potential and sits on a desirable lot. The home is being sold through an auction (see below). Auction is from 4/27/2026 - 4/29/2026.
-
2026-04-06$49,900 Active 230-char remark
Show marketing remark (230 chars)
Great investment opportunity on the southeast side of Elwood. This 2-3 bedroom home has tons of potential and sits on a desirable lot. The home is being sold through an auction (see below). Auction is from 4/27/2026 - 4/29/2026.
-
2025-10-03soldstatus $70,307
-
2001-11-16soldstatus $4,900 51-char remark
Show marketing remark (51 chars)
**IINFORMATION DEEMED RELIABLE BUT NOT GUARANTEED**
-
2001-10-31historical
-
2001-10-02$7,500
-
2001-08-09$7,500 51-char remark
Show marketing remark (51 chars)
**IINFORMATION DEEMED RELIABLE BUT NOT GUARANTEED**
ⓘ Source: listings_history table (triggers on properties + properties_extension) + one-shot
backfill from property_details.listing_events for pre-trigger history.
Tax reassessment forecast IN · Partial reset (capped growth)
- Current annual tax
- $595 · $50/mo
- Projected year-2 tax
- $595 · $50/mo
- Expected delta
- $0/yr ($0/mo · 0.0%)
ⓘ Screening estimate from a state-policy table — verify with the county assessor before closing.
Climate risk First Street
- Flood 1/10 Low FEMA zone X (unshaded) · 0% chance over 30 yrs
- Wildfire 1/10 Low
- Heat 3/10 Moderate 7 d/yr ≥102°F today · 18 d/yr by 30 yrs out
- Wind 2/10 Low
- Air quality 4/10 Moderate 3 unhealthy d/yr today · 5 by 30 yrs out
Nearby sold comps map
Loading sold comps map…
Walkable amenities ~0.75 mi
Loading nearby amenities…
Taxation est. · year 1
- Rental income
- $13,742
- − Mortgage interest
- −$9,327
- − Property taxes
- −$595
- − Insurance
- −$832
- − Repairs & maintenance
- −$1,099
- − Management
- −$1,099
- − Depreciation
- −$4,844
- Taxable loss
- −$4,055
- Est. tax savings @ 24.0%
- +$973
- After-tax cash flow
- $-76/yr
For passive investors: Depreciation is non-cash, so a rental often shows a tax loss while cash-flowing — sheltering income. Rental losses are passive: they offset passive income freely, and up to $25,000/yr can offset ordinary (W-2) income if you actively participate and your MAGI is under $100k (phasing out to $0 by $150k); unused losses carry forward. On sale, claimed depreciation is recaptured at up to 25%, and gains may owe capital-gains tax (a 1031 exchange can defer both). Figures are a year-1 estimate at your 24.0% rate — not tax advice; consult a CPA.
Schools (NCES district)
- District
- Elwood Community School Corporation
- NCES district ID
- 1803300
- Math proficiency
- 18% ▼ -9.00%
- Reading proficiency
- 19% ▼ -9.00%
- Median HH income
- $38,757
- Composite
- 15.6/100
- National rank
- #9292
- State rank
- #283 of 301 in IN
Livability — Elwood
- Score
- 62/100
- State rank
- #482
- US rank
- #17050
Category grades
Schools grade is shown separately in the Schools card above.
Census & demographics
- Census place
- Elwood, IN
- County
- Madison County · 69,445 people
- City population
- 11,683
- Metro
- Indianapolis-Carmel-Anderson, IN
- Population (ZIP)
- 11,683
- Household income
- $62,074
- Rent vs Own
- Severe rent burden
- 225.0
Population outlook (Madison County) Hauer SSP2
- Today (2025)
- 125,800 people
- By 2030
- 122,640 · -2.5%
- By 2040
- 115,420 · -8.3%
- By 2050
- 108,148 · -14.0%
- By 2075
- 91,838 · -27.0%
- By 2100
- 75,670 · -39.8%
Race, ethnicity, and origin ACS 2023
- Neighborhood character
- Predominantly White (94%)
- Race & ethnicity
- White 94% Hispanic / Latino 3% Two or more races 3%
- Common ancestry
- Iranian 2% Italian 2% Slovak 1%
- Foreign-born
- 1% · Canada
- Languages at home
- 97% English-only · Spanish 2%
Political lean MEDSL · Madison
- 2024 margin
- Strong R (+26.9) · D 35.6% · R 62.5% · Other 1.9%
- 2008→2024 swing
- -33.5pp toward R · 2008: 6.5pp · 2024: -26.9pp
- All cycles
- 2024: R+26.9 2020: R+22.6 2016: R+25.7 2012: R+4.5 2008: D+6.5
Not yet ingested
- Civics
- —
Market trends
- HPI YoY
- ▼ -70.59%
- Current HPI
- 314.8526
- Rent YoY
- —
- Metro
- Indianapolis-Carmel-Anderson, IN
- State GDP YoY
- ▲ 2.90%
- F500 in state
- 18
Industry mix (Fortune 500 HQ in IN)
| Industry | F500 HQs | Revenue |
|---|---|---|
| Industrial Machinery | 2 | $37B |
|
||
| Healthcare | 1 | $177B |
|
||
| Pharmaceuticals | 1 | $45B |
|
||
| Metals / Steel | 1 | $18B |
|
||
| Agriculture | 1 | $17B |
|
||
| Packaging | 1 | $12B |
|
||
Price history
+565.3% since first listed7 events — show timeline
- 2026-05-08 Pending — MIBOR as Distributed by MLS Grid
- 2026-04-06 Listed $49,900 MIBOR as Distributed by MLS Grid
- 2025-10-03 Sold (Public Records) $70,307 Public Records
- 2001-11-16 Sold (MLS) $4,900 MIBOR as Distributed by MLS Grid
- 2001-10-31 Listing Removed — MIBOR as Distributed by MLS Grid
- 2001-10-02 Listed $7,500 MIBOR as Distributed by MLS Grid
- 2001-08-09 Listed $7,500 MIBOR as Distributed by MLS Grid
Property tax history
+8.6%/yrLatest (2024): $595 · +9.0% YoY. Source: county tax records.
Cash-flow waterfall
monthlySold comps — $/sqft
last 12 mo · ≤1 miLoading sold comps…