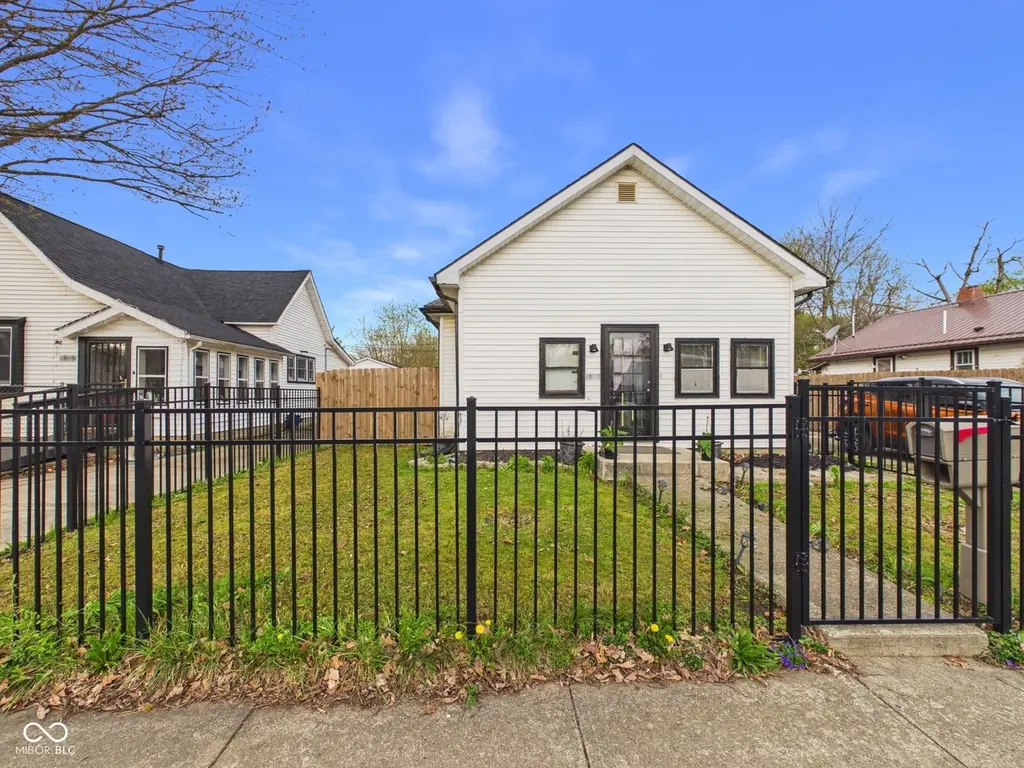
1817 Jefferson St · Anderson, IN
Flood risk 1/10 · Minimal
- FEMA flood zone
- X (unshaded)
- Chance of flooding over 30 yrs
- 0.0%
- Est. flood insurance / yr
- $473 – $860
Fire risk 1/10 · Minimal
- Est. fire insurance / yr
- $717 – $1,331
Heat risk 3/10 · Minor
- Hot days now (above 100°F)
- 7 days/yr
- Hot days in 30 yrs
- 18 days/yr
Wind risk 2/10 · Minimal
- Chance of severe wind over 30 yrs
- 0.0%
Air-quality risk 3/10 · Minor
- Unhealthy air days now
- 2 days/yr
- Unhealthy air days in 30 yrs
- 3 days/yr
Risk factors via First Street. Map © Google.
Why this score? — see what drove the D+ grade
The composite is a weighted blend of 9 inputs, each scored 0–100. Each bar is that input's sub-score; the figure is the points it added to the 100-point composite (weight × sub-score).
- Cash flow +17.7/30.0
- ARV discount +7.5/15.0
- DSCR +5.5/10.0
- Rent growth +4.5/5.0
- 1% rule +3.7/10.0
- Livability +3.0/5.0
- Condition / age +2.5/5.0
- Schools +1.6/10.0
- Appreciation +0.0/10.0
$120,000
🖨 Deal sheet 📄 Offer letter ✓ Due diligence
Listing remarks MLS
this spacious 4 bd 2 ba totally remodeled home is move in ready, New paint flooring, baths .appliances, top to bottom. This is a must see home ready for a large family or could be a rental There is nothing to do all rooms have been renovated Bathrooms have been totally updated new vanity's and toilets, The huge kitchen offers newer appliances gas stove,refrig,microhod,dishwasher washer and dryer. Just bring your clothes spacious mud room off back door. large living rm dinning rm 4 bedrms
Key facts
- 5,850 sq ft lot
- Built 1880
- Listed 4 days
Tags
Neighborhood map
What this means for you Summary
Snapshot
- This is a 2-bed/1.0-bath single-family listed at $120k.
Deal economics
- At list price, monthly cash flow is $97 ($1k/yr) — positive.
- The deal already cash-flows at list — no discount required.
- To meet the 1% rule (rent ≥ 1% of price), the offer needs to be $104k (13.0% below list).
- Recommended offer: $104k (13.0% below list) — sets the bar for 1% rule.
Location & tenants
- Location reads 60/100 on livability (#521 in IN) — a middle-class / working-renter tenant base. Strengths: cost of living A+, housing A+; Watch: schools F, crime D-, amenities F.
- Anderson Community School Corporation (urban): math 15% / reading 23% proficiency, ranked #280 of 301 in IN (top 93%) — low school quality limits family demand, transient renter base, plan for 1-2y turnover; 70% free/reduced lunch — lower-income household profile, screen leases tightly.
- Market conditions: Rents rising fast (+7.9%/yr); 185 active listings in the ZIP; 17 comparable units currently listed for rent nearby; rentals at typical pace (median 18d on market — plan ~3-4 weeks tenant-placement turnaround); lower-income renter base — watch delinquency; 184 units permitted in Madison County in 2024 (0 in 5+ unit buildings).
- This rent runs 35% of the median local income ($36k/yr) — at the standard rent-burdened threshold; future hikes will face affordability resistance.
Forward outlook
- Local home prices are declining (-3.0%/yr); year-one equity from $830 of loan paydown is wiped out by about $4k of value loss. Plan a longer hold.
- Madison County population projected at -14% by 2050 — secular population decline; favor cash flow + early exit over multi-decade hold.
- At projected returns (-3.0% appreciation + 7.9% rent growth), your $34k cash investment doubles in ~10 years — after that, you're playing with house money.
Negotiation context
- Only 4 days on market — expect competitive offers; lowballing is unlikely to land.
- 3 sale attempts since 15y ago with the ask held roughly flat each time — persistent listings suggest the price (not the market) is what's stuck; bring a comps-based counter.
- Current owner paid $42k; list at $120k implies a 186% gain — meaningful room to come down on a strong offer.
Risks & watch-outs
- Watch-outs: built in 1880 — expect roof / HVAC / electrical / plumbing capex.
Questions for the listing agent
- Built in 1880 — when were the roof, HVAC, electrical panel, plumbing, and water heater last replaced?
- Is there a deadline driving the sale (1031 exchange, divorce, estate, relocation)? That informs how much negotiation room exists.
- Schools are F-rated, which usually means shorter tenancies and higher turnover. Who's the typical renter profile here, and what's been the actual vacancy rate?
- Crime grade is D in this area — have there been break-ins, vandalism, or insurance claims at this property in the last 3 years? What carrier currently insures it and at what premium?
- The area grade is low — what's the realistic commute time and amenity access for the typical tenant pool here? Any planned neighborhood developments (good or bad) we should know about?
- What's the average days-on-market for RENTAL listings here right now (not sales)? A rising rental-DOM trend means longer vacancies and softer asking-rent achievability than the comps imply.
- What's the recent tenant-quality profile in this submarket — average credit score on applications, eviction rate, late-payment / NSF rate, and stable-employment percentage? A property-management company in the area should have these aggregated.
- How much new for-sale + rental construction is in the pipeline within 1–3 miles? Heavy new supply typically softens prices + rents 12–24 months out; constrained supply supports both.
Investment metrics
- 1% rule
- 0.87% ✗
- Cap rate
- 7.26%
- Cash-on-cash
- 3.47%
- DSCR
- 1.15
- GRM
- 9.6
CMA / ARV
- ARV (on-the-fly)
- $77,616
- Comps found
- 12
Show comp detail 12 sales within ~0.75 mi
| Address | Dist | Beds/Ba | Sqft | Sold | Price | $/sf | Match |
|---|---|---|---|---|---|---|---|
| 1830 Jefferson St | 0.04mi | 2/1.0 | 1,664 (+5%) | 0mo | $45,000 | $27 | 90 |
| 2111 Central Ave | 0.38mi | 3/1.0 (+1) | 1,611 (+2%) | 2mo | $77,000 | $48 | 72 |
| 2011 Mckinley St | 0.17mi | 3/2.0 (+1) | 1,694 (+7%) | 1mo | $115,000 | $68 | 71 |
| 2120 George St | 0.23mi | 2/1.0 | 1,431 (-10%) | 3mo | $70,000 | $49 | 70 |
| 2116 George St | 0.22mi | 2/1.0 | 1,753 (+11%) | 2mo | $75,000 | $43 | 70 |
| 725 E 27th St | 0.62mi | 3/1.0 (+1) | 1,596 (+1%) | 2mo | $55,000 | $34 | 63 |
| 718 Ruddle Ave | 0.71mi | 3/1.5 (+1) | 1,630 (+3%) | 0mo | $70,000 | $43 | 54 |
| 812 Chestnut St | 0.74mi | 3/2.0 (+1) | 1,539 (-3%) | 0mo | $76,000 | $49 | 52 |
| 2122 Fletcher St | 0.32mi | 3/2.0 (+1) | 1,362 (-14%) | 6mo | $152,400 | $112 | 47 |
| 803 Cottage Ave | 0.68mi | 3/2.0 (+1) | 1,479 (-7%) | 2mo | $104,000 | $70 | 46 |
| 914 Chestnut St | 0.67mi | 2/1.0 | 1,809 (+14%) | 2mo | $90,000 | $50 | 44 |
| 2803 E Lynn St | 0.72mi | 3/1.0 (+1) | 1,358 (-14%) | 2mo | $160,000 | $118 | 36 |
Match score weights: distance 35% · size 25% · config 20% · recency 20%. Top-matched comps best support the ARV.
Projected returns pro-forma
-3.0% appreciation · 7.88% rent growth · sell at horizon
- IRR
- -6.1%
- Equity multiple
- 0.76×
- Total profit
- $-7,929
- Equity at exit
- $17,892
- IRR
- 8.2%
- Equity multiple
- 1.75×
- Total profit
- $25,290
- Equity at exit
- $10,375
Cash invested: $33,600 (down + closing). Projections, not guarantees.
Landlord ↔ Tenant lean methodology
- Overall (STATE)
- 90 Strongly Landlord-Friendly
- State Indiana
- 90 Strongly Landlord-Friendly · R+11
- County
- — inherits STATE
- City
- — inherits STATE
ZIP-level market 46016
- Home prices YoY
- -3.5%
- Rents YoY
- 7.9%
- Active inventory
- 185
- Price-to-rent
- 9.6×
Monthly cashflow live
- Estimated rent
- $1,044 high interval (Pro) →
- Mortgage (P&I)
- −$629
- Tax from tax record
- −$48 /mo · $582/yr
- Insurance
- −$50
- HOA
- −$0
- Vacancy / Maint / Mgmt
- −$219
- Net cashflow
- $97
Break-even live
UW: 25.0% down · 7.5% · 30yr · 1.5% tax · 5.0% vac · 8.0% maint · 8.0% mgmt
Financing live
Cash to close
- Down payment
- $30,000
- Closing costs
- $3,600
- Reserves months
- —
- Total cash needed
- —
Loan-product check · same deal, 3 products live
Conventional
25% down · 7.5% · 30yr
- Down + closing
- —
- Monthly P&I
- —
- Monthly cashflow
- —
- DSCR
- —
- Eligible?
- —
Personal DTI + credit; lowest rate.
DSCR
20% down · 8.5% · 30yr
- Down + closing
- —
- Monthly P&I
- —
- Monthly cashflow
- —
- DSCR
- —
- Eligible?
- —
No personal income docs; deal must DSCR.
Hard money
10% down · 12.0% · 12mo
- Down + closing
- —
- Monthly P&I
- —
- Monthly cashflow
- —
- DSCR
- —
- Eligible?
- —
Short-term bridge; refi at stabilization.
Rent comps 17 comps
| Address | Beds | Baths | Sqft | Rent | $/sqft | DOM | Units | Dist |
|---|---|---|---|---|---|---|---|---|
| 2023 McKinley St Anderson, IN | 2.0 | 1.0 | 1500 | $950 | $0.63 | 43d | 1 | 0.19mi |
| 229 W 19th St Anderson, IN | 3.0 | 1.0 | 1200 | $1,000 | $0.83 | 43d | 1 | 0.66mi |
| 1023 E 8th St Unit 3 Anderson, IN | 2.0 | 1.5 | 1200 | $1,175 | $0.98 | 7d | 1 | 0.72mi |
| 228 E 29th St Anderson, IN | 3.0 | 2.0 | 1440 | $1,295 | $0.90 | 4d | 1 | 0.77mi |
| 1318 E 28th St Anderson, IN | 3.0 | 1.0 | 1280 | $1,300 | $1.02 | 12d | 1 | 0.79mi |
| 120 W 10th St Anderson, IN | 1.0–3.0 | 1.0 | 1066 | $1,025 | $0.96 | 1d | 1 | 0.81mi |
| 3006 Noble St Anderson, IN | 2.0 | 1.0 | 1064 | $995 | $0.94 | 7d | 1 | 0.82mi |
| 2627 Chase St Anderson, IN | 3.0 | 1.0 | 1050 | $850 | $0.81 | 17d | 1 | 0.91mi |
| 2233 Fairview St Anderson, IN | 3.0 | 1.5 | 1452 | $1,195 | $0.82 | 23d | 1 | 0.93mi |
| 3021 Delaware St Anderson, IN | 2.0 | 1.0 | 1154 | $1,150 | $1.00 | 7d | 1 | 1.01mi |
| 706 University Blvd Anderson, IN | 2.0 | 1.0 | 1250 | $1,050 | $0.84 | 2d | 1 | 1.07mi |
| 1502 Cedar St Anderson, IN | 2.0 | 1.0 | 1104 | $850 | $0.77 | 43d | 1 | 1.18mi |
| 510 W 5th St Anderson, IN | 3.0 | 1.5 | 1617 | $995 | $0.62 | 43d | 1 | 1.21mi |
| 921 W 9th St Anderson, IN | 3.0 | 2.0 | 1611 | $1,375 | $0.85 | 23d | 1 | 1.23mi |
| 820 W 7th St Apt A Anderson, IN | 2.0 | 2.0 | 1400 | $1,200 | $0.86 | 23d | 1 | 1.24mi |
| 1310 W 13th St Anderson, IN | 2.0 | 1.0 | 1178 | $895 | $0.76 | 2d | 1 | 1.37mi |
| 1121 Victory Ct Anderson, IN | 3.0 | 1.0 | 2053 | $1,295 | $0.63 | 21d | 1 | 1.47mi |
Listing history 7 events
-
2026-04-19status Pending
-
2026-04-14$120,000 Active
-
2017-05-12soldstatus $42,000 Sold 493-char remark
Show marketing remark (493 chars)
this spacious 4 bd 2 ba totally remodeled home is move in ready, New paint flooring, baths .appliances, top to bottom. This is a must see home ready for a large family or could be a rental There is nothing to do all rooms have been renovated Bathrooms have been totally updated new vanity's and toilets, The huge kitchen offers newer appliances gas stove,refrig,microhod,dishwasher washer and dryer. Just bring your clothes spacious mud room off back door. large living rm dinning rm 4 bedrms
-
2017-04-22status Pending 493-char remark
Show marketing remark (493 chars)
this spacious 4 bd 2 ba totally remodeled home is move in ready, New paint flooring, baths .appliances, top to bottom. This is a must see home ready for a large family or could be a rental There is nothing to do all rooms have been renovated Bathrooms have been totally updated new vanity's and toilets, The huge kitchen offers newer appliances gas stove,refrig,microhod,dishwasher washer and dryer. Just bring your clothes spacious mud room off back door. large living rm dinning rm 4 bedrms
-
2017-01-16$43,900 Active 493-char remark
Show marketing remark (493 chars)
this spacious 4 bd 2 ba totally remodeled home is move in ready, New paint flooring, baths .appliances, top to bottom. This is a must see home ready for a large family or could be a rental There is nothing to do all rooms have been renovated Bathrooms have been totally updated new vanity's and toilets, The huge kitchen offers newer appliances gas stove,refrig,microhod,dishwasher washer and dryer. Just bring your clothes spacious mud room off back door. large living rm dinning rm 4 bedrms
-
2011-11-18historical
-
2011-05-17$45,000
ⓘ Source: listings_history table (triggers on properties + properties_extension) + one-shot
backfill from property_details.listing_events for pre-trigger history.
Tax reassessment forecast IN · Partial reset (capped growth)
- Current annual tax
- $582 · $48/mo
- Projected year-2 tax
- $801 · $67/mo
- Expected delta
- +$219/yr (+$18/mo · 37.7%)
ⓘ Screening estimate from a state-policy table — verify with the county assessor before closing.
Climate risk First Street
- Flood 1/10 Low FEMA zone X (unshaded) · 0% chance over 30 yrs
- Wildfire 1/10 Low
- Heat 3/10 Moderate 7 d/yr ≥100°F today · 18 d/yr by 30 yrs out
- Wind 2/10 Low 0% chance of damaging wind over 30 yrs
- Air quality 3/10 Moderate 2 unhealthy d/yr today · 3 by 30 yrs out
Nearby sold comps map
Loading sold comps map…
Walkable amenities ~0.75 mi
Loading nearby amenities…
Taxation est. · year 1
- Rental income
- $12,529
- − Mortgage interest
- −$6,722
- − Property taxes
- −$582
- − Insurance
- −$600
- − Repairs & maintenance
- −$1,002
- − Management
- −$1,002
- − Depreciation
- −$3,491
- Taxable loss
- −$870
- Est. tax savings @ 24.0%
- +$209
- After-tax cash flow
- $1,374/yr
For passive investors: Depreciation is non-cash, so a rental often shows a tax loss while cash-flowing — sheltering income. Rental losses are passive: they offset passive income freely, and up to $25,000/yr can offset ordinary (W-2) income if you actively participate and your MAGI is under $100k (phasing out to $0 by $150k); unused losses carry forward. On sale, claimed depreciation is recaptured at up to 25%, and gains may owe capital-gains tax (a 1031 exchange can defer both). Figures are a year-1 estimate at your 24.0% rate — not tax advice; consult a CPA.
Schools (NCES district)
- District
- Anderson Community School Corporation
- NCES district ID
- 1800150
- Math proficiency
- 15% ▼ -14.00%
- Reading proficiency
- 23% ▼ -7.00%
- Median HH income
- $38,208
- Composite
- 15.93/100
- National rank
- #9250
- State rank
- #280 of 301 in IN
Livability — Anderson
- Score
- 60/100
- State rank
- #521
- US rank
- #18709
Category grades
Schools grade is shown separately in the Schools card above.
Census & demographics
- Census place
- Anderson, IN
- County
- Madison County · 69,445 people
- City population
- 57,762
- Metro
- Indianapolis-Carmel-Anderson, IN
- Population (ZIP)
- 17,834
- Household income
- $36,029
- Rent vs Own
- Severe rent burden
- 1193.0
Population outlook (Madison County) Hauer SSP2
- Today (2025)
- 125,800 people
- By 2030
- 122,640 · -2.5%
- By 2040
- 115,420 · -8.3%
- By 2050
- 108,148 · -14.0%
- By 2075
- 91,838 · -27.0%
- By 2100
- 75,670 · -39.8%
Race, ethnicity, and origin ACS 2023
- Neighborhood character
- Diverse neighborhood (Simpson 0.58)
- Race & ethnicity
- White 61% Black 18% Hispanic / Latino 13% Two or more races 11% Native American 1%
- Hispanic origin (detail)
- Mexican 10% Puerto Rican 1%
- Common ancestry
- Italian 2% Slovak 1% Iranian 1%
- Foreign-born
- 4% · Canada
- Languages at home
- 86% English-only · Spanish 12%
Political lean MEDSL · Madison
- 2024 margin
- Strong R (+26.9) · D 35.6% · R 62.5% · Other 1.9%
- 2008→2024 swing
- -33.5pp toward R · 2008: 6.5pp · 2024: -26.9pp
- All cycles
- 2024: R+26.9 2020: R+22.6 2016: R+25.7 2012: R+4.5 2008: D+6.5
Not yet ingested
- Civics
- —
Market trends
- HPI YoY
- ▼ -11.12%
- Current HPI
- 302.7437
- Rent YoY
- ▲ 7.88%
- Metro
- Indianapolis-Carmel-Anderson, IN
- State GDP YoY
- ▲ 2.90%
- F500 in state
- 18
Industry mix (Fortune 500 HQ in IN)
| Industry | F500 HQs | Revenue |
|---|---|---|
| Industrial Machinery | 2 | $37B |
|
||
| Healthcare | 1 | $177B |
|
||
| Pharmaceuticals | 1 | $45B |
|
||
| Metals / Steel | 1 | $18B |
|
||
| Agriculture | 1 | $17B |
|
||
| Packaging | 1 | $12B |
|
||
Price history
+166.7% since first listed7 events — show timeline
- 2026-04-19 Pending — MIBOR as Distributed by MLS Grid
- 2026-04-14 Listed $120,000 MIBOR as Distributed by MLS Grid
- 2017-05-12 Sold (MLS) $42,000 MIBOR as Distributed by MLS Grid
- 2017-04-22 Pending — MIBOR as Distributed by MLS Grid
- 2017-01-16 Listed $43,900 MIBOR as Distributed by MLS Grid
- 2011-11-18 Listing Removed — MIBOR as Distributed by MLS Grid
- 2011-05-17 Listed $45,000 MIBOR as Distributed by MLS Grid
Property tax history
-1.3%/yrLatest (2024): $582 · +6.8% YoY. Source: county tax records.
Cash-flow waterfall
monthlySold comps — $/sqft
last 12 mo · ≤1 miLoading sold comps…