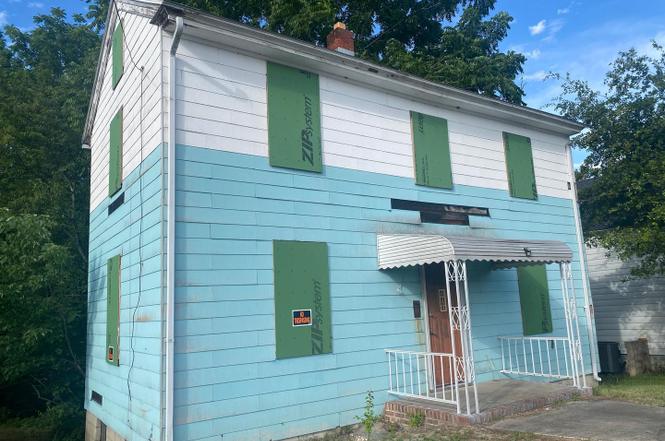
1107 W 6th St · Laurel, DE
Flood risk 1/10 · Minimal
- FEMA flood zone
- X (unshaded)
- Chance of flooding over 30 yrs
- 0.0%
- Est. flood insurance / yr
- $473 – $860
Fire risk 1/10 · Minimal
- Est. fire insurance / yr
- $476 – $884
Heat risk 8/10 · Major
- Hot days now (above 105°F)
- 7 days/yr
- Hot days in 30 yrs
- 16 days/yr
Wind risk 6/10 · Moderate
- Chance of severe wind over 30 yrs
- 75.0%
Air-quality risk 3/10 · Minor
- Unhealthy air days now
- 2 days/yr
- Unhealthy air days in 30 yrs
- 2 days/yr
Risk factors via First Street. Map © Google.
Why this score? — see what drove the B+ grade
The composite is a weighted blend of 9 inputs, each scored 0–100. Each bar is that input's sub-score; the figure is the points it added to the 100-point composite (weight × sub-score).
- Cash flow +30.0/30.0
- DSCR +10.0/10.0
- Appreciation +10.0/10.0
- 1% rule +9.1/10.0
- ARV discount +7.5/15.0
- Livability +3.2/5.0
- Rent growth +2.5/5.0
- Condition / age +2.5/5.0
- Schools +1.8/10.0
$119,900
🖨 Deal sheet 📄 Offer letter ✓ Due diligence
Listing remarks
Investor Alert! Opportunity knocks with this 3-bedroom, 1-bath farmhouse situated on a scenic lot with a wooded backyard backing to Broad Creek. This property is being sold as-is and is ready for renovation, restoration, or redevelopment. Features include low town water and sewer bills, and plenty of potential for the right buyer. Existing plywood window treatments are included, along with remaining contents and debris currently on the property. Bring your vision, tools, and creativity- the possibilities are endless!11
Key facts
- Wooded backyard
- Ready for renovation
- Plenty of potential
Tags
Property features AI
Finance
- Other: Fee simple ownership; Not in a federal flood zone; Ground rent paid annually
Exterior
- Parking: Driveway parking (1 space)
- Utilities: Public water; Public sewer; Electric heating and cooling fuel; Cable TV available; Cable internet service; Municipal trash service
- Home design: Detached single-family home; Main entrance faces south; Major rehab needed
- Construction: Stick-built construction; Block foundation; Shingle roof; Building not winterized; Year built per assessor
- Exterior features: Backs to trees; Above- and below-grade structures noted
Interior
- Bedrooms: Three bedrooms on the upper level
- Flooring: Carpet; Vinyl
- Bathrooms: One full bathroom
- Heating & cooling: Forced air heating (electric); Ceiling fans for cooling; Electric hot water
- Interior features: Drywall walls and ceilings; Unfinished basement
Neighborhood map
What this means for you Summary
Snapshot
- This is a 3-bed/1.0-bath single-family listed at $120k.
Deal economics
- At list price, monthly cash flow is $612 ($7k/yr) — positive.
- The deal already cash-flows at list — no discount required.
- Meets the 1% rule at list price ($2k rent vs $120k).
- Cap rate 12.4% vs local median 3.9% in Laurel — top-decile yield for the area; either an underpriced asset or a hidden risk that comps aren't pricing in. Stress-test before assuming the spread holds.
Location & tenants
- Location reads 63/100 on livability (#57 in DE) — a middle-class / working-renter tenant base. Strengths: cost of living A+, health & safety A+, housing A; Watch: employment D+, schools F, crime F.
- Laurel School District (suburban): math 15% / reading 27% proficiency, ranked #25 of 26 in DE (top 96%) — low school quality limits family demand, transient renter base, plan for 1-2y turnover.
- Market conditions: 92 active listings in the ZIP; 1 comparable units currently listed for rent nearby; 4,354 units permitted in Sussex County in 2024 (344 in 5+ unit buildings).
Forward outlook
- In year one you build about $13k of equity ($829 loan paydown + $12k appreciation (10.0% local appreciation)).
- Sussex County population projected at +25% by 2050 — long-run rental-demand tailwind backs the buy-and-hold thesis.
- At projected returns (10.0% appreciation + 3.0% rent growth), your $34k cash investment doubles in ~2 years — after that, you're playing with house money.
- By year 3, paydown + projected appreciation supports a ~$32k cash-out refi (75% LTV) — recoverable capital for the next deal without selling this one.
Negotiation context
- Only 1 days on market — expect competitive offers; lowballing is unlikely to land.
Risks & watch-outs
- Climate carrying-cost: major wind risk, 75% chance of damaging wind over 30y; extreme-heat days projected 7→16/yr by 2055 (HVAC capex compounding) — expect insurance premiums to compound above CPI over the hold.
Questions for the listing agent
- Built in 1960 — when were the roof, HVAC, electrical panel, plumbing, and water heater last replaced?
- Is there a deadline driving the sale (1031 exchange, divorce, estate, relocation)? That informs how much negotiation room exists.
- Schools are F-rated, which usually means shorter tenancies and higher turnover. Who's the typical renter profile here, and what's been the actual vacancy rate?
- Crime grade is F in this area — have there been break-ins, vandalism, or insurance claims at this property in the last 3 years? What carrier currently insures it and at what premium?
- What's the average days-on-market for RENTAL listings here right now (not sales)? A rising rental-DOM trend means longer vacancies and softer asking-rent achievability than the comps imply.
- What's the recent tenant-quality profile in this submarket — average credit score on applications, eviction rate, late-payment / NSF rate, and stable-employment percentage? A property-management company in the area should have these aggregated.
- How much new for-sale + rental construction is in the pipeline within 1–3 miles? Heavy new supply typically softens prices + rents 12–24 months out; constrained supply supports both.
Investment metrics
- 1% rule
- 1.41% ✓
- Cap rate
- 12.41%
- Cash-on-cash
- 21.86%
- DSCR
- 1.97
- GRM
- 5.9
CMA / ARV
- ARV (on-the-fly)
- $246,240
- Comps found
- 8
Show comp detail 8 sales within ~0.75 mi
| Address | Dist | Beds/Ba | Sqft | Sold | Price | $/sf | Match |
|---|---|---|---|---|---|---|---|
| 1154 W 6th St | 0.10mi | 3/2.0 | 1,117 (+3%) | 2mo | $256,540 | $230 | 84 |
| 541 W 7th St | 0.11mi | 3/2.0 | 1,120 (+4%) | 21mo | $255,000 | $228 | 67 |
| 402-W 7th St | 0.25mi | 3/2.0 | 1,140 (+6%) | 14mo | $235,000 | $206 | 64 |
| 405 W 6th St | 0.22mi | 3/1.0 | 950 (-12%) | 17mo | $120,000 | $126 | 55 |
| 10144 Marvil Dr | 0.63mi | 3/1.0 | 1,100 (+2%) | 19mo | $205,000 | $186 | 52 |
| 114 Howard St | 0.31mi | 3/2.0 | 1,190 (+10%) | 22mo | $260,000 | $218 | 47 |
| 10181 Marvil Dr | 0.67mi | 2/1.0 (-1) | 975 (-10%) | 2mo | $234,900 | $241 | 46 |
| 10135 Marvil Dr | 0.65mi | 3/2.0 | 1,008 (-7%) | 23mo | $295,000 | $293 | 35 |
Match score weights: distance 35% · size 25% · config 20% · recency 20%. Top-matched comps best support the ARV.
Projected returns pro-forma
10.0% appreciation · 3.0% rent growth · sell at horizon
- IRR
- 40.6%
- Equity multiple
- 4.10×
- Total profit
- $104,213
- Equity at exit
- $108,015
- IRR
- 35.0%
- Equity multiple
- 9.23×
- Total profit
- $276,188
- Equity at exit
- $232,939
Cash invested: $33,572 (down + closing). Projections, not guarantees.
Landlord ↔ Tenant lean methodology
- Overall (STATE)
- 70 Landlord-Friendly
- State Delaware
- 70 Landlord-Friendly · D+7
- County
- — inherits STATE
- City
- — inherits STATE
ZIP-level market 19956
- Home prices YoY
- 10.5%
- Active inventory
- 92
- Price-to-rent
- 5.9×
Monthly cashflow live
- Estimated rent
- $1,695 medium interval (Pro) →
- Mortgage (P&I)
- −$629
- Tax from tax record
- −$49 /mo · $586/yr
- Insurance
- −$50
- HOA
- −$0
- Vacancy / Maint / Mgmt
- −$356
- Net cashflow
- $612
Break-even live
UW: 25.0% down · 7.5% · 30yr · 1.5% tax · 5.0% vac · 8.0% maint · 8.0% mgmt
Financing live
Cash to close
- Down payment
- $29,975
- Closing costs
- $3,597
- Reserves months
- —
- Total cash needed
- —
Loan-product check · same deal, 3 products live
Conventional
25% down · 7.5% · 30yr
- Down + closing
- —
- Monthly P&I
- —
- Monthly cashflow
- —
- DSCR
- —
- Eligible?
- —
Personal DTI + credit; lowest rate.
DSCR
20% down · 8.5% · 30yr
- Down + closing
- —
- Monthly P&I
- —
- Monthly cashflow
- —
- DSCR
- —
- Eligible?
- —
No personal income docs; deal must DSCR.
Hard money
10% down · 12.0% · 12mo
- Down + closing
- —
- Monthly P&I
- —
- Monthly cashflow
- —
- DSCR
- —
- Eligible?
- —
Short-term bridge; refi at stabilization.
Rent comps 1 comps
| Address | Beds | Baths | Sqft | Rent | $/sqft | DOM | Units | Dist |
|---|---|---|---|---|---|---|---|---|
| 1205 W 6th St Laurel, DE | 3.0 | 2.0 | 1440 | $1,695 | $1.18 | 43d | 1 | 0.17mi |
Listing history 2 events
-
2026-06-19remarks 524-char remark
-
2026-06-19$119,900 Active 1 DOM
ⓘ Source: listings_history table (triggers on properties + properties_extension) + one-shot
backfill from property_details.listing_events for pre-trigger history.
Tax reassessment forecast DE · Partial reset (capped growth)
- Current annual tax
- $586 · $49/mo
- Projected year-2 tax
- $640 · $53/mo
- Expected delta
- +$55/yr (+$5/mo · 9.4%)
ⓘ Screening estimate from a state-policy table — verify with the county assessor before closing.
Climate risk First Street
- Flood 1/10 Low FEMA zone X (unshaded) · 0% chance over 30 yrs
- Wildfire 1/10 Low
- Heat 8/10 Severe 7 d/yr ≥105°F today · 16 d/yr by 30 yrs out
- Wind 6/10 Major 75% chance of damaging wind over 30 yrs
- Air quality 3/10 Moderate 2 unhealthy d/yr today · 2 by 30 yrs out
Nearby sold comps map
Loading sold comps map…
Walkable amenities ~0.75 mi
Loading nearby amenities…
Taxation est. · year 1
- Rental income
- $20,340
- − Mortgage interest
- −$6,716
- − Property taxes
- −$586
- − Insurance
- −$600
- − Repairs & maintenance
- −$1,627
- − Management
- −$1,627
- − Depreciation
- −$3,488
- Taxable income
- $5,696
- Est. tax owed @ 24.0%
- −$1,367
- After-tax cash flow
- $5,971/yr
For passive investors: Depreciation is non-cash, so a rental often shows a tax loss while cash-flowing — sheltering income. Rental losses are passive: they offset passive income freely, and up to $25,000/yr can offset ordinary (W-2) income if you actively participate and your MAGI is under $100k (phasing out to $0 by $150k); unused losses carry forward. On sale, claimed depreciation is recaptured at up to 25%, and gains may owe capital-gains tax (a 1031 exchange can defer both). Figures are a year-1 estimate at your 24.0% rate — not tax advice; consult a CPA.
Schools (NCES district)
- District
- Laurel School District
- NCES district ID
- 1000810
- Math proficiency
- 15% ▼ -22.00%
- Reading proficiency
- 27% ▼ -19.00%
- Median HH income
- $47,135
- Composite
- 18.42/100
- National rank
- #8933
- State rank
- #25 of 26 in DE
Livability — Laurel
- Score
- 63/100
- State rank
- #57
- US rank
- #15428
Category grades
Schools grade is shown separately in the Schools card above.
Census & demographics
- Census place
- Laurel, DE
- Population (ZIP)
- 16,274
Population outlook (Sussex County) Hauer SSP2
- Today (2025)
- 248,853 people
- By 2030
- 264,464 · +6.3%
- By 2040
- 290,980 · +16.9%
- By 2050
- 311,259 · +25.1%
- By 2075
- 352,488 · +41.6%
- By 2100
- 367,406 · +47.6%
Race, ethnicity, and origin ACS 2023
- Neighborhood character
- Predominantly White (68%)
- Race & ethnicity
- White 68% Black 16% Hispanic / Latino 14% Two or more races 8%
- Hispanic origin (detail)
- Mexican 1% Puerto Rican 2%
- Common ancestry
- Russian 2% Italian 1% Hispanic 1%
- Foreign-born
- 9% · Canada
- Languages at home
- 86% English-only · Spanish 12% French/Haitian/Cajun 1%
Political lean MEDSL · Sussex
- 2024 margin
- R (+11.0) · D 43.9% · R 54.9% · Other 1.2%
- 2008→2024 swing
- -2.4pp toward R · 2008: -8.6pp · 2024: -11.0pp
- All cycles
- 2024: R+11.0 2020: R+11.2 2016: R+22.0 2012: R+13.0 2008: R+8.6
Not yet ingested
- Civics
- —
Market trends
- HPI YoY
- ▲ 28.72%
- Current HPI
- 301.6055
- Rent YoY
- —
- Metro
- —
- State GDP YoY
- —
- F500 in state
- 0
Price history
1 event — show timeline
- 2026-06-18 Listed $119,900 BRIGHT MLS
Property tax history
+7.5%/yrLatest (2025): $586 · +49.2% YoY. Source: county tax records.
Cash-flow waterfall
monthlySold comps — $/sqft
last 12 mo · ≤1 miLoading sold comps…