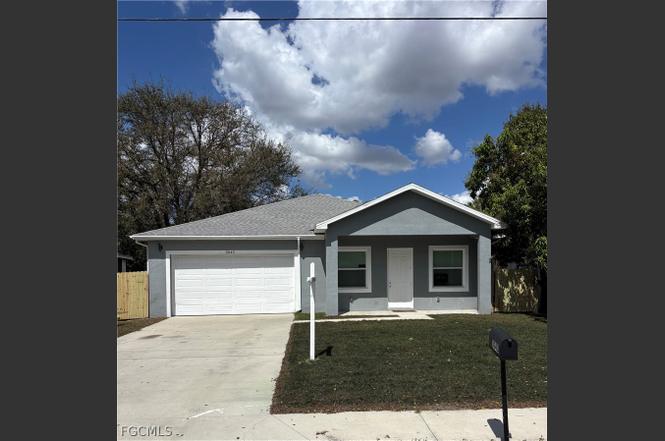
3043 Dunbar Ave · Fort Myers, FL
Flood risk 4/10 · Minor
- FEMA flood zone
- X (unshaded)
- Chance of flooding over 30 yrs
- 0.22%
- Est. flood insurance / yr
- $507 – $1,088
Fire risk 1/10 · Minimal
- Est. fire insurance / yr
- $947 – $1,759
Heat risk 10/10 · Severe
- Hot days now (above 107°F)
- 7 days/yr
- Hot days in 30 yrs
- 31 days/yr
Wind risk 10/10 · Severe
- Chance of severe wind over 30 yrs
- 99.0%
Air-quality risk 2/10 · Minimal
- Unhealthy air days now
- 1 days/yr
- Unhealthy air days in 30 yrs
- 1 days/yr
Risk factors via First Street. Map © Google.
Why this score? — see what drove the D- grade
The composite is a weighted blend of 9 inputs, each scored 0–100. Each bar is that input's sub-score; the figure is the points it added to the 100-point composite (weight × sub-score).
- Cash flow +12.6/30.0
- Livability +4.3/5.0
- Schools +4.1/10.0
- 1% rule +4.0/10.0
- DSCR +3.8/10.0
- ARV discount +2.9/15.0
- Condition / age +2.5/5.0
- Rent growth +1.4/5.0
- Appreciation +0.0/10.0
$275,000
🖨 Deal sheet (PDF) 📄 Offer letter ✓ Due diligence
Listing remarks MLS
Residential Vacant Lot For Sale. .. Don't miss out on this spectacular buying opportunity. .. Close to downtown the Ft. Myers Riverside district, where great food, shopping, and entertainment abound!
Key facts
- Heart of fort myers
- 6,011 sq ft lot
- 2 garage spots
Tags
Property features AI
Finance
- Financial info: Pets allowed
- HOA & community: Association covers grounds maintenance; Non-gated community
Exterior
- Parking: Attached garage; 2 garage spaces; Attached carport; 2 carport spaces; Garage door opener; 4 covered parking spaces total
- Utilities: Public water; Public sewer; Cable available; High speed internet available
- Home design: Single-story; New construction; Faces south; North exposure noted
- Construction: Block and concrete construction; Built-up and flat roof
- Exterior features: No notable exterior features listed
Interior
- Kitchen: Dishwasher; Gas cooktop; Disposal; Refrigerator
- Bedrooms: Includes guest quarters; Den listed as a room type
- Bathrooms: 3 full bathrooms
- Heating & cooling: Central heating (electric); Ceiling fans for cooling
- Interior features: Breakfast bar; Breakfast area; Separate/formal dining room; Entrance foyer; Family/dining room; Living/dining room; Shower only; Separate shower; Walk-in closet(s); High speed internet
- Laundry & utility: Unfurnished (no built-in laundry info provided)
Neighborhood map
What this means for you Summary
Snapshot
- This is a 4-bed/3.0-bath single-family listed at $275k.
Deal economics
- At list price, monthly cash flow is $-33 ($-395/yr) — negative.
- To cash-flow at today's rent, offer at most $269k (2.1% below list).
- To meet the 1% rule (rent ≥ 1% of price), the offer needs to be $249k (9.5% below list).
- Recommended offer: $242k (12.0% below list) — sets the bar for market timing.
- Cap rate 6.1% vs local median 3.3% in Fort Myers — top-decile yield for the area; either an underpriced asset or a hidden risk that comps aren't pricing in. Stress-test before assuming the spread holds.
Location & tenants
- Location reads 86/100 on livability (#14 in FL, #383 nationally) — a professional / high-income tenant draw. Strengths: amenities A+, commute A+, housing A+.
- Lee (suburban): math 47% / reading 50% proficiency, ranked #42 of 73 in FL (top 58%) — families likely to look elsewhere, expect single-tenant / working-renter base with shorter leases.
- Zoned schools: Heights Elementary School (math 74% / reading 67%, grade A-, #333 of 2,144 statewide, top 16%, 1,109 students, 38% FRL); Lexington Middle School (math 55% / reading 54%, grade B-, #183 of 571 statewide, top 34%, 1,138 students, 44% FRL); South Fort Myers High School (math 23% / reading 30%, grade F, #489 of 667 statewide, top 74%, 1,917 students, 50% FRL).
- Market conditions: Rents falling (-4.3%/yr); 271 active listings in the ZIP; 40 comparable units currently listed for rent nearby; rentals at typical pace (median 26d on market — plan ~3-4 weeks tenant-placement turnaround); 15,411 units permitted in Lee County in 2024 (4,686 in 5+ unit buildings).
- At $2,488/mo this rent would consume 57% of the median local household income ($53k/yr) (locally 2324% of renters already pay >50% of income on rent) — very limited rent-growth headroom before tenants either downsize or default.
Forward outlook
- Local home prices are declining (-3.0%/yr); year-one equity from $2k of loan paydown is wiped out by about $8k of value loss. Plan a longer hold.
- Lee County population projected at +44% by 2050 — long-run rental-demand tailwind backs the buy-and-hold thesis.
Negotiation context
- It's been on market 249 days — a 12% lower offer ($242k) is reasonable based on typical stale-listing flexibility.
- 2 sale attempts since 11y ago; this cycle's ask has dropped $50k (15%) from the opening price — seller is motivated, your offer sets the floor, not the list.
- Current owner paid $11k; list at $275k implies a 2344% gain — meaningful room to come down on a strong offer.
Risks & watch-outs
- Climate carrying-cost: severe wind risk, 99% chance of damaging wind over 30y; extreme-heat days projected 7→31/yr by 2055 (HVAC capex compounding) — expect insurance premiums to compound above CPI over the hold.
Questions for the listing agent
- What do current leases actually rent for vs. the listed asking? Can we see a recent rent roll and the last 12 months of T-12 income?
- It's been on market 249 days. Have you received any prior offers? Is the seller open to a 12% concession, seller financing, or rate buy-down credit?
- Why hasn't it sold? Are there any deal-killer items the seller is aware of (foundation, flood, title, zoning, code violations)?
- Is there a deadline driving the sale (1031 exchange, divorce, estate, relocation)? That informs how much negotiation room exists.
- The area grade is low — what's the realistic commute time and amenity access for the typical tenant pool here? Any planned neighborhood developments (good or bad) we should know about?
- What's the average days-on-market for RENTAL listings here right now (not sales)? A rising rental-DOM trend means longer vacancies and softer asking-rent achievability than the comps imply.
- What's the recent tenant-quality profile in this submarket — average credit score on applications, eviction rate, late-payment / NSF rate, and stable-employment percentage? A property-management company in the area should have these aggregated.
- How much new for-sale + rental construction is in the pipeline within 1–3 miles? Heavy new supply typically softens prices + rents 12–24 months out; constrained supply supports both.
Investment metrics
- 1% rule
- 0.90% ✗
- Cap rate
- 6.15%
- Cash-on-cash
- -0.51%
- DSCR
- 0.98
- GRM
- 9.2
CMA / ARV
- ARV (on-the-fly)
- $249,480
- Comps found
- 3
Show comp detail 3 sales within ~0.75 mi
| Address | Dist | Beds/Ba | Sqft | Sold | Price | $/sf | Match |
|---|---|---|---|---|---|---|---|
| 2924 Dunbar Ave | 0.21mi | 4/3.0 | 1,619 (-9%) | 4mo | $330,000 | $204 | 71 |
| 3017 Market St | 0.11mi | 5/2.0 (+1) | 1,748 (-2%) | 14mo | $245,000 | $140 | 70 |
| 2921 Lafayette St | 0.32mi | 3/2.0 (-1) | 1,519 (-15%) | 14mo | $155,000 | $102 | 40 |
Match score weights: distance 35% · size 25% · config 20% · recency 20%. Top-matched comps best support the ARV.
Projected returns pro-forma
-3.0% appreciation · 0.0% rent growth · sell at horizon
- IRR
- -20.7%
- Equity multiple
- 0.30×
- Total profit
- $-53,855
- Equity at exit
- $41,003
- IRR
- -23.4%
- Equity multiple
- -0.00×
- Total profit
- $-77,382
- Equity at exit
- $23,777
Cash invested: $77,000 (down + closing). Projections, not guarantees.
Landlord ↔ Tenant lean methodology
- Overall (STATE)
- 87 Strongly Landlord-Friendly
- State Florida
- 87 Strongly Landlord-Friendly · R+3
- County
- — inherits STATE
- City
- — inherits STATE
ZIP-level market 33916
- Home prices YoY
- -28.2%
- Rents YoY
- -4.3%
- Active inventory
- 271
- Price-to-rent
- 9.2×
Monthly cashflow live
- Estimated rent
- $2,488 high interval (Pro) →
- Mortgage (P&I)
- −$1,442
- Tax from tax record
- −$442 /mo · $5,305/yr
- Insurance
- −$115
- HOA
- −$0
- Vacancy / Maint / Mgmt
- −$523
- Net cashflow
- $-33
Break-even live
Sensitivity live
| Price | -10% $123 | -5% $45 | +0% $-33 | +5% $-111 | +10% $-189 |
|---|---|---|---|---|---|
| Rent | -10% $-230 | -5% $-131 | +0% $-33 | +5% $65 | +10% $164 |
| Rate | -1.0pp $106 | -0.5pp $37 | base $-33 | +0.5pp $-104 | +1.0pp $-177 |
UW: 25.0% down · 7.5% · 30yr · 1.5% tax · 5.0% vac · 8.0% maint · 8.0% mgmt
Financing live
Cash to close
- Down payment
- $68,750
- Closing costs
- $8,250
- Reserves months
- —
- Total cash needed
- —
Loan-product check · same deal, 3 products live
Conventional
25% down · 7.5% · 30yr
- Down + closing
- —
- Monthly P&I
- —
- Monthly cashflow
- —
- DSCR
- —
- Eligible?
- —
Personal DTI + credit; lowest rate.
DSCR
20% down · 8.5% · 30yr
- Down + closing
- —
- Monthly P&I
- —
- Monthly cashflow
- —
- DSCR
- —
- Eligible?
- —
No personal income docs; deal must DSCR.
Hard money
10% down · 12.0% · 12mo
- Down + closing
- —
- Monthly P&I
- —
- Monthly cashflow
- —
- DSCR
- —
- Eligible?
- —
Short-term bridge; refi at stabilization.
Rent comps 40 comps
| Address | Beds | Baths | Sqft | Rent | $/sqft | DOM | Units | Dist |
|---|---|---|---|---|---|---|---|---|
| 3034 Price Ave Fort Myers, FL | 3.0 | 2.0 | 1367 | $2,100 | $1.54 | 5d | 1 | 0.10mi |
| 2218 Quality Life Center Way Fort Myers, FL | 4.0 | 2.0 | 1257 | $2,250 | $1.79 | 25d | 1 | 0.14mi |
| 2955 Dunbar St Unit A Fort Myers, FL | 3.0 | 2.0 | 1285 | $2,300 | $1.79 | 17d | 1 | 0.17mi |
| 4051 Regata Way Fort Myers, FL | 1.0–3.0 | 1.0–2.0 | 987 | $2,021 | $2.05 | 4d | 34 | 0.20mi |
| 3306 Bassie Ct Fort Myers, FL | 4.0 | 2.0 | 1257 | $2,100 | $1.67 | 25d | 1 | 0.31mi |
| 3341 Willard St Fort Myers, FL | 4.0 | 2.0 | 1257 | $2,500 | $1.99 | 17d | 1 | 0.47mi |
| 3341 Willard St Fort Myers, FL | 4.0 | 2.0 | 1619 | $2,500 | $1.54 | 21d | 1 | 0.47mi |
| 2627 Saint Charles St Fort Myers, FL | 4.0 | 2.0 | 1400 | $1,850 | $1.32 | 16d | 1 | 0.61mi |
| 2656 Lime St Fort Myers, FL | 4.0 | 2.0 | 1232 | $1,700 | $1.38 | 5d | 1 | 0.69mi |
| 2188 Barker Blvd Fort Myers, FL | 4.0 | 2.0 | 1367 | $2,600 | $1.90 | 25d | 1 | 0.72mi |
| 2132 Barker Blvd Fort Myers, FL | 4.0 | 2.0 | 1367 | $2,600 | $1.90 | 25d | 1 | 0.73mi |
| 2132 Barker Blvd Fort Myers, FL | 4.0 | 2.0 | 1979 | $2,600 | $1.31 | 5d | 1 | 0.73mi |
| 2197 Davis Ct Fort Myers, FL | 4.0 | 2.0 | 1257 | $2,450 | $1.95 | 4d | 1 | 0.80mi |
| 2579 Second St Fort Myers, FL | 3.0 | 2.0 | 1404 | $2,500 | $1.78 | 17d | 1 | 0.92mi |
| 2330 Hoople St Fort Myers, FL | 3.0 | 2.0 | 1250 | $1,750 | $1.40 | 17d | 1 | 0.98mi |
| 1775 Glenway Ct Fort Myers, FL | 4.0 | 2.0 | 1367 | $2,600 | $1.90 | 25d | 1 | 1.01mi |
| 2825 Palm Beach Blvd Fort Myers, FL | 1.0–3.0 | 1.5–2.5 | 990 | $2,200 | $2.22 | 12d | 7 | 1.07mi |
| 2743 First St Unit 605 Fort Myers, FL | 3.0 | 2.0 | 1721 | $2,750 | $1.60 | 25d | 1 | 1.09mi |
| 2743 1st St #405 Fort Myers, FL | 3.0 | 2.0 | 1721 | $2,500 | $1.45 | 25d | 1 | 1.09mi |
| 2743 1st St #803 Fort Myers, FL | 3.0 | 2.0 | 1571 | $5,500 | $3.50 | 25d | 1 | 1.09mi |
| 2743 1st St #2102 Fort Myers, FL | 3.0 | 2.0 | 1656 | $2,800 | $1.69 | 25d | 1 | 1.09mi |
| 2743 1st St #2206 Fort Myers, FL | 3.0 | 2.0 | 1756 | $2,600 | $1.48 | 25d | 1 | 1.09mi |
| 2743 1st St #304 Fort Myers, FL | 3.0 | 2.0 | 1341 | $2,300 | $1.72 | 25d | 1 | 1.09mi |
| 2743 1st St #506 Fort Myers, FL | 3.0 | 2.0 | 1663 | $2,200 | $1.32 | 25d | 1 | 1.09mi |
| 2745 1st St #404 Fort Myers, FL | 3.0 | 2.0 | 1408 | $2,750 | $1.95 | 25d | 1 | 1.11mi |
| 2745 1st St #2703 Fort Myers, FL | 3.0 | 2.0 | 1408 | $3,000 | $2.13 | 25d | 1 | 1.11mi |
| 2745 1st St #1903 Fort Myers, FL | 3.0 | 2.0 | 1408 | $5,500 | $3.91 | 25d | 1 | 1.11mi |
| 2745 1st St #2602 Fort Myers, FL | 3.0 | 2.0 | 1656 | $6,000 | $3.62 | 25d | 1 | 1.11mi |
| 2745 1st St #306 Fort Myers, FL | 3.0 | 2.0 | 1602 | $2,100 | $1.31 | 25d | 1 | 1.11mi |
| 2745 1st St #1006 Fort Myers, FL | 3.0 | 2.0 | 1721 | $2,500 | $1.45 | 25d | 1 | 1.12mi |
| 2797 First St Unit 1546387P Fort Myers, FL | 3.0 | 3.0 | 1442 | $3,059 | $2.12 | 16d | 1 | 1.12mi |
| 2797 1st St #1602 Fort Myers, FL | 3.0 | 2.0 | 1459 | $2,495 | $1.71 | 25d | 1 | 1.12mi |
| 2797 1st St #2202 Fort Myers, FL | 3.0 | 2.5 | 1954 | $4,300 | $2.20 | 5d | 1 | 1.12mi |
| 2330 Union St Fort Myers, FL | 3.0 | 1.0–2.0 | 951 | $3,714 | $3.90 | 5d | 27 | 1.13mi |
| 3000 Oasis Grand Blvd #2004 Fort Myers, FL | 3.0 | 2.5 | 1708 | $2,995 | $1.75 | 13d | 1 | 1.15mi |
| 3000 Oasis Grand Blvd #801 Fort Myers, FL | 3.0 | 2.5 | 1854 | $4,000 | $2.16 | 25d | 1 | 1.15mi |
| 3000 Oasis Grand Blvd #2004 Fort Myers, FL | 3.0 | 2.5 | 1708 | $2,995 | $1.75 | 25d | 1 | 1.15mi |
| 3000 Oasis Grand Blvd #401 Fort Myers, FL | 3.0 | 2.5 | 1854 | $3,000 | $1.62 | 25d | 1 | 1.15mi |
| 3000 Oasis Grand Blvd Unit LPH1 Fort Myers, FL | 3.0 | 2.5 | 1584 | $5,000 | $3.16 | 17d | 1 | 1.16mi |
| 3040 Oasis Grand Blvd Fort Myers, FL | 1.0–4.0 | 1.0–2.0 | 1444 | $3,759 | $2.60 | 3d | 68 | 1.18mi |
Listing history 21 events
-
2026-06-22days on market $275,000 Active 249 DOM
-
2026-06-17pricedays on market $275,000 Active 245 DOM
-
2026-06-16days on market $299,999 Active 244 DOM
-
2026-06-16days on market $299,999 Active 243 DOM
-
2026-06-13days on market $299,999 Active 241 DOM
-
2026-06-09days on market $299,999 Active 237 DOM
-
2026-06-07days on market $299,999 Active 235 DOM
-
2026-06-02days on market $299,999 Active 230 DOM
-
2026-06-02price $299,999 Active 229 DOM
-
2026-06-01days on market $300,000 Active 229 DOM
-
2026-06-01days on market $300,000 Active 228 DOM
-
2026-04-15price $300,000
-
2025-10-15$325,000 Active
-
2016-01-26soldstatus $11,250
-
2016-01-12price $2,000 199-char remark
Show marketing remark (199 chars)
Residential Vacant Lot For Sale. .. Don't miss out on this spectacular buying opportunity. .. Close to downtown the Ft. Myers Riverside district, where great food, shopping, and entertainment abound!
-
2016-01-08soldstatus $2,000 Sold 199-char remark
Show marketing remark (199 chars)
Residential Vacant Lot For Sale. .. Don't miss out on this spectacular buying opportunity. .. Close to downtown the Ft. Myers Riverside district, where great food, shopping, and entertainment abound!
-
2016-01-08price $3,800 199-char remark
Show marketing remark (199 chars)
Residential Vacant Lot For Sale. .. Don't miss out on this spectacular buying opportunity. .. Close to downtown the Ft. Myers Riverside district, where great food, shopping, and entertainment abound!
-
2015-10-24status Pending 199-char remark
Show marketing remark (199 chars)
Residential Vacant Lot For Sale. .. Don't miss out on this spectacular buying opportunity. .. Close to downtown the Ft. Myers Riverside district, where great food, shopping, and entertainment abound!
-
2015-06-26price $3,800 199-char remark
Show marketing remark (199 chars)
Residential Vacant Lot For Sale. .. Don't miss out on this spectacular buying opportunity. .. Close to downtown the Ft. Myers Riverside district, where great food, shopping, and entertainment abound!
-
2015-03-16price $4,750 199-char remark
Show marketing remark (199 chars)
Residential Vacant Lot For Sale. .. Don't miss out on this spectacular buying opportunity. .. Close to downtown the Ft. Myers Riverside district, where great food, shopping, and entertainment abound!
-
2015-01-22$5,000 Active 199-char remark
Show marketing remark (199 chars)
Residential Vacant Lot For Sale. .. Don't miss out on this spectacular buying opportunity. .. Close to downtown the Ft. Myers Riverside district, where great food, shopping, and entertainment abound!
ⓘ Source: listings_history table (triggers on properties + properties_extension) + one-shot
backfill from property_details.listing_events for pre-trigger history.
Tax reassessment forecast FL · Resets to sale price
- Current annual tax
- $5,305 · $442/mo
- Projected year-2 tax
- $5,305 · $442/mo
- Expected delta
- $0/yr ($0/mo · 0.0%)
ⓘ Screening estimate from a state-policy table — verify with the county assessor before closing.
Climate risk First Street
- Flood 4/10 Moderate FEMA zone X (unshaded) · 22% chance over 30 yrs
- Wildfire 1/10 Low
- Heat 10/10 Extreme 7 d/yr ≥107°F today · 31 d/yr by 30 yrs out
- Wind 10/10 Extreme 99% chance of damaging wind over 30 yrs
- Air quality 2/10 Low 1 unhealthy d/yr today · 1 by 30 yrs out
Nearby sold comps map
Loading sold comps map…
Walkable amenities ~0.75 mi
Loading nearby amenities…
Taxation est. · year 1
- Rental income
- $29,861
- − Mortgage interest
- −$15,404
- − Property taxes
- −$5,305
- − Insurance
- −$1,375
- − Repairs & maintenance
- −$2,389
- − Management
- −$2,389
- − Depreciation
- −$8,000
- Taxable loss
- −$5,001
- Est. tax savings @ 24.0%
- +$1,200
- After-tax cash flow
- $805/yr
For passive investors: Depreciation is non-cash, so a rental often shows a tax loss while cash-flowing — sheltering income. Rental losses are passive: they offset passive income freely, and up to $25,000/yr can offset ordinary (W-2) income if you actively participate and your MAGI is under $100k (phasing out to $0 by $150k); unused losses carry forward. On sale, claimed depreciation is recaptured at up to 25%, and gains may owe capital-gains tax (a 1031 exchange can defer both). Figures are a year-1 estimate at your 24.0% rate — not tax advice; consult a CPA.
Schools (NCES district)
- District
- Lee
- NCES district ID
- 1201080
- Math proficiency
- 47% ▼ -11.00%
- Reading proficiency
- 50% ▼ -4.00%
- Median HH income
- $49,518
- Composite
- 41.49/100
- National rank
- #3458
- State rank
- #42 of 73 in FL
Livability — Fort Myers
- Score
- 86/100
- State rank
- #14
- US rank
- #383
Category grades
Schools grade is shown separately in the Schools card above.
Census & demographics
- Census place
- Fort Myers, FL
- County
- Lee County · 788,662 people
- City population
- 278,598
- Metro
- Cape Coral-Fort Myers, FL
- Population (ZIP)
- 27,943
- Household income
- $52,586
- Rent vs Own
- Severe rent burden
- 2324.0
Population outlook (Lee County) Hauer SSP2
- Today (2025)
- 871,946 people
- By 2030
- 955,468 · +9.6%
- By 2040
- 1,113,587 · +27.7%
- By 2050
- 1,256,891 · +44.1%
- By 2075
- 1,560,270 · +78.9%
- By 2100
- 1,726,848 · +98.0%
Race, ethnicity, and origin ACS 2023
- Neighborhood character
- Highly diverse neighborhood (Simpson 0.71)
- Race & ethnicity
- Black 34% Hispanic / Latino 30% White 28% Two or more races 21% Asian 2%
- Hispanic origin (detail)
- Mexican 5% Puerto Rican 6% Cuban 7% Dominican 1%
- Common ancestry
- Estonian 3% Hispanic 1% Romanian 1%
- Foreign-born
- 22% · Canada, Vietnam, China
- Languages at home
- 69% English-only · Spanish 24% Other Indo-European 4% French/Haitian/Cajun 1%
Political lean MEDSL · Lee
- 2024 margin
- Strong R (+28.4) · D 35.5% · R 63.9%
- 2008→2024 swing
- -18.0pp toward R · 2008: -10.4pp · 2024: -28.4pp
- All cycles
- 2024: R+28.4 2020: R+19.2 2016: R+20.4 2012: R+16.6 2008: R+10.4
Not yet ingested
- Civics
- —
Market trends
- HPI YoY
- ▼ -95.73%
- Current HPI
- 243.2657
- Rent YoY
- ▼ -4.30%
- Metro
- Cape Coral-Fort Myers, FL
- State GDP YoY
- ▲ 3.28%
- F500 in state
- 36
Industry mix (Fortune 500 HQ in FL)
| Industry | F500 HQs | Revenue |
|---|---|---|
| Industrial Technology | 2 | $29B |
|
||
| Insurance | 2 | $17B |
|
||
| Retail | 1 | $60B |
|
||
| Technology Distribution | 1 | $58B |
|
||
| Homebuilding | 1 | $35B |
|
||
| Technology Manufacturing | 1 | $35B |
|
||
Price history
+5900.0% since first listed10 events — show timeline
- 2026-04-15 Price Changed $300,000 FORTMLS
- 2025-10-15 Listed $325,000 FORTMLS
- 2016-01-26 Sold (Public Records) $11,250 Public Records
- 2016-01-12 Price Changed $2,000 FORTMLS
- 2016-01-08 Price Changed $3,800 FORTMLS
- 2016-01-08 Sold (MLS) $2,000 FORTMLS
- 2015-10-24 Pending — FORTMLS
- 2015-06-26 Price Changed $3,800 FORTMLS
- 2015-03-16 Price Changed $4,750 FORTMLS
- 2015-01-22 Listed $5,000 FORTMLS
Property tax history
+51.7%/yrLatest (2025): $5,305 · +2.8% YoY. Source: county tax records.
Cash-flow waterfall
monthlySold comps — $/sqft
last 12 mo · ≤1 miLoading sold comps…