 🌊 Lakefront
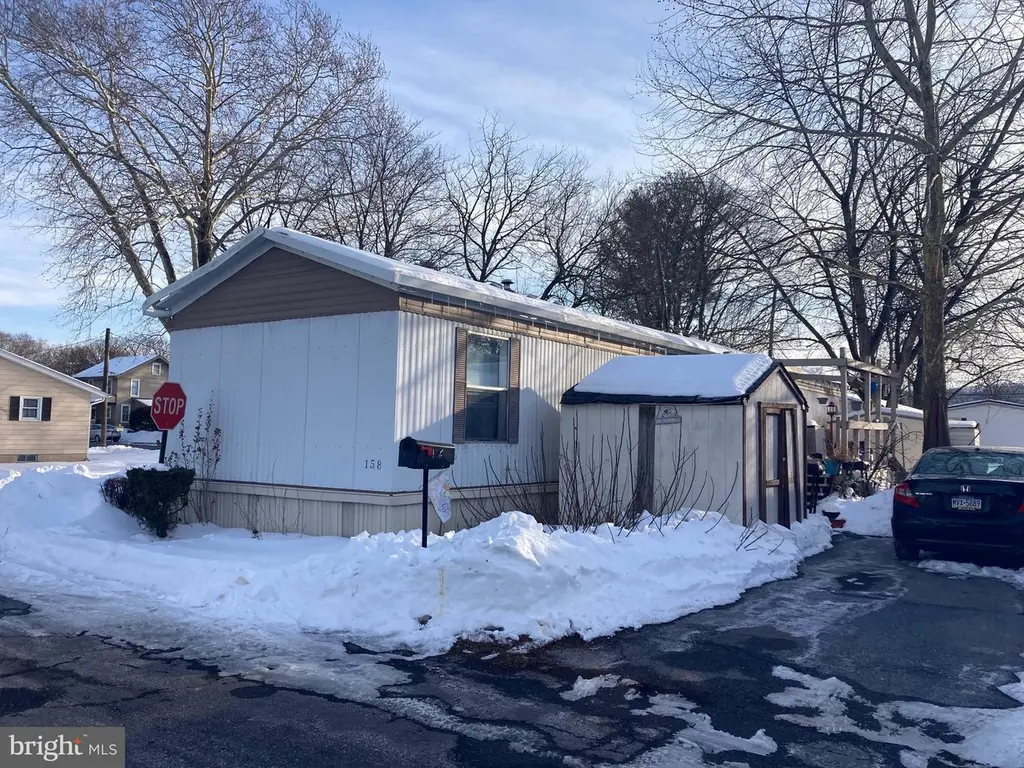
158 Park Dr · Lower Swatara, PA
Flood risk 10/10 · Severe
- FEMA flood zone
- X (shaded)
- Chance of flooding over 30 yrs
- 0.99%
- Est. flood insurance / yr
- $507 – $1,088
Fire risk 1/10 · Minimal
- Est. fire insurance / yr
- $511 – $949
Heat risk 5/10 · Moderate
- Hot days now (above 101°F)
- 7 days/yr
- Hot days in 30 yrs
- 15 days/yr
Wind risk 3/10 · Minor
- Chance of severe wind over 30 yrs
- 6.0%
Air-quality risk 3/10 · Minor
- Unhealthy air days now
- 3 days/yr
- Unhealthy air days in 30 yrs
- 5 days/yr
Risk factors via First Street. Map © Google.
Why this score? — see what drove the B grade
The composite is a weighted blend of 9 inputs, each scored 0–100. Each bar is that input's sub-score; the figure is the points it added to the 100-point composite (weight × sub-score).
- Cash flow +30.0/30.0
- ARV discount +13.3/15.0
- 1% rule +10.0/10.0
- DSCR +10.0/10.0
- Schools +3.3/10.0
- Rent growth +2.9/5.0
- Livability +2.5/5.0
- Condition / age +2.2/5.0
- Appreciation +0.0/10.0
$55,000
🖨 Deal sheet 📄 Offer letter ✓ Due diligence
Listing remarks MLS
Imagine yourself taking a stroll along Lisa Lake this spring. You can with this 1996 Skyline Homes single-wide! Only one owner. Newer roof. Newer propane furnace. Newer stainless steel propane stove and side-by-side refrigerator included. Newer Bosch frontloader washer and dryer and platforms/pedestals included. Close to Penn State Harrisburg and Harrisburg International Airport. What are you waiting for? This won’t be on the market long! Special manufactured home financing available.
Key facts
- Newer roof
- Built 1996
- Listed 134 days
Tags
Neighborhood map
What this means for you Summary
Snapshot
- This is a 3-bed/1.0-bath single-family listed at $55k. Condition is rated fair.
Deal economics
- At list price, monthly cash flow is $779 ($9k/yr) — positive.
- The deal already cash-flows at list — no discount required.
- Meets the 1% rule at list price ($2k rent vs $55k).
- Recommended offer: $48k (12.0% below list) — sets the bar for market timing.
Location & tenants
- Location reads: area grade B — affects rentability + tenant quality, not the cash-flow math above.
- Middletown Area SD (suburban): math 31% / reading 45% proficiency, ranked #368 of 539 in PA (top 68%) — families likely to look elsewhere, expect single-tenant / working-renter base with shorter leases.
- Market conditions: Rents rising (+1.6%/yr); 146 active listings in the ZIP; 1 comparable units currently listed for rent nearby; 540 units permitted in Dauphin County in 2024 (194 in 5+ unit buildings).
Forward outlook
- Local home prices are declining (-3.0%/yr); year-one equity from $380 of loan paydown is wiped out by about $2k of value loss. Plan a longer hold.
- At projected returns (-3.0% appreciation + 1.6% rent growth), your $15k cash investment doubles in ~2 years — after that, you're playing with house money.
Negotiation context
- It's been on market 134 days — a 12% lower offer ($48k) is reasonable based on typical stale-listing flexibility.
Risks & watch-outs
- Watch-outs: flood insurance adds $66/mo.
- Climate carrying-cost: severe flood risk; extreme-heat days projected 7→15/yr by 2055 (HVAC capex compounding) — expect insurance premiums to compound above CPI over the hold.
Questions for the listing agent
- It's been on market 134 days. Have you received any prior offers? Is the seller open to a 12% concession, seller financing, or rate buy-down credit?
- Have any recent inspections been done? Can we get a copy of the seller's disclosures and any deferred-maintenance estimates?
- What's the actual annual flood-insurance premium (NFIP or private), and is the property in a SFHA with mandatory coverage?
- Why hasn't it sold? Are there any deal-killer items the seller is aware of (foundation, flood, title, zoning, code violations)?
- Is there a deadline driving the sale (1031 exchange, divorce, estate, relocation)? That informs how much negotiation room exists.
- This sits on a lake — are riparian / water-frontage rights deeded with the parcel? Any dock permits, shoreline easements, or HOA water-use restrictions?
- What's the documented flood / surge / shoreline-erosion history here (FEMA AND non-FEMA — e.g., storm surge, creek backup, septic-field saturation)?
- Any water-quality or seasonal algae-bloom issues that affect tenant satisfaction or short-term-rental demand?
- What's the average days-on-market for RENTAL listings here right now (not sales)? A rising rental-DOM trend means longer vacancies and softer asking-rent achievability than the comps imply.
- What's the recent tenant-quality profile in this submarket — average credit score on applications, eviction rate, late-payment / NSF rate, and stable-employment percentage? A property-management company in the area should have these aggregated.
- How much new for-sale + rental construction is in the pipeline within 1–3 miles? Heavy new supply typically softens prices + rents 12–24 months out; constrained supply supports both.
Investment metrics
- 1% rule
- 2.82% ✓
- Cap rate
- 24.75%
- Cash-on-cash
- 65.91%
- DSCR
- 3.93
- GRM
- 3.0
CMA / ARV
- ARV (median comp)
- $63,123
- List price
- $55,000
- Delta
- -12.87%
- Verdict
- UNDERPRICED
- Comps
- 20 within 1.0 mi
Show comp detail 6 sales within ~0.75 mi
| Address | Dist | Beds/Ba | Sqft | Sold | Price | $/sf | Match |
|---|---|---|---|---|---|---|---|
| 19 Crescent St | 0.24mi | 3/1.0 | 1,087 (+14%) | 3mo | $240,000 | $221 | 63 |
| 101 Lake Dr | 0.13mi | 2/1.0 (-1) | 840 (-12%) | 8mo | $37,500 | $45 | 62 |
| 71 Lake Dr | 0.18mi | 2/2.0 (-1) | 1,056 (+11%) | 7mo | $55,000 | $52 | 58 |
| 90 Lake Dr | 0.19mi | 2/1.0 (-1) | 840 (-12%) | 18mo | $63,000 | $75 | 52 |
| 110 Mckinney Ln | 0.60mi | 2/1.5 (-1) | 840 (-12%) | 9mo | $58,900 | $70 | 38 |
| 468 2nd St | 0.71mi | 3/1.5 | 1,075 (+13%) | 10mo | $215,000 | $200 | 35 |
Match score weights: distance 35% · size 25% · config 20% · recency 20%. Top-matched comps best support the ARV.
Projected returns pro-forma
-3.0% appreciation · 1.58% rent growth · sell at horizon
- IRR
- 57.9%
- Equity multiple
- 3.51×
- Total profit
- $38,602
- Equity at exit
- $8,201
- IRR
- 62.2%
- Equity multiple
- 6.78×
- Total profit
- $89,072
- Equity at exit
- $4,755
Cash invested: $15,400 (down + closing). Projections, not guarantees.
Landlord ↔ Tenant lean methodology
- Overall (STATE)
- 62 Landlord-Friendly
- State Pennsylvania
- 62 Landlord-Friendly · EVEN
- County
- — inherits STATE
- City
- — inherits STATE
ZIP-level market 17057
- Home prices YoY
- -23.9%
- Rents YoY
- 1.6%
- Active inventory
- 146
- Price-to-rent
- 3.0×
Monthly cashflow live
- Estimated rent
- $1,552 medium interval (Pro) →
- Mortgage (P&I)
- −$288
- Tax est. 1.5%
- −$69 /mo · $825/yr
- Insurance
- −$23
- Flood insurance flood zone
- −$66 /mo · $798/yr
- HOA
- −$0
- Vacancy / Maint / Mgmt
- −$326
- Net cashflow
- $779
Break-even live
UW: 25.0% down · 7.5% · 30yr · 1.5% tax · 5.0% vac · 8.0% maint · 8.0% mgmt
Financing live
Cash to close
- Down payment
- $13,750
- Closing costs
- $1,650
- Reserves months
- —
- Total cash needed
- —
Loan-product check · same deal, 3 products live
Conventional
25% down · 7.5% · 30yr
- Down + closing
- —
- Monthly P&I
- —
- Monthly cashflow
- —
- DSCR
- —
- Eligible?
- —
Personal DTI + credit; lowest rate.
DSCR
20% down · 8.5% · 30yr
- Down + closing
- —
- Monthly P&I
- —
- Monthly cashflow
- —
- DSCR
- —
- Eligible?
- —
No personal income docs; deal must DSCR.
Hard money
10% down · 12.0% · 12mo
- Down + closing
- —
- Monthly P&I
- —
- Monthly cashflow
- —
- DSCR
- —
- Eligible?
- —
Short-term bridge; refi at stabilization.
Rent comps 1 comps
| Address | Beds | Baths | Sqft | Rent | $/sqft | DOM | Units | Dist |
|---|---|---|---|---|---|---|---|---|
| 625 Willow St Unit 610J *U/R Highspire, PA | 2.0 | 1.0 | 1008 | $1,250 | $1.24 | 23d | 1 | 0.36mi |
Listing history 16 events
-
2026-06-18days on market $55,000 Active 134 DOM
-
2026-06-17days on market $55,000 Active 133 DOM
-
2026-06-16days on market $55,000 Active 132 DOM
-
2026-06-15days on market $55,000 Active 131 DOM
-
2026-06-14days on market $55,000 Active 129 DOM
-
2026-06-10days on market $55,000 Active 126 DOM
-
2026-06-09days on market $55,000 Active 125 DOM
-
2026-06-08days on market $55,000 Active 124 DOM
-
2026-06-07days on market $55,000 Active 123 DOM
-
2026-06-05days on market $55,000 Active 120 DOM
-
2026-06-03days on market $55,000 Active 119 DOM
-
2026-06-02days on market $55,000 Active 118 DOM
-
2026-06-01days on market $55,000 Active 117 DOM
-
2026-05-31days on market $55,000 Active 116 DOM
-
2026-05-31days on market $55,000 Active 115 DOM
-
2026-02-04$55,000 Active 495-char remark
Show marketing remark (495 chars)
Imagine yourself taking a stroll along Lisa Lake this spring. You can with this 1996 Skyline Homes single-wide! Only one owner. Newer roof. Newer propane furnace. Newer stainless steel propane stove and side-by-side refrigerator included. Newer Bosch frontloader washer and dryer and platforms/pedestals included. Close to Penn State Harrisburg and Harrisburg International Airport. What are you waiting for? This won’t be on the market long! Special manufactured home financing available.
ⓘ Source: listings_history table (triggers on properties + properties_extension) + one-shot
backfill from property_details.listing_events for pre-trigger history.
Climate risk First Street
- Flood 10/10 Extreme FEMA zone X (shaded) · 99% chance over 30 yrs
- Wildfire 1/10 Low
- Heat 5/10 Major 7 d/yr ≥101°F today · 15 d/yr by 30 yrs out
- Wind 3/10 Moderate 6% chance of damaging wind over 30 yrs
- Air quality 3/10 Moderate 3 unhealthy d/yr today · 5 by 30 yrs out
Nearby sold comps map
Loading sold comps map…
Walkable amenities ~0.75 mi
Loading nearby amenities…
Taxation est. · year 1
- Rental income
- $18,621
- − Mortgage interest
- −$3,081
- − Property taxes
- −$825
- − Insurance
- −$1,072
- − Repairs & maintenance
- −$1,490
- − Management
- −$1,490
- − Depreciation
- −$1,600
- Taxable income
- $9,063
- Est. tax owed @ 24.0%
- −$2,175
- After-tax cash flow
- $7,177/yr
For passive investors: Depreciation is non-cash, so a rental often shows a tax loss while cash-flowing — sheltering income. Rental losses are passive: they offset passive income freely, and up to $25,000/yr can offset ordinary (W-2) income if you actively participate and your MAGI is under $100k (phasing out to $0 by $150k); unused losses carry forward. On sale, claimed depreciation is recaptured at up to 25%, and gains may owe capital-gains tax (a 1031 exchange can defer both). Figures are a year-1 estimate at your 24.0% rate — not tax advice; consult a CPA.
Condition & rehab AI · 12 photos
This single-wide mobile home requires moderate repairs and maintenance to improve its curb appeal and interior condition, making it a good investment opportunity.
Repairs flagged
- Major Exterior siding — Weathered and snow-covered
- Minor Interior paint — Faded and needs touch-up
Value-add opportunities
- Both Paint interior walls and trim — Enhances curb appeal and interior aesthetics
- Both Replace exterior siding — Improves curb appeal and structural integrity
- Both Deep clean and organize interior — Enhances living space and creates a more inviting atmosphere
Renovation cost estimate screening
| Repair item | Severity | Est. cost |
|---|---|---|
| Exterior siding · Weathered and snow-covered | Major | $15,000–50,000 |
| Interior paint · Faded and needs touch-up | Minor | $500–3,000 |
| Total estimated repair cost · 2 items | $15,500–53,000 |
Value-add ROI direction
- Both Paint interior walls and trim — Enhances curb appeal and interior aesthetics ↑
- Both Replace exterior siding — Improves curb appeal and structural integrity ↑
- Both Deep clean and organize interior — Enhances living space and creates a more inviting atmosphere ↑
ⓘ Cost ranges are severity-bucket heuristics (US national rule-of-thumb). Get contractor quotes + a written scope before underwriting a rehab budget.
Schools (NCES district)
- District
- Middletown Area SD
- NCES district ID
- 4215240
- Math proficiency
- 31% ▼ -9.00%
- Reading proficiency
- 45% ▼ -11.00%
- Median HH income
- $53,128
- Composite
- 33.08/100
- National rank
- #5567
- State rank
- #368 of 539 in PA
Livability — Lower Swatara
No livability data for this city. (Only ~50 U.S. cities are tracked.)
Census & demographics
- County
- Dauphin County · 247,857 people
- Metro
- Harrisburg-Carlisle, PA
- Population (ZIP)
- 23,560
- Household income
- $73,407
- Rent vs Own
- Severe rent burden
- 748.0
Population outlook (Dauphin County) Hauer SSP2
- Today (2025)
- 281,628 people
- By 2030
- 283,549 · +0.7%
- By 2040
- 285,385 · +1.3%
- By 2050
- 286,188 · +1.6%
- By 2075
- 291,053 · +3.3%
- By 2100
- 282,374 · +0.3%
Race, ethnicity, and origin ACS 2023
- Neighborhood character
- Predominantly White (76%)
- Race & ethnicity
- White 76% Hispanic / Latino 11% Two or more races 8% Black 6% Asian 2%
- Hispanic origin (detail)
- Mexican 1% Puerto Rican 7%
- Common ancestry
- Romanian 3% Italian 2% Serbian 2%
- Foreign-born
- 5% · Canada, China, South Korea
- Languages at home
- 92% English-only · Spanish 4% Other Indo-European 1%
Political lean MEDSL · Dauphin
- 2024 margin
- Lean D (+5.9) · D 52.4% · R 46.5% · Other 1.1%
- 2008→2024 swing
- -3.1pp toward R · 2008: 9.1pp · 2024: 5.9pp
- All cycles
- 2024: D+5.9 2020: D+8.5 2016: D+2.8 2012: D+6.0 2008: D+9.1
Not yet ingested
- Civics
- —
Market trends
- HPI YoY
- ▼ -83.17%
- Current HPI
- 265.6077
- Rent YoY
- ▲ 1.58%
- Metro
- Harrisburg-Carlisle, PA
- State GDP YoY
- ▲ 1.68%
- F500 in state
- 34
Industry mix (Fortune 500 HQ in PA)
| Industry | F500 HQs | Revenue |
|---|---|---|
| Healthcare | 2 | $309B |
|
||
| Insurance | 2 | $27B |
|
||
| Telecommunications / Media | 1 | $124B |
|
||
| Industrial Distribution | 1 | $22B |
|
||
| Financial Services | 1 | $20B |
|
||
| Chemicals / Materials | 1 | $18B |
|
||
Price history
1 event — show timeline
- 2026-02-04 Listed $55,000 BRIGHT MLS
Cash-flow waterfall
monthlySold comps — $/sqft
last 12 mo · ≤1 miLoading sold comps…