425 Twentieth Century Unit A-04 · Turlock, CA
Flood risk 4/10 · Minor
- FEMA flood zone
- X (unshaded)
- Chance of flooding over 30 yrs
- 0.22%
- Est. flood insurance / yr
- $507 – $1,088
Fire risk 1/10 · Minimal
- Est. fire insurance / yr
- $659 – $1,223
Heat risk 7/10 · Major
- Hot days now (above 102°F)
- 7 days/yr
- Hot days in 30 yrs
- 15 days/yr
Wind risk 1/10 · Minimal
- Chance of severe wind over 30 yrs
- —
Air-quality risk 10/10 · Severe
- Unhealthy air days now
- 33 days/yr
- Unhealthy air days in 30 yrs
- 35 days/yr
Risk factors via First Street. Map © Google.
Why this score? — see what drove the D grade
The composite is a weighted blend of 9 inputs, each scored 0–100. Each bar is that input's sub-score; the figure is the points it added to the 100-point composite (weight × sub-score).
- Cash flow +15.0/30.0
- ARV discount +7.5/15.0
- 1% rule +5.0/10.0
- DSCR +5.0/10.0
- Livability +3.3/5.0
- Rent growth +2.8/5.0
- Schools +2.7/10.0
- Condition / age +2.2/5.0
- Appreciation +0.0/10.0
$25,000
🖨 Deal sheet 📄 Offer letter ✓ Due diligence
Listing remarks
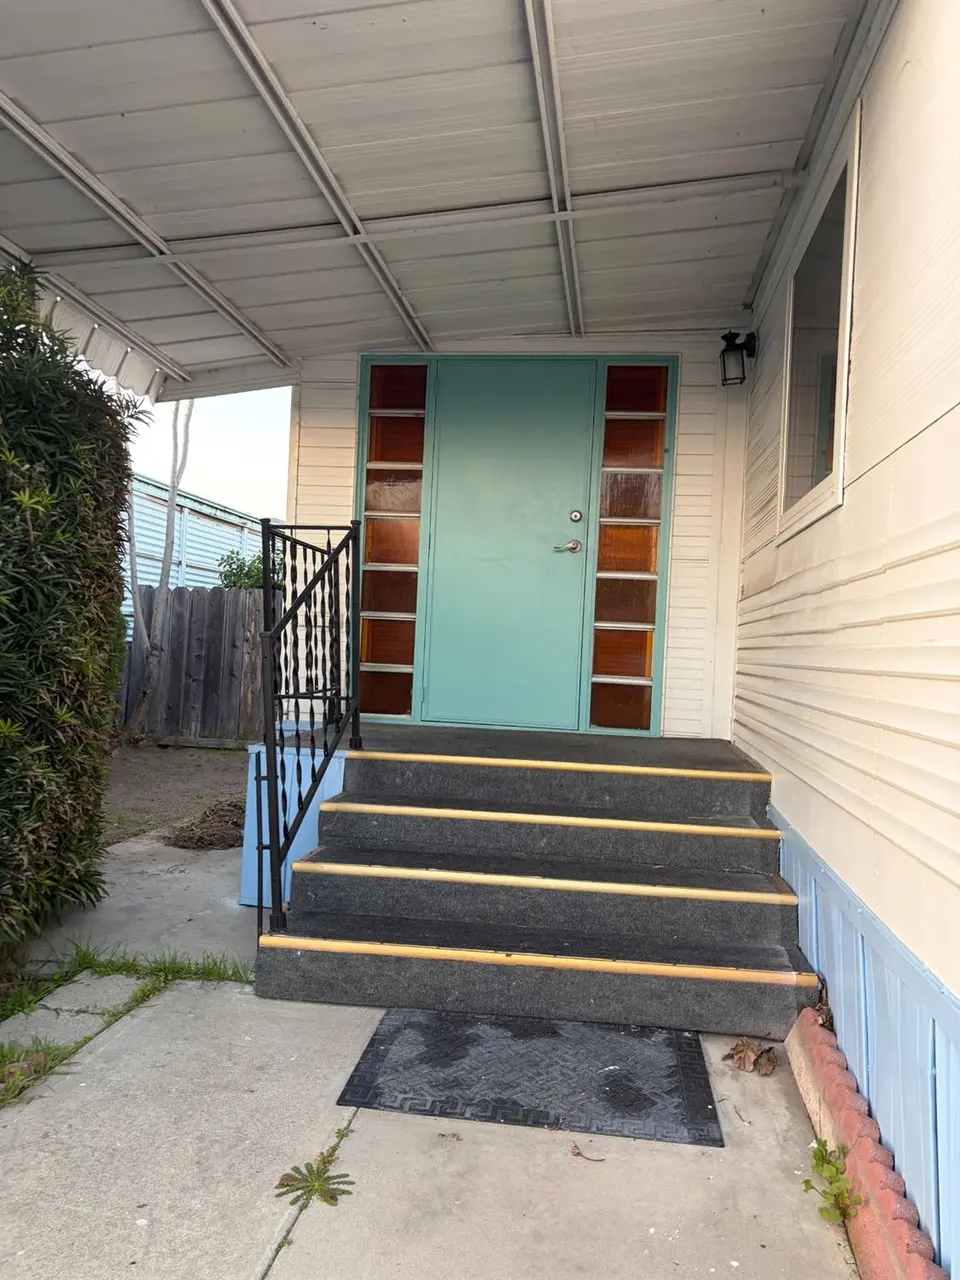
Well-maintained single-wide mobile home featuring 1 bedroom and 1 bathroom, plus an extra storage unit in the back. Enjoy the nice side and backyard with a fruit tree, perfect for relaxing or gardening. Located in the quiet senior park of Sun Garden Community right on 20th Century Blvd, near the Stanislaus County Fairgrounds. A peaceful and comfortable place to call home.
Key facts
- Extra storage unit
- Fruit tree
- Parking
Tags
Property features AI
Finance
- Financial info: Land lease amount noted as $735
- HOA & community: No homeowners association; Located in a senior community; Land lease: no (land lease amount listed separately)
Exterior
- Parking: Covered parking
- Utilities: Public water; Public sewer; 220 volts in laundry area
- Home design: Manufactured home in park; Single wide; Paramount make; Built in 1959; Located in a senior community; Address: 425 Twentieth Century Unit A-04, Turlock, CA
- Construction: Single wide manufactured construction; Paramount manufacturer; Roof details provided in remarks
- Exterior features: Regular-shaped lot; Roof: see remarks
Interior
- Kitchen: Free standing gas range; Synthetic countertops
- Bedrooms: 1 bedroom
- Flooring: Laminate flooring; Wood flooring
- Bathrooms: 1 full bathroom with shower stall
- Heating & cooling: Central heating; Ceiling fans; Wall-mounted cooling units; Window cooling units
- Interior features: Free standing gas range; Synthetic countertops; Storage area; Dining and living combined
- Laundry & utility: Laundry inside (220V outlet in laundry area)
Neighborhood map
What this means for you Summary
Snapshot
- This is a 1-bed/1.0-bath manufactured listed at $25k. Condition is rated fair.
Deal economics
- At list price, monthly cash flow is $1k ($13k/yr) — positive.
- The deal already cash-flows at list — no discount required.
- Meets the 1% rule at list price ($2k rent vs $25k).
- Recommended offer: $25k (1.5% below list) — sets the bar for market timing.
- Cap rate 57.4% vs local median 3.1% in Turlock — top-decile yield for the area; either an underpriced asset or a hidden risk that comps aren't pricing in. Stress-test before assuming the spread holds.
Location & tenants
- Location reads 66/100 on livability (#353 in CA) — a middle-class / working-renter tenant base. Strengths: housing A, health & safety A-, commute B; Watch: amenities D, schools F, crime D-.
- Turlock Unified (suburban): math 23% / reading 38% proficiency, ranked #334 of 517 in CA (top 65%) — families likely to look elsewhere, expect single-tenant / working-renter base with shorter leases.
- Market conditions: Rents rising (+1.3%/yr); 130 active listings in the ZIP; 6 comparable units currently listed for rent nearby; rentals leasing fast (median 14d on market — plan ~1-2 weeks tenant-placement turnaround); 923 units permitted in Stanislaus County in 2024 (63 in 5+ unit buildings).
Forward outlook
- Local home prices are declining (-3.0%/yr); year-one equity from $173 of loan paydown is wiped out by about $750 of value loss. Plan a longer hold.
- Stanislaus County population projected at +14% by 2050 — modest demand growth; plan on rents tracking national, not racing it.
- At projected returns (-3.0% appreciation + 1.3% rent growth), your $7k cash investment doubles in ~1 year — after that, you're playing with house money.
Negotiation context
- It's been on market 27 days — a 2% lower offer ($25k) is reasonable based on typical stale-listing flexibility.
Risks & watch-outs
- Watch-outs: built in 1959 — expect roof / HVAC / electrical / plumbing capex.
- Climate carrying-cost: extreme-heat days projected 7→15/yr by 2055 (HVAC capex compounding) — expect insurance premiums to compound above CPI over the hold.
Questions for the listing agent
- Have any recent inspections been done? Can we get a copy of the seller's disclosures and any deferred-maintenance estimates?
- Built in 1959 — when were the roof, HVAC, electrical panel, plumbing, and water heater last replaced?
- Is there a deadline driving the sale (1031 exchange, divorce, estate, relocation)? That informs how much negotiation room exists.
- Schools are F-rated, which usually means shorter tenancies and higher turnover. Who's the typical renter profile here, and what's been the actual vacancy rate?
- Crime grade is D in this area — have there been break-ins, vandalism, or insurance claims at this property in the last 3 years? What carrier currently insures it and at what premium?
- The area grade is low — what's the realistic commute time and amenity access for the typical tenant pool here? Any planned neighborhood developments (good or bad) we should know about?
- What's the average days-on-market for RENTAL listings here right now (not sales)? A rising rental-DOM trend means longer vacancies and softer asking-rent achievability than the comps imply.
- What's the recent tenant-quality profile in this submarket — average credit score on applications, eviction rate, late-payment / NSF rate, and stable-employment percentage? A property-management company in the area should have these aggregated.
- How much new for-sale + rental construction is in the pipeline within 1–3 miles? Heavy new supply typically softens prices + rents 12–24 months out; constrained supply supports both.
Investment metrics
- 1% rule
- 6.27% ✓
- Cap rate
- 57.41%
- Cash-on-cash
- 182.56%
- DSCR
- 9.12
- GRM
- 1.3
CMA / ARV
No comps found within radius.
Projected returns pro-forma
-3.0% appreciation · 1.27% rent growth · sell at horizon
- IRR
- —
- Equity multiple
- 9.73×
- Total profit
- $61,116
- Equity at exit
- $3,728
- IRR
- —
- Equity multiple
- 19.57×
- Total profit
- $130,025
- Equity at exit
- $2,162
Cash invested: $7,000 (down + closing). Projections, not guarantees.
Landlord ↔ Tenant lean methodology
- Overall (STATE)
- 18 Strongly Tenant-Friendly
- State California
- 18 Strongly Tenant-Friendly · D+13
- County
- — inherits STATE
- City
- — inherits STATE
ZIP-level market 95380
- Rents YoY
- 1.3%
- Active inventory
- 130
- Price-to-rent
- 1.3×
Monthly cashflow live
- Estimated rent
- $1,567 high interval (Pro) →
- Mortgage (P&I)
- −$131
- Tax est. 1.5%
- −$31 /mo · $375/yr
- Insurance
- −$10
- HOA
- −$0
- Vacancy / Maint / Mgmt
- −$329
- Net cashflow
- $1,065
Break-even live
UW: 25.0% down · 7.5% · 30yr · 1.5% tax · 5.0% vac · 8.0% maint · 8.0% mgmt
Financing live
Cash to close
- Down payment
- $6,250
- Closing costs
- $750
- Reserves months
- —
- Total cash needed
- —
Loan-product check · same deal, 3 products live
Conventional
25% down · 7.5% · 30yr
- Down + closing
- —
- Monthly P&I
- —
- Monthly cashflow
- —
- DSCR
- —
- Eligible?
- —
Personal DTI + credit; lowest rate.
DSCR
20% down · 8.5% · 30yr
- Down + closing
- —
- Monthly P&I
- —
- Monthly cashflow
- —
- DSCR
- —
- Eligible?
- —
No personal income docs; deal must DSCR.
Hard money
10% down · 12.0% · 12mo
- Down + closing
- —
- Monthly P&I
- —
- Monthly cashflow
- —
- DSCR
- —
- Eligible?
- —
Short-term bridge; refi at stabilization.
Rent comps 6 comps
| Address | Beds | Baths | Sqft | Rent | $/sqft | DOM | Units | Dist |
|---|---|---|---|---|---|---|---|---|
| 1749 N Olive Ave Turlock, CA | 1.0 | 1.0 | 623 | $1,650 | $2.65 | 13d | 1 | 0.78mi |
| 1240 N Olive Ave Unit B Turlock, CA | 2.0 | 1.5 | 750 | $1,650 | $2.20 | 13d | 1 | 0.81mi |
| 1700 N Tully Rd Turlock, CA | 1.0–3.0 | 1.0–2.0 | 892 | $1,525 | $1.71 | 13d | 1 | 0.82mi |
| 1317 Colorado Ave Turlock, CA | 1.0 | 1.0 | 750 | $1,445 | $1.93 | 13d | 1 | 1.01mi |
| 351 E Monte Vista Ave Turlock, CA | 2.0 | 1.0–2.0 | 684 | $1,810 | $2.65 | 13d | 11 | 1.25mi |
| 3701 Crowell Rd Turlock, CA | 1.0 | 1.0 | 669 | $1,645 | $2.46 | 13d | 1 | 1.40mi |
Listing history 16 events
-
2026-06-18days on market $25,000 Active 27 DOM
-
2026-06-17days on market $25,000 Active 26 DOM
-
2026-06-16days on market $25,000 Active 25 DOM
-
2026-06-15days on market $25,000 Active 24 DOM
-
2026-06-14days on market $25,000 Active 22 DOM
-
2026-06-13days on market $25,000 Active 21 DOM
-
2026-06-10days on market $25,000 Active 19 DOM
-
2026-06-09pricedays on market $25,000 Active 18 DOM
-
2026-06-08days on market $30,000 Active 17 DOM
-
2026-06-07days on market $30,000 Active 16 DOM
-
2026-06-05days on market $30,000 Active 13 DOM
-
2026-06-03days on market $30,000 Active 12 DOM
-
2026-06-02days on market $30,000 Active 11 DOM
-
2026-06-01days on market $30,000 Active 10 DOM
-
2026-05-31days on market $30,000 Active 9 DOM
-
2026-05-30days on market $30,000 Active 8 DOM
ⓘ Source: listings_history table (triggers on properties + properties_extension) + one-shot
backfill from property_details.listing_events for pre-trigger history.
Climate risk First Street
- Flood 4/10 Moderate FEMA zone X (unshaded) · 22% chance over 30 yrs
- Wildfire 1/10 Low
- Heat 7/10 Severe 7 d/yr ≥102°F today · 15 d/yr by 30 yrs out
- Wind 1/10 Low
- Air quality 10/10 Extreme 33 unhealthy d/yr today · 35 by 30 yrs out
Nearby sold comps map
Loading sold comps map…
Walkable amenities ~0.75 mi
Loading nearby amenities…
Taxation est. · year 1
- Rental income
- $18,800
- − Mortgage interest
- −$1,400
- − Property taxes
- −$375
- − Insurance
- −$125
- − Repairs & maintenance
- −$1,504
- − Management
- −$1,504
- − Depreciation
- −$727
- Taxable income
- $13,164
- Est. tax owed @ 24.0%
- −$3,159
- After-tax cash flow
- $9,619/yr
For passive investors: Depreciation is non-cash, so a rental often shows a tax loss while cash-flowing — sheltering income. Rental losses are passive: they offset passive income freely, and up to $25,000/yr can offset ordinary (W-2) income if you actively participate and your MAGI is under $100k (phasing out to $0 by $150k); unused losses carry forward. On sale, claimed depreciation is recaptured at up to 25%, and gains may owe capital-gains tax (a 1031 exchange can defer both). Figures are a year-1 estimate at your 24.0% rate — not tax advice; consult a CPA.
Condition & rehab AI · 1 photo
A well-maintained single-wide mobile home with average exterior and roof conditions. Minor repairs and painting would significantly enhance its curb appeal and value.
Repairs flagged
- Minor Exterior siding — Siding shows signs of wear
- Minor Roof — Roof appears aged
Value-add opportunities
- Both Paint exterior siding — Enhances curb appeal and value
- Both Seal roof — Prevents water damage and extends roof life
Renovation cost estimate screening
| Repair item | Severity | Est. cost |
|---|---|---|
| Exterior siding · Siding shows signs of wear | Minor | $500–3,000 |
| Roof · Roof appears aged | Minor | $500–3,000 |
| Total estimated repair cost · 2 items | $1,000–6,000 |
Value-add ROI direction
- Both Paint exterior siding — Enhances curb appeal and value ↑
- Both Seal roof — Prevents water damage and extends roof life ↑
ⓘ Cost ranges are severity-bucket heuristics (US national rule-of-thumb). Get contractor quotes + a written scope before underwriting a rehab budget.
Schools (NCES district)
- District
- Turlock Unified
- NCES district ID
- 0600158
- Math proficiency
- 23% ▼ -8.00%
- Reading proficiency
- 38% ▼ -7.00%
- Median HH income
- $50,249
- Composite
- 26.58/100
- National rank
- #7184
- State rank
- #334 of 517 in CA
Livability — Turlock
- Score
- 66/100
- State rank
- #353
- US rank
- #11971
Category grades
Schools grade is shown separately in the Schools card above.
Census & demographics
- Census place
- Turlock, CA
- County
- Stanislaus County · 445,786 people
- City population
- 83,043
- Metro
- Modesto, CA
- Population (ZIP)
- 43,960
- Household income
- $74,534
- Rent vs Own
- Severe rent burden
- 1545.0
Population outlook (Stanislaus County) Hauer SSP2
- Today (2025)
- 579,493 people
- By 2030
- 598,000 · +3.2%
- By 2040
- 630,930 · +8.9%
- By 2050
- 658,300 · +13.6%
- By 2075
- 712,363 · +22.9%
- By 2100
- 719,805 · +24.2%
Race, ethnicity, and origin ACS 2023
- Neighborhood character
- Diverse neighborhood (Simpson 0.57)
- Race & ethnicity
- Hispanic / Latino 54% White 36% Two or more races 14% Asian 4% Black 1%
- Hispanic origin (detail)
- Mexican 51%
- Common ancestry
- Russian 8% Italian 1% Portuguese 1%
- Foreign-born
- 22% · Canada
- Languages at home
- 52% English-only · Spanish 39% Other Indo-European 7%
Political lean MEDSL · Stanislaus
- 2024 margin
- R (+11.0) · D 43.2% · R 54.2% · Other 2.6%
- 2008→2024 swing
- -12.7pp toward R · 2008: 1.7pp · 2024: -11.0pp
- All cycles
- 2024: R+11.0 2020: D+0.8 2016: D+0.6 2012: D+0.7 2008: D+1.7
Not yet ingested
- Civics
- —
Market trends
- HPI YoY
- ▼ -614.27%
- Current HPI
- 307.7264
- Rent YoY
- ▲ 1.27%
- Metro
- Modesto, CA
- State GDP YoY
- ▲ 3.21%
- F500 in state
- 116
Industry mix (Fortune 500 HQ in CA)
| Industry | F500 HQs | Revenue |
|---|---|---|
| Technology | 27 | $1,492B |
|
||
| Financial Services | 3 | $174B |
|
||
| Retail | 3 | $44B |
|
||
| Insurance | 3 | $26B |
|
||
| Media / Entertainment | 2 | $115B |
|
||
| Pharmaceuticals / Biotech | 2 | $62B |
|
||
Cash-flow waterfall
monthlySold comps — $/sqft
last 12 mo · ≤1 miLoading sold comps…