1383 Fair St #7 · Clarkston, WA
Flood risk 7/10 · Major
- FEMA flood zone
- X
- Chance of flooding over 30 yrs
- 0.77%
- Est. flood insurance / yr
- $507 – $1,088
Fire risk 1/10 · Minimal
- Est. fire insurance / yr
- $604 – $1,122
Heat risk 5/10 · Moderate
- Hot days now (above 100°F)
- 7 days/yr
- Hot days in 30 yrs
- 15 days/yr
Wind risk 1/10 · Minimal
- Chance of severe wind over 30 yrs
- —
Air-quality risk 8/10 · Major
- Unhealthy air days now
- 12 days/yr
- Unhealthy air days in 30 yrs
- 17 days/yr
Risk factors via First Street. Map © Google.
Why this score? — see what drove the D+ grade
The composite is a weighted blend of 9 inputs, each scored 0–100. Each bar is that input's sub-score; the figure is the points it added to the 100-point composite (weight × sub-score).
- Cash flow +15.0/30.0
- ARV discount +7.5/15.0
- 1% rule +5.0/10.0
- DSCR +5.0/10.0
- Schools +4.2/10.0
- Livability +3.5/5.0
- Rent growth +2.5/5.0
- Condition / age +2.5/5.0
- Appreciation +0.0/10.0
$19,999
🖨 Deal sheet (PDF) 📄 Offer letter ✓ Due diligence
Listing remarks
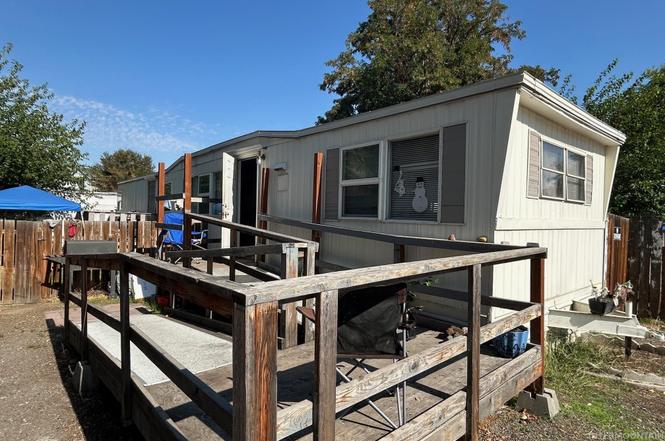
Charming and affordable! This 2-bedroom, 1 bathroom home is located in a welcoming mobile home park close to shopping, transit, and everyday amenities. Enjoy newer vinyl windows for energy efficiency and comfort, washer/dryer hookups for added convenience, and a functional layout featuring a dining room just off the kitchen—perfect for mealtime or entertaining. Bright and cozy interior with great potential for personalization. Outside, you'll find a fully fenced yard ideal for pets, a generous parking area with space for multiple vehicles, and a ramp to the front door for easy accessibility. Don't miss out on this great opportunity for comfortable, affordable living!
Key facts
- Newer vinyl windows
- Washer dryer hookups
- Ramp to front door
Tags
Neighborhood map
What this means for you Summary
Snapshot
- This is a 2-bed/1.0-bath manufactured listed at $20k.
Deal economics
- At list price, monthly cash flow is $739 ($9k/yr) — positive.
- The deal already cash-flows at list — no discount required.
- Meets the 1% rule at list price ($1k rent vs $20k).
- Recommended offer: $18k (12.0% below list) — sets the bar for market timing.
- Cap rate 54.6% vs local median 3.1% in Clarkston — top-decile yield for the area; either an underpriced asset or a hidden risk that comps aren't pricing in. Stress-test before assuming the spread holds.
Location & tenants
- Location reads 70/100 on livability (#246 in WA) — a middle-class / working-renter tenant base. Strengths: cost of living A+, health & safety A+, housing A; Watch: amenities D, crime F, commute F.
- Clarkston School District (suburban): math 38% / reading 57% proficiency, ranked #172 of 291 in WA (top 59%) — families likely to look elsewhere, expect single-tenant / working-renter base with shorter leases.
- Zoned schools: Grantham Elementary (302 students, 86% FRL) — zoned schools average 86% FRL vs 51% district-wide (35 pts higher); higher-poverty schools than district average — tighter screening recommended.
- Market conditions: 249 active listings in the ZIP; 1 comparable units currently listed for rent nearby; 101 units permitted in Asotin County in 2024 (72 in 5+ unit buildings).
Forward outlook
- Local home prices are declining (-3.0%/yr); year-one equity from $138 of loan paydown is wiped out by about $600 of value loss. Plan a longer hold.
- Asotin County population projected to shrink 3% by 2050 — rents likely to lag national; underwrite the cash flow, not the appreciation.
- At projected returns (-3.0% appreciation + 3.0% rent growth), your $6k cash investment doubles in ~1 year — after that, you're playing with house money.
Negotiation context
- It's been on market 164 days — a 12% lower offer ($18k) is reasonable based on typical stale-listing flexibility.
Risks & watch-outs
- Watch-outs: flood insurance adds $66/mo.
- Climate carrying-cost: major flood risk; extreme-heat days projected 7→15/yr by 2055 (HVAC capex compounding) — expect insurance premiums to compound above CPI over the hold.
Questions for the listing agent
- It's been on market 164 days. Have you received any prior offers? Is the seller open to a 12% concession, seller financing, or rate buy-down credit?
- Built in 1965 — when were the roof, HVAC, electrical panel, plumbing, and water heater last replaced?
- What's the actual annual flood-insurance premium (NFIP or private), and is the property in a SFHA with mandatory coverage?
- Why hasn't it sold? Are there any deal-killer items the seller is aware of (foundation, flood, title, zoning, code violations)?
- Is there a deadline driving the sale (1031 exchange, divorce, estate, relocation)? That informs how much negotiation room exists.
- Crime grade is F in this area — have there been break-ins, vandalism, or insurance claims at this property in the last 3 years? What carrier currently insures it and at what premium?
- The area grade is low — what's the realistic commute time and amenity access for the typical tenant pool here? Any planned neighborhood developments (good or bad) we should know about?
- What's the average days-on-market for RENTAL listings here right now (not sales)? A rising rental-DOM trend means longer vacancies and softer asking-rent achievability than the comps imply.
- What's the recent tenant-quality profile in this submarket — average credit score on applications, eviction rate, late-payment / NSF rate, and stable-employment percentage? A property-management company in the area should have these aggregated.
- How much new for-sale + rental construction is in the pipeline within 1–3 miles? Heavy new supply typically softens prices + rents 12–24 months out; constrained supply supports both.
Investment metrics
- 1% rule
- 5.98% ✓
- Cap rate
- 54.65%
- Cash-on-cash
- 172.69%
- DSCR
- 8.68
- GRM
- 1.4
CMA / ARV
- ARV (on-the-fly)
- $146,520
- Comps found
- 1
Show comp detail 1 sale within ~0.75 mi
| Address | Dist | Beds/Ba | Sqft | Sold | Price | $/sf | Match |
|---|---|---|---|---|---|---|---|
| 1433 Maple St | 0.40mi | 2/1.0 | 720 (+9%) | 13mo | $160,000 | $222 | 56 |
Match score weights: distance 35% · size 25% · config 20% · recency 20%. Top-matched comps best support the ARV.
Projected returns pro-forma
-3.0% appreciation · 3.0% rent growth · sell at horizon
- IRR
- —
- Equity multiple
- 8.84×
- Total profit
- $43,910
- Equity at exit
- $2,982
- IRR
- —
- Equity multiple
- 18.70×
- Total profit
- $99,113
- Equity at exit
- $1,729
Cash invested: $5,600 (down + closing). Projections, not guarantees.
Landlord ↔ Tenant lean methodology
- Overall (STATE)
- 28 Tenant-Leaning
- State Washington
- 28 Tenant-Leaning · D+8
- County
- — inherits STATE
- City
- — inherits STATE
ZIP-level market 99403
- Active inventory
- 249
- Price-to-rent
- 1.4×
Monthly cashflow live
- Estimated rent
- $1,195 medium interval (Pro) →
- Mortgage (P&I)
- −$105
- Tax est. 1.5%
- −$25 /mo · $300/yr
- Insurance
- −$8
- Flood insurance flood zone
- −$66 /mo · $798/yr
- HOA
- −$0
- Vacancy / Maint / Mgmt
- −$251
- Net cashflow
- $739
Break-even live
Sensitivity live
| Price | -10% $753 | -5% $746 | +0% $739 | +5% $732 | +10% $726 |
|---|---|---|---|---|---|
| Rent | -10% $645 | -5% $692 | +0% $739 | +5% $787 | +10% $834 |
| Rate | -1.0pp $749 | -0.5pp $744 | base $739 | +0.5pp $734 | +1.0pp $729 |
UW: 25.0% down · 7.5% · 30yr · 1.5% tax · 5.0% vac · 8.0% maint · 8.0% mgmt
Financing live
Cash to close
- Down payment
- $5,000
- Closing costs
- $600
- Reserves months
- —
- Total cash needed
- —
Loan-product check · same deal, 3 products live
Conventional
25% down · 7.5% · 30yr
- Down + closing
- —
- Monthly P&I
- —
- Monthly cashflow
- —
- DSCR
- —
- Eligible?
- —
Personal DTI + credit; lowest rate.
DSCR
20% down · 8.5% · 30yr
- Down + closing
- —
- Monthly P&I
- —
- Monthly cashflow
- —
- DSCR
- —
- Eligible?
- —
No personal income docs; deal must DSCR.
Hard money
10% down · 12.0% · 12mo
- Down + closing
- —
- Monthly P&I
- —
- Monthly cashflow
- —
- DSCR
- —
- Eligible?
- —
Short-term bridge; refi at stabilization.
Rent comps 1 comps
| Address | Beds | Baths | Sqft | Rent | $/sqft | DOM | Units | Dist |
|---|---|---|---|---|---|---|---|---|
| 1600 Chestnut St Clarkston, WA | 1.0–2.0 | 1.0 | 750 | $1,195 | $1.59 | 44d | 3 | 0.89mi |
Listing history 4 events
-
2026-03-09status Pending
-
2026-01-22price $19,999
-
2026-01-07price $24,999
-
2025-09-26$27,000 Active
ⓘ Source: listings_history table (triggers on properties + properties_extension) + one-shot
backfill from property_details.listing_events for pre-trigger history.
Climate risk First Street
- Flood 7/10 Severe FEMA zone X · 77% chance over 30 yrs
- Wildfire 1/10 Low
- Heat 5/10 Major 7 d/yr ≥100°F today · 15 d/yr by 30 yrs out
- Wind 1/10 Low
- Air quality 8/10 Severe 12 unhealthy d/yr today · 17 by 30 yrs out
Nearby sold comps map
Loading sold comps map…
Walkable amenities ~0.75 mi
Loading nearby amenities…
Taxation est. · year 1
- Rental income
- $14,340
- − Mortgage interest
- −$1,120
- − Property taxes
- −$300
- − Insurance
- −$897
- − Repairs & maintenance
- −$1,147
- − Management
- −$1,147
- − Depreciation
- −$582
- Taxable income
- $9,146
- Est. tax owed @ 24.0%
- −$2,195
- After-tax cash flow
- $6,678/yr
For passive investors: Depreciation is non-cash, so a rental often shows a tax loss while cash-flowing — sheltering income. Rental losses are passive: they offset passive income freely, and up to $25,000/yr can offset ordinary (W-2) income if you actively participate and your MAGI is under $100k (phasing out to $0 by $150k); unused losses carry forward. On sale, claimed depreciation is recaptured at up to 25%, and gains may owe capital-gains tax (a 1031 exchange can defer both). Figures are a year-1 estimate at your 24.0% rate — not tax advice; consult a CPA.
Schools (NCES district)
- District
- Clarkston School District
- NCES district ID
- 5301320
- Math proficiency
- 38% ▼ -4.00%
- Reading proficiency
- 57% ▲ 1.00%
- Median HH income
- $42,030
- Composite
- 42.03/100
- National rank
- #7065
- State rank
- #172 of 291 in WA
Livability — Clarkston
- Score
- 70/100
- State rank
- #246
- US rank
- #7868
Category grades
Schools grade is shown separately in the Schools card above.
Census & demographics
- Census place
- Clarkston, WA
- Population (ZIP)
- 20,483
Population outlook (Asotin County) Hauer SSP2
- Today (2025)
- 22,623 people
- By 2030
- 22,746 · +0.5%
- By 2040
- 22,597 · -0.1%
- By 2050
- 21,947 · -3.0%
- By 2075
- 19,478 · -13.9%
- By 2100
- 16,206 · -28.4%
Race, ethnicity, and origin ACS 2023
- Neighborhood character
- Predominantly White (87%)
- Race & ethnicity
- White 87% Two or more races 6% Hispanic / Latino 5% Native American 1% Asian 1%
- Common ancestry
- Portuguese 3% Lithuanian 2% Slovak 2%
- Foreign-born
- 2% · Canada
- Languages at home
- 97% English-only · Spanish 2% Tagalog/Filipino 1%
Political lean MEDSL · Asotin
- 2024 margin
- Strong R (+25.6) · D 35.8% · R 61.5% · Other 2.7%
- 2008→2024 swing
- -12.2pp toward R · 2008: -13.4pp · 2024: -25.6pp
- All cycles
- 2024: R+25.6 2020: R+25.7 2016: R+26.8 2012: R+16.7 2008: R+13.4
Not yet ingested
- Civics
- —
Market trends
- HPI YoY
- ▼ -346.91%
- Current HPI
- 173.3027
- Rent YoY
- —
- Metro
- —
- State GDP YoY
- ▲ 4.65%
- F500 in state
- 22
Industry mix (Fortune 500 HQ in WA)
| Industry | F500 HQs | Revenue |
|---|---|---|
| Retail | 2 | $269B |
|
||
| Technology / Retail | 1 | $638B |
|
||
| Technology | 1 | $245B |
|
||
| Telecommunications | 1 | $38B |
|
||
| Food / Beverage | 1 | $36B |
|
||
| Automotive / Trucks | 1 | $34B |
|
||
Price history
-25.9% since first listed4 events — show timeline
- 2026-03-09 Pending — IMLS
- 2026-01-22 Price Changed $19,999 IMLS
- 2026-01-07 Price Changed $24,999 IMLS
- 2025-09-26 Listed $27,000 IMLS
Cash-flow waterfall
monthlySold comps — $/sqft
last 12 mo · ≤1 miLoading sold comps…