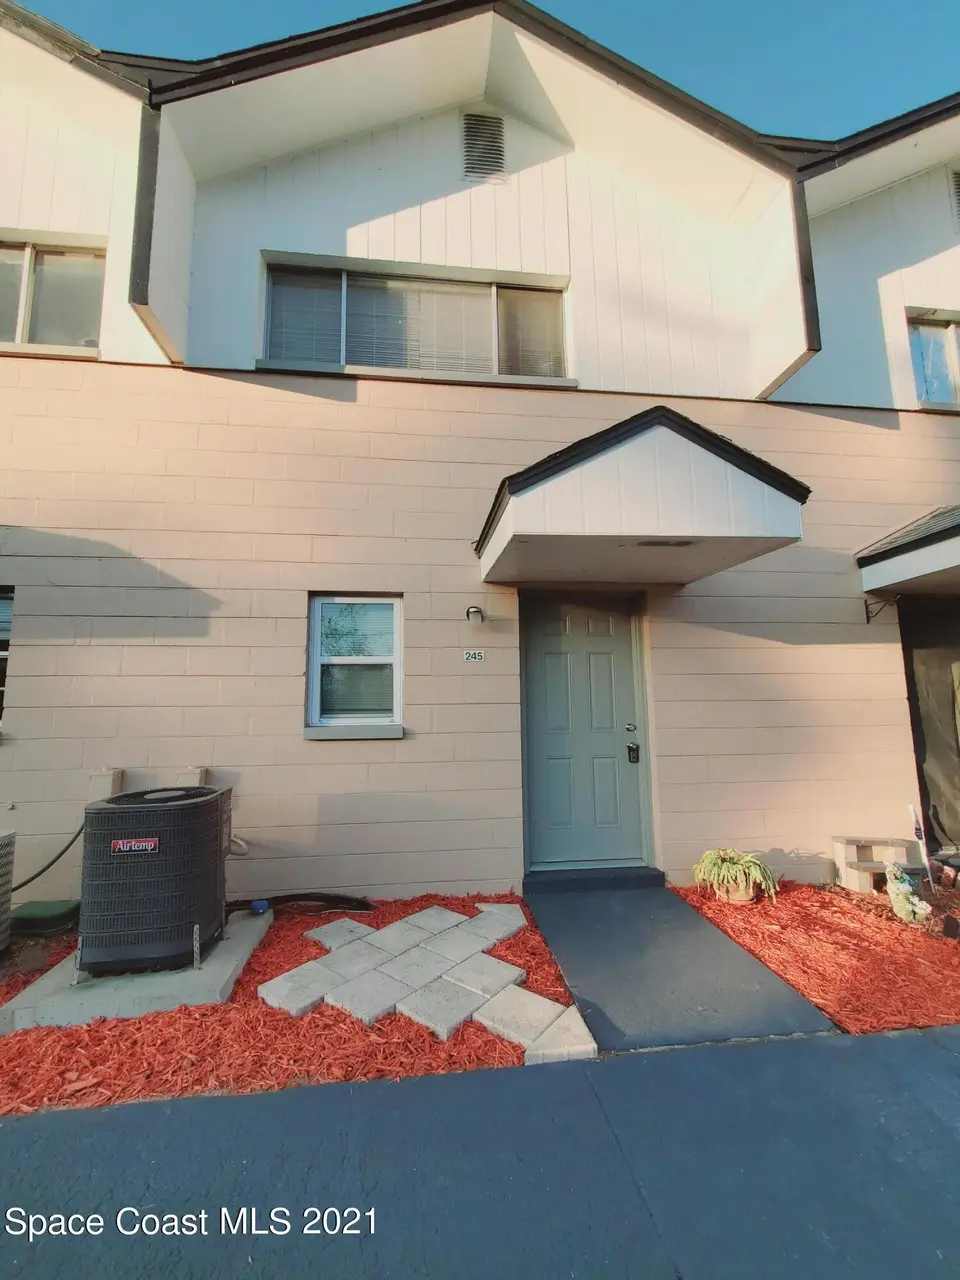
1711 Dixon Blvd #245 · Cocoa, FL
Flood risk 6/10 · Moderate
- FEMA flood zone
- X (unshaded)
- Chance of flooding over 30 yrs
- 0.71%
- Est. flood insurance / yr
- $507 – $1,088
Fire risk 5/10 · Moderate
- Est. fire insurance / yr
- $947 – $1,759
Heat risk 10/10 · Severe
- Hot days now (above 106°F)
- 7 days/yr
- Hot days in 30 yrs
- 23 days/yr
Wind risk 10/10 · Severe
- Chance of severe wind over 30 yrs
- 99.0%
Air-quality risk 1/10 · Minimal
- Unhealthy air days now
- 0 days/yr
- Unhealthy air days in 30 yrs
- 0 days/yr
Risk factors via First Street. Map © Google.
Why this score? — see what drove the D grade
The composite is a weighted blend of 9 inputs, each scored 0–100. Each bar is that input's sub-score; the figure is the points it added to the 100-point composite (weight × sub-score).
- 1% rule +10.0/10.0
- Cash flow +8.7/30.0
- ARV discount +7.5/15.0
- Schools +4.7/10.0
- Livability +3.6/5.0
- Rent growth +3.5/5.0
- Condition / age +2.5/5.0
- DSCR +2.4/10.0
- Appreciation +0.0/10.0
$79,900
🖨 Deal sheet (PDF) 📄 Offer letter ✓ Due diligence
Listing remarks MLS
Multiple offers, highest and best by 11/4/21 by 5pm. Great Investment or well priced primary residence Opportunity! ROI is very appealing for the price if used as rental. Average rent is $1000.00 per month. Private and unique townhome unit in the back of complex at Allen Condo Apartments in central Cocoa Florida. This two story, two bedroom, one bath unit is well maintained. provides a spacious open floor plan. Bonus storage closet under stairs. Newer paint and carpet throughout. Professional Management, Community Pool and Laundry facility onsite. Complex is located on the corner of Dixon and Clearlake, with a new fire station built directly across the road. In close proximity to Florida Eastern State College. Area transit is in walking distance of unit for county commute
Key facts
- $535 HOA
- Pool
- Built 1966
Property features AI
Finance
- Other: Unfurnished unit
- HOA & community: Condominium association (Allen Condominium); Monthly association fee: $535.46
Exterior
- Parking: Off-street parking; Parking lot
- Security: Other security features
- Utilities: Public sewer; Cable available; Electricity available; Water available; Sewer available
- Home design: Condominium; Two-story; Entry level: 1st floor; Home faces south
- Construction: Brick construction; Built as part of a multi-story building; Pets not allowed
- Exterior features: Deck; Patio; Private in-ground pool; Other lot features
Interior
- Kitchen: Electric range; Refrigerator
- Bedrooms: 2 bedrooms
- Bathrooms: 1 full bathroom
- Heating & cooling: Central heating (electric); Central air (electric)
- Interior features: Breakfast bar; Open floor plan
- Laundry & utility: Electric water heater
Neighborhood map
What this means for you Summary
Snapshot
- This is a 2-bed/1.0-bath condo listed at $80k.
Deal economics
- At list price, monthly cash flow is $-68 ($-811/yr) — negative.
- To cash-flow at today's rent, offer at most $68k (14.9% below list).
- Meets the 1% rule at list price ($1k rent vs $80k).
- Recommended offer: $68k (14.9% below list) — sets the bar for cash-flow.
Location & tenants
- Location reads 72/100 on livability (#344 in FL) — a middle-class / working-renter tenant base. Strengths: commute A+, cost of living A+, housing A+; Watch: crime F, amenities F, employment D-.
- Brevard (suburban): math 53% / reading 57% proficiency, ranked #19 of 73 in FL (top 26%) — acceptable for families but not a draw, mixed tenant base, ~2y average lease.
- Zoned schools: Saturn Elementary School (math 23% / reading 29%, grade F, #2,015 of 2,144 statewide, top 94%, 643 students, 81% FRL); Cocoa High School (math 21% / reading 27%, grade F, #529 of 667 statewide, top 80%, 1,551 students, 73% FRL) — zoned schools average 77% FRL vs 43% district-wide (34 pts higher); higher-poverty schools than district average — tighter screening recommended.
- Zoned-school proficiency averages 25% at this address vs 55% district-wide (-30 pts) — the specific schools serving this property underperform the Brevard average; the district grade overstates school quality for this exact location.
- Market conditions: Rents rising fast (+4.1%/yr); 167 active listings in the ZIP; 34 comparable units currently listed for rent nearby; rentals at typical pace (median 25d on market — plan ~3-4 weeks tenant-placement turnaround); lower-income renter base — watch delinquency; 4,602 units permitted in Brevard County in 2024 (702 in 5+ unit buildings).
- This rent runs 35% of the median local income ($44k/yr) — at the standard rent-burdened threshold; future hikes will face affordability resistance.
Forward outlook
- Local home prices are declining (-3.0%/yr); year-one equity from $552 of loan paydown is wiped out by about $2k of value loss. Plan a longer hold.
- Brevard County population projected at +15% by 2050 — modest demand growth; plan on rents tracking national, not racing it.
Negotiation context
- It's been on market 17 days — a 2% lower offer ($79k) is reasonable based on typical stale-listing flexibility.
- 7 sale attempts since 18y ago with the ask held roughly flat each time — persistent listings suggest the price (not the market) is what's stuck; bring a comps-based counter.
- Current owner paid $60k; 33% above their basis — modest negotiation headroom, anchor on the comps not their cost.
Risks & watch-outs
- Watch-outs: HOA is 41% of rent.
- Climate carrying-cost: major flood risk; severe wind risk, 99% chance of damaging wind over 30y; moderate wildfire risk; extreme-heat days projected 7→23/yr by 2055 (HVAC capex compounding) — expect insurance premiums to compound above CPI over the hold.
Questions for the listing agent
- What do current leases actually rent for vs. the listed asking? Can we see a recent rent roll and the last 12 months of T-12 income?
- Built in 1966 — when were the roof, HVAC, electrical panel, plumbing, and water heater last replaced?
- What does the HOA fee cover, when was the last increase, and are there any pending special assessments or reserve-fund shortfalls?
- Any open or pending special assessments — roof, HVAC, plumbing, elevator, façade? What's the per-unit balance and payoff schedule, and is the seller paying it off at close or rolling it to the buyer?
- Is there a deadline driving the sale (1031 exchange, divorce, estate, relocation)? That informs how much negotiation room exists.
- Schools are B-rated — typically a magnet for longer-tenancy family renters. What's the average tenant stay here, and is there a school-zone premium baked into asking?
- Crime grade is F in this area — have there been break-ins, vandalism, or insurance claims at this property in the last 3 years? What carrier currently insures it and at what premium?
- The area grade is low — what's the realistic commute time and amenity access for the typical tenant pool here? Any planned neighborhood developments (good or bad) we should know about?
- What's the average days-on-market for RENTAL listings here right now (not sales)? A rising rental-DOM trend means longer vacancies and softer asking-rent achievability than the comps imply.
- What's the recent tenant-quality profile in this submarket — average credit score on applications, eviction rate, late-payment / NSF rate, and stable-employment percentage? A property-management company in the area should have these aggregated.
- How much new apartment / multifamily construction is in the pipeline within 1–3 miles? Heavy new supply (>2% of stock underway) typically softens rents 12–24 months out; light construction supports rent growth.
Investment metrics
- 1% rule
- 1.62% ✓
- Cap rate
- 5.28%
- Cash-on-cash
- -3.63%
- DSCR
- 0.84
- GRM
- 5.1
CMA / ARV
No comps found within radius.
Projected returns pro-forma
-3.0% appreciation · 4.13% rent growth · sell at horizon
- IRR
- -19.2%
- Equity multiple
- 0.31×
- Total profit
- $-15,410
- Equity at exit
- $11,913
- IRR
- -7.1%
- Equity multiple
- 0.50×
- Total profit
- $-11,273
- Equity at exit
- $6,908
Cash invested: $22,372 (down + closing). Projections, not guarantees.
Landlord ↔ Tenant lean methodology
- Overall (STATE)
- 87 Strongly Landlord-Friendly
- State Florida
- 87 Strongly Landlord-Friendly · R+3
- County
- — inherits STATE
- City
- — inherits STATE
ZIP-level market 32922
- Home prices YoY
- -20.3%
- Rents YoY
- 4.1%
- Active inventory
- 167
- Price-to-rent
- 5.1×
Monthly cashflow live
- Estimated rent
- $1,297 high interval (Pro) →
- Mortgage (P&I)
- −$419
- Tax from tax record
- −$105 /mo · $1,258/yr
- Insurance
- −$33
- HOA
- −$535
- Vacancy / Maint / Mgmt
- −$272
- Net cashflow
- $-68
Break-even live
Sensitivity live
| Price | -10% $-22 | -5% $-45 | +0% $-68 | +5% $-90 | +10% $-113 |
|---|---|---|---|---|---|
| Rent | -10% $-170 | -5% $-119 | +0% $-68 | +5% $-16 | +10% $35 |
| Rate | -1.0pp $-27 | -0.5pp $-47 | base $-68 | +0.5pp $-88 | +1.0pp $-109 |
UW: 25.0% down · 7.5% · 30yr · 1.5% tax · 5.0% vac · 8.0% maint · 8.0% mgmt
Financing live
Cash to close
- Down payment
- $19,975
- Closing costs
- $2,397
- Reserves months
- —
- Total cash needed
- —
Loan-product check · same deal, 3 products live
Conventional
25% down · 7.5% · 30yr
- Down + closing
- —
- Monthly P&I
- —
- Monthly cashflow
- —
- DSCR
- —
- Eligible?
- —
Personal DTI + credit; lowest rate.
DSCR
20% down · 8.5% · 30yr
- Down + closing
- —
- Monthly P&I
- —
- Monthly cashflow
- —
- DSCR
- —
- Eligible?
- —
No personal income docs; deal must DSCR.
Hard money
10% down · 12.0% · 12mo
- Down + closing
- —
- Monthly P&I
- —
- Monthly cashflow
- —
- DSCR
- —
- Eligible?
- —
Short-term bridge; refi at stabilization.
Rent comps 34 comps
| Address | Beds | Baths | Sqft | Rent | $/sqft | DOM | Units | Dist |
|---|---|---|---|---|---|---|---|---|
| 1711 Dixon Blvd #246 Cocoa, FL | 2.0 | 1.0 | 837 | $1,350 | $1.61 | 16d | 1 | 0.03mi |
| 1717 Dixon Blvd #91 Cocoa, FL | 2.0 | 1.0 | 661 | $1,150 | $1.74 | 25d | 1 | 0.04mi |
| 1723 Dixon Blvd #11 Cocoa, FL | 2.0 | 1.0 | 621 | $1,150 | $1.85 | 16d | 1 | 0.08mi |
| 1711 Dixon Blvd Cocoa, FL | 2.0 | 1.0 | 740 | $1,262 | $1.70 | 21d | 2 | 0.08mi |
| 1341 W Point Dr Unit 7 Cocoa, FL | 2.0 | 1.0 | 543 | $1,000 | $1.84 | 25d | 1 | 0.57mi |
| 1341 W Point Dr Unit 4 Cocoa, FL | 2.0 | 1.0 | 543 | $850 | $1.57 | 16d | 1 | 0.57mi |
| 1341 W Point Dr Unit 1 Cocoa, FL | 2.0 | 1.0 | 543 | $1,150 | $2.12 | 25d | 1 | 0.57mi |
| 1341 W Point Dr Unit 3 Cocoa, FL | 2.0 | 1.0 | 543 | $1,050 | $1.93 | 25d | 1 | 0.57mi |
| 1343 W Point Dr Apt 1 Cocoa, FL | 2.0 | 1.0 | 543 | $1,000 | $1.84 | 25d | 1 | 0.57mi |
| 1616 Terrace St Cocoa, FL | 3.0 | 2.0 | 850 | $1,600 | $1.88 | 25d | 1 | 0.58mi |
| 739 Lunar Lake Cir Cocoa, FL | 2.0 | 1.0 | 814 | $1,100 | $1.35 | 25d | 1 | 0.69mi |
| 2449 Mercury Dr Cocoa, FL | 2.0 | 2.0 | 984 | $1,650 | $1.68 | 23d | 1 | 0.73mi |
| 2467 Mercury Dr Cocoa, FL | 2.0 | 1.5 | 814 | $1,400 | $1.72 | 25d | 1 | 0.79mi |
| 706 Lunar Lake Cir Unit B Cocoa, FL | 2.0 | 2.0 | 843 | $1,450 | $1.72 | 21d | 1 | 0.80mi |
| 330 Palm Ave Unit PAL332 Cocoa, FL | 2.0 | 1.0 | 700 | $1,200 | $1.71 | 25d | 1 | 0.85mi |
| 412 Country Lane Dr Cocoa, FL | 2.0 | 1.0 | 816 | $1,300 | $1.59 | 16d | 1 | 0.85mi |
| 1706 Pineda St Cocoa, FL | 3.0 | 2.0 | 1020 | $1,700 | $1.67 | 25d | 1 | 0.87mi |
| 1524 Clearlake Rd Cocoa, FL | 1.0–2.0 | 1.0 | 720 | $1,822 | $2.53 | 21d | 6 | 0.89mi |
| 1514 Clearlake Rd #110 Cocoa, FL | 2.0 | 2.0 | 1070 | $1,295 | $1.21 | 25d | 1 | 0.90mi |
| 302 Palm Ave Cocoa, FL | 2.0 | 1.0 | 820 | $1,600 | $1.95 | 16d | 1 | 0.91mi |
| 1050 N Fiske Blvd Cocoa, FL | 1.0–2.0 | 1.0 | 708 | $1,200 | $1.69 | 25d | 2 | 0.96mi |
| 1050 N Fiske Blvd #406 Cocoa, FL | 2.0 | 1.0 | 816 | $1,200 | $1.47 | 21d | 1 | 0.96mi |
| 1305 N Fiske Blvd Cocoa, FL | 1.0 | 1.0 | 600 | $950 | $1.58 | 25d | 1 | 0.97mi |
| 1305 N Fiske Blvd Cocoa, FL | 2.0 | 1.0 | 750 | $1,275 | $1.70 | 21d | 1 | 0.97mi |
| 317 Pineda St Unit B Cocoa, FL | 2.0 | 1.0 | 984 | $1,200 | $1.22 | 16d | 1 | 0.98mi |
| 1010 N Fiske Blvd Cocoa, FL | 2.0 | 1.0–1.5 | 750 | $1,275 | $1.70 | 16d | 8 | 1.00mi |
| 2506 Stratford Dr Cocoa, FL | 3.0 | 1.5 | 936 | $1,700 | $1.82 | 25d | 1 | 1.03mi |
| 800 N Fiske Blvd Cocoa, FL | 1.0–2.0 | 1.0 | 850 | $1,200 | $1.41 | 25d | 2 | 1.05mi |
| 1515 Peachtree St Cocoa, FL | 3.0 | 2.0 | 1056 | $1,475 | $1.40 | 25d | 1 | 1.06mi |
| 902 Canal Dr Cocoa, FL | 2.0 | 1.0 | 928 | $1,350 | $1.45 | 16d | 1 | 1.06mi |
| 1704 University Ln #701 Cocoa, FL | 2.0 | 2.0 | 864 | $1,225 | $1.42 | 25d | 1 | 1.10mi |
| 1710 University Ln #408 Cocoa, FL | 2.0 | 2.0 | 864 | $1,400 | $1.62 | 16d | 1 | 1.14mi |
| 647 School St Cocoa, FL | 2.0 | 1.0 | 844 | $1,495 | $1.77 | 25d | 1 | 1.39mi |
| 870 N Cocoa Blvd Unit 1 Cocoa, FL | 1.0 | 1.0 | 700 | $1,250 | $1.79 | 23d | 1 | 1.42mi |
HOA detail condo
- Monthly dues
- $535 · $6,420/yr
- Likely covers
- pool
- Assessments
- None detected in remarks — confirm with the listing agent.
Listing history 11 events
-
2026-06-22days on market $79,900 Active 17 DOM
-
2026-06-18days on market $79,900 Active 14 DOM
-
2026-06-17days on market $79,900 Active 13 DOM
-
2026-06-16days on market $79,900 Active 12 DOM
-
2026-06-15days on market $79,900 Active 11 DOM
-
2026-06-14days on market $79,900 Active 9 DOM
-
2026-06-10days on market $79,900 Active 6 DOM
-
2026-06-08days on market $79,900 Active 4 DOM
-
2026-06-07pricedays on market $79,900 Active 3 DOM
-
2026-06-05remarks 414-char remark
-
2026-06-05$80,000 Active 1 DOM
ⓘ Source: listings_history table (triggers on properties + properties_extension) + one-shot
backfill from property_details.listing_events for pre-trigger history.
Tax reassessment forecast FL · Resets to sale price
- Current annual tax
- $1,258 · $105/mo
- Projected year-2 tax
- $1,258 · $105/mo
- Expected delta
- $0/yr ($0/mo · 0.0%)
ⓘ Screening estimate from a state-policy table — verify with the county assessor before closing.
Climate risk First Street
- Flood 6/10 Major FEMA zone X (unshaded) · 71% chance over 30 yrs
- Wildfire 5/10 Major
- Heat 10/10 Extreme 7 d/yr ≥106°F today · 23 d/yr by 30 yrs out
- Wind 10/10 Extreme 99% chance of damaging wind over 30 yrs
- Air quality 1/10 Low 0 unhealthy d/yr today · 0 by 30 yrs out
Nearby sold comps map
Loading sold comps map…
Walkable amenities ~0.75 mi
Loading nearby amenities…
Taxation est. · year 1
- Rental income
- $15,563
- − Mortgage interest
- −$4,476
- − Property taxes
- −$1,258
- − Insurance
- −$400
- − Repairs & maintenance
- −$1,245
- − Management
- −$1,245
- − HOA
- −$6,420
- − Depreciation
- −$2,324
- Taxable loss
- −$1,805
- Est. tax savings @ 24.0%
- +$433
- After-tax cash flow
- $-378/yr
For passive investors: Depreciation is non-cash, so a rental often shows a tax loss while cash-flowing — sheltering income. Rental losses are passive: they offset passive income freely, and up to $25,000/yr can offset ordinary (W-2) income if you actively participate and your MAGI is under $100k (phasing out to $0 by $150k); unused losses carry forward. On sale, claimed depreciation is recaptured at up to 25%, and gains may owe capital-gains tax (a 1031 exchange can defer both). Figures are a year-1 estimate at your 24.0% rate — not tax advice; consult a CPA.
Schools (NCES district)
- District
- Brevard
- NCES district ID
- 1200150
- Math proficiency
- 53% ▼ -9.00%
- Reading proficiency
- 57% ▼ -4.00%
- Median HH income
- $49,426
- Composite
- 46.86/100
- National rank
- #2370
- State rank
- #19 of 73 in FL
Livability — Cocoa
- Score
- 72/100
- State rank
- #344
- US rank
- #5979
Category grades
Schools grade is shown separately in the Schools card above.
Census & demographics
- Census place
- Cocoa, FL
- County
- Brevard County · 602,871 people
- City population
- 67,424
- Metro
- Palm Bay-Melbourne-Titusville, FL
- Population (ZIP)
- 14,700
- Household income
- $44,469
- Rent vs Own
- Severe rent burden
- 1007.0
Population outlook (Brevard County) Hauer SSP2
- Today (2025)
- 623,254 people
- By 2030
- 648,420 · +4.0%
- By 2040
- 690,009 · +10.7%
- By 2050
- 715,669 · +14.8%
- By 2075
- 775,744 · +24.5%
- By 2100
- 776,687 · +24.6%
Race, ethnicity, and origin ACS 2023
- Neighborhood character
- Diverse neighborhood (Simpson 0.66)
- Race & ethnicity
- White 45% Black 29% Hispanic / Latino 21% Two or more races 12%
- Hispanic origin (detail)
- Mexican 10% Puerto Rican 1% Cuban 4%
- Common ancestry
- Slovak 2% Romanian 2% Lithuanian 1%
- Foreign-born
- 14% · Canada
- Languages at home
- 81% English-only · Spanish 16% German/W. Germanic 2%
Political lean MEDSL · Brevard
- 2024 margin
- Strong R (+20.8) · D 39.1% · R 59.9% · Other 1.0%
- 2008→2024 swing
- -10.4pp toward R · 2008: -10.4pp · 2024: -20.8pp
- All cycles
- 2024: R+20.8 2020: R+16.4 2016: R+19.8 2012: R+12.7 2008: R+10.4
Not yet ingested
- Civics
- —
Market trends
- HPI YoY
- ▼ -68.95%
- Current HPI
- 271.1139
- Rent YoY
- ▲ 4.13%
- Metro
- Palm Bay-Melbourne-Titusville, FL
- State GDP YoY
- ▲ 3.28%
- F500 in state
- 36
Industry mix (Fortune 500 HQ in FL)
| Industry | F500 HQs | Revenue |
|---|---|---|
| Industrial Technology | 2 | $29B |
|
||
| Insurance | 2 | $17B |
|
||
| Retail | 1 | $60B |
|
||
| Technology Distribution | 1 | $58B |
|
||
| Homebuilding | 1 | $35B |
|
||
| Technology Manufacturing | 1 | $35B |
|
||
Price history
+113.9% since first listed28 events — show timeline
- 2026-06-04 Listed $80,000 SCMLS
- 2026-06-03 Price Changed $1,175 SCMLS
- 2026-05-05 Listed for Rent $1,200 SCMLS
- 2025-05-19 Rental Removed $1,100 SCMLS
- 2025-05-02 Price Changed $1,100 SCMLS
- 2025-04-29 Price Changed $1,125 SCMLS
- 2025-03-21 Price Changed $1,175 SCMLS
- 2025-03-08 Price Changed $1,200 SCMLS
- 2025-03-04 Price Changed $1,225 SCMLS
- 2025-02-28 Price Changed $1,250 SCMLS
- 2025-02-13 Price Changed $1,325 SCMLS
- 2025-02-06 Price Changed $1,335 SCMLS
- 2025-01-12 Listed for Rent $1,375 SCMLS
- 2021-12-03 Sold (Public Records) $60,000 Public Records
- 2021-11-30 Sold (MLS) $60,000 SCMLS
- 2021-11-05 Pending — SCMLS
- 2021-10-22 Listed $60,000 SCMLS
- 2016-08-16 Listing Removed — SCMLS
- 2016-08-16 Listing Removed — SCMLS
- 2012-11-02 Sold (MLS) $13,500 SCMLS
- 2012-07-09 Listed $16,500 SCMLS
- 2011-03-04 Listed $20,000 SCMLS
- 2008-03-08 Listed $39,000 SCMLS
- 1997-08-27 Sold (Public Records) $21,900 Public Records
- 1994-03-01 Sold (Public Records) $1,451,600 Public Records
- 1990-10-01 Sold (Public Records) $672,000 Public Records
- 1988-12-01 Sold (Public Records) $263,000 Public Records
- 1980-11-01 Sold (Public Records) $37,400 Public Records
Property tax history
+5.5%/yrLatest (2025): $1,258 · +14.9% YoY. Source: county tax records.
Cash-flow waterfall
monthlySold comps — $/sqft
last 12 mo · ≤1 miLoading sold comps…