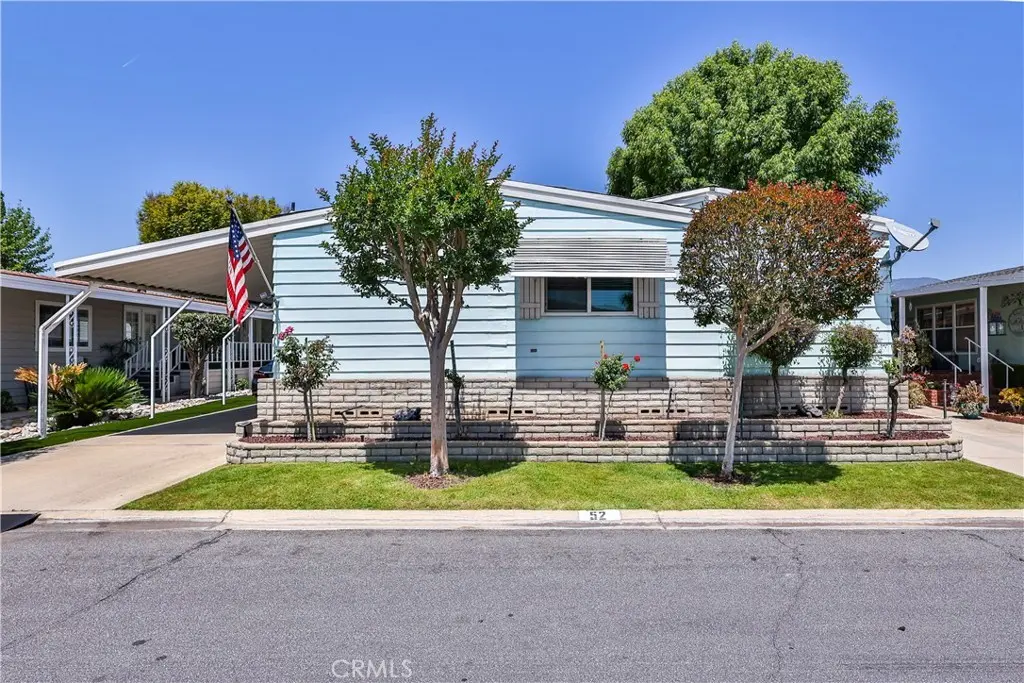
929 E Foothill Blvd #52 · Upland, CA
Flood risk 3/10 · Minor
- FEMA flood zone
- X (unshaded)
- Chance of flooding over 30 yrs
- 0.2%
- Est. flood insurance / yr
- $507 – $1,088
Fire risk 1/10 · Minimal
- Est. fire insurance / yr
- $659 – $1,223
Heat risk 7/10 · Major
- Hot days now (above 99°F)
- 7 days/yr
- Hot days in 30 yrs
- 18 days/yr
Wind risk 1/10 · Minimal
- Chance of severe wind over 30 yrs
- —
Air-quality risk 9/10 · Severe
- Unhealthy air days now
- 23 days/yr
- Unhealthy air days in 30 yrs
- 28 days/yr
Risk factors via First Street. Map © Google.
Why this score? — see what drove the C grade
The composite is a weighted blend of 9 inputs, each scored 0–100. Each bar is that input's sub-score; the figure is the points it added to the 100-point composite (weight × sub-score).
- Cash flow +26.4/30.0
- DSCR +9.0/10.0
- 1% rule +7.0/10.0
- Schools +4.3/10.0
- Livability +3.6/5.0
- Condition / age +2.5/5.0
- Rent growth +2.4/5.0
- ARV discount +0.0/15.0
- Appreciation +0.0/10.0
$280,000
🖨 Deal sheet 📄 Offer letter ✓ Due diligence
Listing remarks
Rare 1880 sq feet TRIPLE WIDE with PANORAMIC FOOTHILL VIEWS in GATED UPLAND MEADOWS - steps from the clubhouse and greenbelt. Welcome to 929 E Foothill Blvd #52 — a SPACIOUS TRIPLE WIDE retreat tucked into the gated Upland Meadows Mobile Estates, where thoughtful updates, easy single-level living, and a true sense of community come together at the foot of the San Gabriels. At 1,880 sq ft, this 2 bedroom / 2 bath home (with room to add on bedrooms) lives larger than most — offering the kind of room & flexibility that's rare to find in park living. Step inside and you're greeted by NEW LAMINATE PLANK FLOORING (May 2022) running through the main living areas, abundant natural
Key facts
- Bosch dishwasher
- New wall oven
- Corian countertops
Tags
Property features AI
Finance
- Other: Located within a managed park community; Directions: the home is located just behind the pool and the main office, second house from the corner furthest from the office
- Financial info: Land lease exists with monthly land lease payment (land lease amount provided separately); Rent includes trash, water and sewer
- HOA & community: Park name: Upland Meadows; Community features include curbs, street lighting, and sidewalks; Manager approval required; Pets allowed
Exterior
- Parking: Carport with 2 spaces; Driveway-level parking; Total of 2 parking spaces
- Security: Gated community; Automatic gate; Resident manager
- Utilities: Public water (district); Sewer or septic (unknown)
- Home design: Mobile/triple body type; Single-story; Mobile home remains on site; Has a view
- Construction: One story
- Exterior features: Community in-ground pool; Community pool access; Shed on property; Landscaped grounds; Park nearby; Close to clubhouse; Greenbelt
Interior
- Kitchen: Open-concept kitchen connected to the family room
- Bedrooms: Primary bedroom
- Bathrooms: Two full bathrooms; Walk-in shower; Bathtub
- Heating & cooling: Central cooling
- Interior features: One-level residence; Entry on main level; Kitchen open to family room; Gated community with automatic gate and resident manager
- Laundry & utility: Indoor laundry in a dedicated room
Neighborhood map
What this means for you Summary
Snapshot
- This is a 3-bed/2.0-bath manufactured listed at $280k.
Deal economics
- At list price, monthly cash flow is $727 ($9k/yr) — positive.
- The deal already cash-flows at list — no discount required.
- Meets the 1% rule at list price ($3k rent vs $280k).
- Recommended offer: $272k (3.0% below list) — sets the bar for market timing.
- Cap rate 9.4% vs local median 2.7% in Upland — top-decile yield for the area; either an underpriced asset or a hidden risk that comps aren't pricing in. Stress-test before assuming the spread holds.
Location & tenants
- Location reads 72/100 on livability (#184 in CA) — a middle-class / working-renter tenant base. Strengths: amenities A+, commute A+, employment A; Watch: crime C-, health & safety C-, cost of living F.
- Upland Unified (suburban): math 39% / reading 53% proficiency, ranked #493 of 1,400 in CA (top 35%) — families likely to look elsewhere, expect single-tenant / working-renter base with shorter leases.
- Market conditions: Rents soft (-0.3%/yr); 84 active listings in the ZIP; 33 comparable units currently listed for rent nearby; rentals leasing fast (median 12d on market — plan ~1-2 weeks tenant-placement turnaround); solid renter incomes; 5,458 units permitted in San Bernardino County in 2024 (1,500 in 5+ unit buildings).
- This rent runs 44% of the median local income ($92k/yr) — at the standard rent-burdened threshold; future hikes will face affordability resistance.
Forward outlook
- Local home prices are declining (-3.0%/yr); year-one equity from $2k of loan paydown is wiped out by about $8k of value loss. Plan a longer hold.
- San Bernardino County population projected at +15% by 2050 — modest demand growth; plan on rents tracking national, not racing it.
Negotiation context
- It's been on market 49 days — a 3% lower offer ($272k) is reasonable based on typical stale-listing flexibility.
Risks & watch-outs
- Climate carrying-cost: extreme-heat days projected 7→18/yr by 2055 (HVAC capex compounding) — expect insurance premiums to compound above CPI over the hold.
Questions for the listing agent
- It's been on market 49 days. Have you received any prior offers? Is the seller open to a 3% concession, seller financing, or rate buy-down credit?
- Built in 1978 — when were the roof, HVAC, electrical panel, plumbing, and water heater last replaced?
- Is there a deadline driving the sale (1031 exchange, divorce, estate, relocation)? That informs how much negotiation room exists.
- What's the average days-on-market for RENTAL listings here right now (not sales)? A rising rental-DOM trend means longer vacancies and softer asking-rent achievability than the comps imply.
- What's the recent tenant-quality profile in this submarket — average credit score on applications, eviction rate, late-payment / NSF rate, and stable-employment percentage? A property-management company in the area should have these aggregated.
- How much new for-sale + rental construction is in the pipeline within 1–3 miles? Heavy new supply typically softens prices + rents 12–24 months out; constrained supply supports both.
Investment metrics
- 1% rule
- 1.20% ✓
- Cap rate
- 9.41%
- Cash-on-cash
- 11.14%
- DSCR
- 1.50
- GRM
- 6.9
CMA / ARV
- ARV (median comp)
- $190,000
- List price
- $280,000
- Delta
- 47.37%
- Verdict
- OVERPRICED
- Comps
- 17 within 1.0 mi
Show comp detail 10 sales within ~0.75 mi
| Address | Dist | Beds/Ba | Sqft | Sold | Price | $/sf | Match |
|---|---|---|---|---|---|---|---|
| 929 E Foothill Blvd Spc 74 | 0.00mi | 3/2.0 | 1,800 (-4%) | 2mo | $249,000 | $138 | 92 |
| 929 E Foothill Blvd #160 | 0.00mi | 3/2.0 | 1,800 (-4%) | 9mo | $231,000 | $128 | 86 |
| 929 E Foothill Blvd #72 | 0.00mi | 2/2.0 (-1) | 1,856 (-1%) | 14mo | $210,000 | $113 | 82 |
| 929 E Foothill Blvd #15 | 0.00mi | 2/2.0 (-1) | 1,680 (-11%) | 2mo | $170 | — | 75 |
| 929 E Foothill Blvd #172 | 0.00mi | 2/2.0 (-1) | 1,896 (+1%) | 23mo | $195,000 | $103 | 74 |
| 929 E Foothill Blvd #30 | 0.00mi | 3/2.0 | 1,736 (-8%) | 18mo | $250,000 | $144 | 72 |
| 929 E FOOTHILL Blvd #215 | 0.00mi | 3/2.0 | 1,775 (-6%) | 23mo | $215,000 | $121 | 72 |
| 929 E Foothill #161 | 0.16mi | 4/2.0 (+1) | 2,040 (+8%) | 3mo | $300,000 | $147 | 71 |
| 929 E Foothill Blvd #201 | 0.00mi | 3/2.0 | 2,040 (+8%) | 23mo | $200,000 | $98 | 67 |
| 1320 San Bernardino #34 | 0.70mi | 2/2.0 (-1) | 1,760 (-6%) | 5mo | $215,000 | $122 | 48 |
Match score weights: distance 35% · size 25% · config 20% · recency 20%. Top-matched comps best support the ARV.
Projected returns pro-forma
-3.0% appreciation · 0.0% rent growth · sell at horizon
- IRR
- -3.1%
- Equity multiple
- 0.89×
- Total profit
- $-8,863
- Equity at exit
- $41,749
- IRR
- 2.9%
- Equity multiple
- 1.18×
- Total profit
- $13,981
- Equity at exit
- $24,209
Cash invested: $78,400 (down + closing). Projections, not guarantees.
Landlord ↔ Tenant lean methodology
- Overall (STATE)
- 18 Strongly Tenant-Friendly
- State California
- 18 Strongly Tenant-Friendly · D+13
- County
- — inherits STATE
- City
- — inherits STATE
ZIP-level market 91786
- Rents YoY
- -0.3%
- Active inventory
- 84
- Price-to-rent
- 6.9×
Monthly cashflow live
- Estimated rent
- $3,370 high interval (Pro) →
- Mortgage (P&I)
- −$1,468
- Tax est. 1.5%
- −$350 /mo · $4,200/yr
- Insurance
- −$117
- HOA
- −$0
- Vacancy / Maint / Mgmt
- −$708
- Net cashflow
- $727
Break-even live
UW: 25.0% down · 7.5% · 30yr · 1.5% tax · 5.0% vac · 8.0% maint · 8.0% mgmt
Financing live
Cash to close
- Down payment
- $70,000
- Closing costs
- $8,400
- Reserves months
- —
- Total cash needed
- —
Loan-product check · same deal, 3 products live
Conventional
25% down · 7.5% · 30yr
- Down + closing
- —
- Monthly P&I
- —
- Monthly cashflow
- —
- DSCR
- —
- Eligible?
- —
Personal DTI + credit; lowest rate.
DSCR
20% down · 8.5% · 30yr
- Down + closing
- —
- Monthly P&I
- —
- Monthly cashflow
- —
- DSCR
- —
- Eligible?
- —
No personal income docs; deal must DSCR.
Hard money
10% down · 12.0% · 12mo
- Down + closing
- —
- Monthly P&I
- —
- Monthly cashflow
- —
- DSCR
- —
- Eligible?
- —
Short-term bridge; refi at stabilization.
Rent comps 33 comps
| Address | Beds | Baths | Sqft | Rent | $/sqft | DOM | Units | Dist |
|---|---|---|---|---|---|---|---|---|
| 621 E Pine St Upland, CA | 4.0 | 2.0 | 1750 | $3,500 | $2.00 | 43d | 1 | 0.27mi |
| 863 N 9th Ave Upland, CA | 3.0 | 2.0 | 1507 | $3,600 | $2.39 | 1d | 1 | 0.31mi |
| 890 N Campus Ave Apt B Upland, CA | 3.0 | 1.5 | 1380 | $2,900 | $2.10 | 20d | 1 | 0.33mi |
| 1420 Felicita Ct Upland, CA | 3.0 | 2.0 | 1339 | $3,095 | $2.31 | 5d | 1 | 0.50mi |
| 1467 Winston Ct Upland, CA | 4.0 | 2.0 | 1585 | $3,500 | $2.21 | 43d | 1 | 0.66mi |
| 1054 N Euclid Ave Upland, CA | 3.0 | 2.0 | 1544 | $3,600 | $2.33 | 43d | 1 | 0.73mi |
| 1405 E 15th St Upland, CA | 3.0 | 2.0 | 2212 | $3,900 | $1.76 | 1d | 1 | 0.75mi |
| 430 E Arrow Hwy Upland, CA | 4.0 | 2.0 | 1649 | $3,350 | $2.03 | 22d | 1 | 0.78mi |
| 430 E Arrow Hwy Upland, CA | 4.0 | 2.0 | 1600 | $3,350 | $2.09 | 17d | 1 | 0.78mi |
| 517 D St Upland, CA | 3.0 | 2.0 | 1464 | $2,950 | $2.02 | 43d | 1 | 0.78mi |
| 306 N 10th Ave Apt -3 Upland, CA | 3.0 | 2.0 | 1450 | $3,000 | $2.07 | 43d | 1 | 0.79mi |
| 392 E Arrow Hwy Upland, CA | 4.0 | 2.0 | 1930 | $4,250 | $2.20 | 1d | 1 | 0.80mi |
| 329 N Campus Ave Upland, CA | 3.0 | 3.0 | 1982 | $3,750 | $1.89 | 12d | 1 | 0.81mi |
| 690 N 1st Ave Upland, CA | 2.0 | 2.0 | 2000 | $3,500 | $1.75 | 1d | 1 | 0.82mi |
| 1425 Cottonwood St Upland, CA | 3.0 | 2.5 | 1893 | $3,099 | $1.64 | 5d | 1 | 0.84mi |
| 1443 Orange Grove St Upland, CA | 4.0 | 3.0 | 2146 | $3,380 | $1.58 | 1d | 1 | 0.89mi |
| 595 N Euclid Ave Upland, CA | 3.0 | 2.0 | 1298 | $2,900 | $2.23 | 3d | 1 | 0.96mi |
| 744 Pebble Beach Dr Upland, CA | 3.0 | 2.0 | 1800 | $4,495 | $2.50 | 43d | 1 | 1.00mi |
| 8491 Gabrielino Ct Unit 69 Rancho Cucamonga, CA | 3.0 | 2.5 | 1417 | $3,850 | $2.72 | 1d | 1 | 1.01mi |
| 158 Macintosh Way Upland, CA | 3.0 | 2.5 | 1325 | $3,300 | $2.49 | 24d | 1 | 1.14mi |
| 111 N 1st Ave Upland, CA | 3.0 | 3.0 | 1480 | $3,750 | $2.53 | 1d | 1 | 1.19mi |
| 1501 Golf Club Dr Upland, CA | 2.0–3.0 | 1.5–2.5 | 1343 | $3,560 | $2.65 | 1d | 3 | 1.20mi |
| 250 Settlers Rd Upland, CA | 4.0 | 2.5 | 1972 | $3,980 | $2.02 | 19d | 1 | 1.21mi |
| 8523 Jasper St Rancho Cucamonga, CA | 4.0 | 2.0 | 1640 | $3,300 | $2.01 | 1d | 1 | 1.22mi |
| 8567 Cava Dr Rancho Cucamonga, CA | 3.0 | 2.5 | 1763 | $3,600 | $2.04 | 1d | 1 | 1.27mi |
| 8630 Cava Dr Rancho Cucamonga, CA | 4.0 | 2.5 | 1763 | $3,890 | $2.21 | 11d | 1 | 1.34mi |
| 811 Orchid Ct Unit L Upland, CA | 4.0 | 2.0 | 1600 | $3,500 | $2.19 | 22d | 1 | 1.34mi |
| 702 Mitchell Way Upland, CA | 3.0 | 2.5 | 2047 | $3,480 | $1.70 | 24d | 1 | 1.35mi |
| 855 Madison Ct Upland, CA | 3.0 | 2.5 | 1826 | $3,500 | $1.92 | 43d | 1 | 1.36mi |
| 8650 Cava Dr Rancho Cucamonga, CA | 3.0 | 2.5 | 1763 | $3,200 | $1.82 | 15d | 1 | 1.37mi |
| 8555 Sandalwood Ct Rancho Cucamonga, CA | 3.0 | 2.0 | 1400 | $3,375 | $2.41 | 1d | 1 | 1.41mi |
| 896 Altura Way Unit A Upland, CA | 3.0 | 2.0 | 1317 | $3,000 | $2.28 | 5d | 1 | 1.42mi |
| 8445 Chaffee St Rancho Cucamonga, CA | 4.0 | 2.0 | 1438 | $3,300 | $2.29 | 15d | 1 | 1.43mi |
Listing history 16 events
-
2026-06-18days on market $280,000 Active 49 DOM
-
2026-06-17days on market $280,000 Active 48 DOM
-
2026-06-16days on market $280,000 Active 47 DOM
-
2026-06-15days on market $280,000 Active 46 DOM
-
2026-06-13days on market $280,000 Active 44 DOM
-
2026-06-13days on market $280,000 Active 43 DOM
-
2026-06-09days on market $280,000 Active 40 DOM
-
2026-06-08days on market $280,000 Active 39 DOM
-
2026-06-07days on market $280,000 Active 38 DOM
-
2026-06-04days on market $280,000 Active 35 DOM
-
2026-06-03days on market $280,000 Active 34 DOM
-
2026-06-02days on market $280,000 Active 33 DOM
-
2026-06-01days on market $280,000 Active 32 DOM
-
2026-05-31days on market $280,000 Active 31 DOM
-
2026-05-18price $280,000 2323-char remark
-
2026-04-30$300,000 Active 2323-char remark
ⓘ Source: listings_history table (triggers on properties + properties_extension) + one-shot
backfill from property_details.listing_events for pre-trigger history.
Climate risk First Street
- Flood 3/10 Moderate FEMA zone X (unshaded) · 20% chance over 30 yrs
- Wildfire 1/10 Low
- Heat 7/10 Severe 7 d/yr ≥99°F today · 18 d/yr by 30 yrs out
- Wind 1/10 Low
- Air quality 9/10 Extreme 23 unhealthy d/yr today · 28 by 30 yrs out
Nearby sold comps map
Loading sold comps map…
Walkable amenities ~0.75 mi
Loading nearby amenities…
Taxation est. · year 1
- Rental income
- $40,443
- − Mortgage interest
- −$15,684
- − Property taxes
- −$4,200
- − Insurance
- −$1,400
- − Repairs & maintenance
- −$3,235
- − Management
- −$3,235
- − Depreciation
- −$8,145
- Taxable income
- $4,543
- Est. tax owed @ 24.0%
- −$1,090
- After-tax cash flow
- $7,640/yr
For passive investors: Depreciation is non-cash, so a rental often shows a tax loss while cash-flowing — sheltering income. Rental losses are passive: they offset passive income freely, and up to $25,000/yr can offset ordinary (W-2) income if you actively participate and your MAGI is under $100k (phasing out to $0 by $150k); unused losses carry forward. On sale, claimed depreciation is recaptured at up to 25%, and gains may owe capital-gains tax (a 1031 exchange can defer both). Figures are a year-1 estimate at your 24.0% rate — not tax advice; consult a CPA.
Schools (NCES district)
- District
- Upland Unified
- NCES district ID
- 0600016
- Math proficiency
- 39% ▲ 1.00%
- Reading proficiency
- 53% ▬ 0.00%
- Median HH income
- $66,267
- Composite
- 43.17/100
- National rank
- #6593
- State rank
- #493 of 1400 in CA
Livability — Upland
- Score
- 72/100
- State rank
- #184
- US rank
- #6041
Category grades
Schools grade is shown separately in the Schools card above.
Census & demographics
- Census place
- Upland, CA
- County
- San Bernardino County · 2,030,291 people
- City population
- 82,715
- Metro
- Riverside-San Bernardino-Ontario, CA
- Population (ZIP)
- 55,829
- Household income
- $92,458
- Rent vs Own
- Severe rent burden
- 2409.0
Population outlook (San Bernardino County) Hauer SSP2
- Today (2025)
- 2,300,329 people
- By 2030
- 2,378,907 · +3.4%
- By 2040
- 2,523,137 · +9.7%
- By 2050
- 2,642,388 · +14.9%
- By 2075
- 2,880,769 · +25.2%
- By 2100
- 2,909,436 · +26.5%
Race, ethnicity, and origin ACS 2023
- Neighborhood character
- Diverse neighborhood (Simpson 0.65)
- Race & ethnicity
- Hispanic / Latino 50% White 30% Two or more races 20% Asian 8% Black 7% Native American 1%
- Hispanic origin (detail)
- Mexican 40%
- Common ancestry
- Romanian 1% Lithuanian 1% Italian 1%
- Foreign-born
- 19% · Canada, China, South Korea
- Languages at home
- 66% English-only · Spanish 24% Chinese 2% Other Indo-European 2%
Political lean MEDSL · San Bernardino
- 2024 margin
- Toss-up / Even · D 47.5% · R 49.7% · Other 2.8%
- 2008→2024 swing
- -8.5pp toward R · 2008: 6.3pp · 2024: -2.1pp
- All cycles
- 2024: R+2.1 2020: D+10.7 2016: D+9.8 2012: D+5.4 2008: D+6.3
Not yet ingested
- Civics
- —
Market trends
- HPI YoY
- ▼ -771.58%
- Current HPI
- 379.2283
- Rent YoY
- ▼ -0.27%
- Metro
- Riverside-San Bernardino-Ontario, CA
- State GDP YoY
- ▲ 3.21%
- F500 in state
- 116
Industry mix (Fortune 500 HQ in CA)
| Industry | F500 HQs | Revenue |
|---|---|---|
| Technology | 27 | $1,492B |
|
||
| Financial Services | 3 | $174B |
|
||
| Retail | 3 | $44B |
|
||
| Insurance | 3 | $26B |
|
||
| Media / Entertainment | 2 | $115B |
|
||
| Pharmaceuticals / Biotech | 2 | $62B |
|
||
Price history
-6.7% since first listed2 events — show timeline
- 2026-05-18 Price Changed $280,000 CRMLS
- 2026-04-30 Listed $300,000 CRMLS
Property tax history
+0.1%/yrLatest (2025): $235 · +1.3% YoY. Source: county tax records.
Cash-flow waterfall
monthlySold comps — $/sqft
last 12 mo · ≤1 miLoading sold comps…