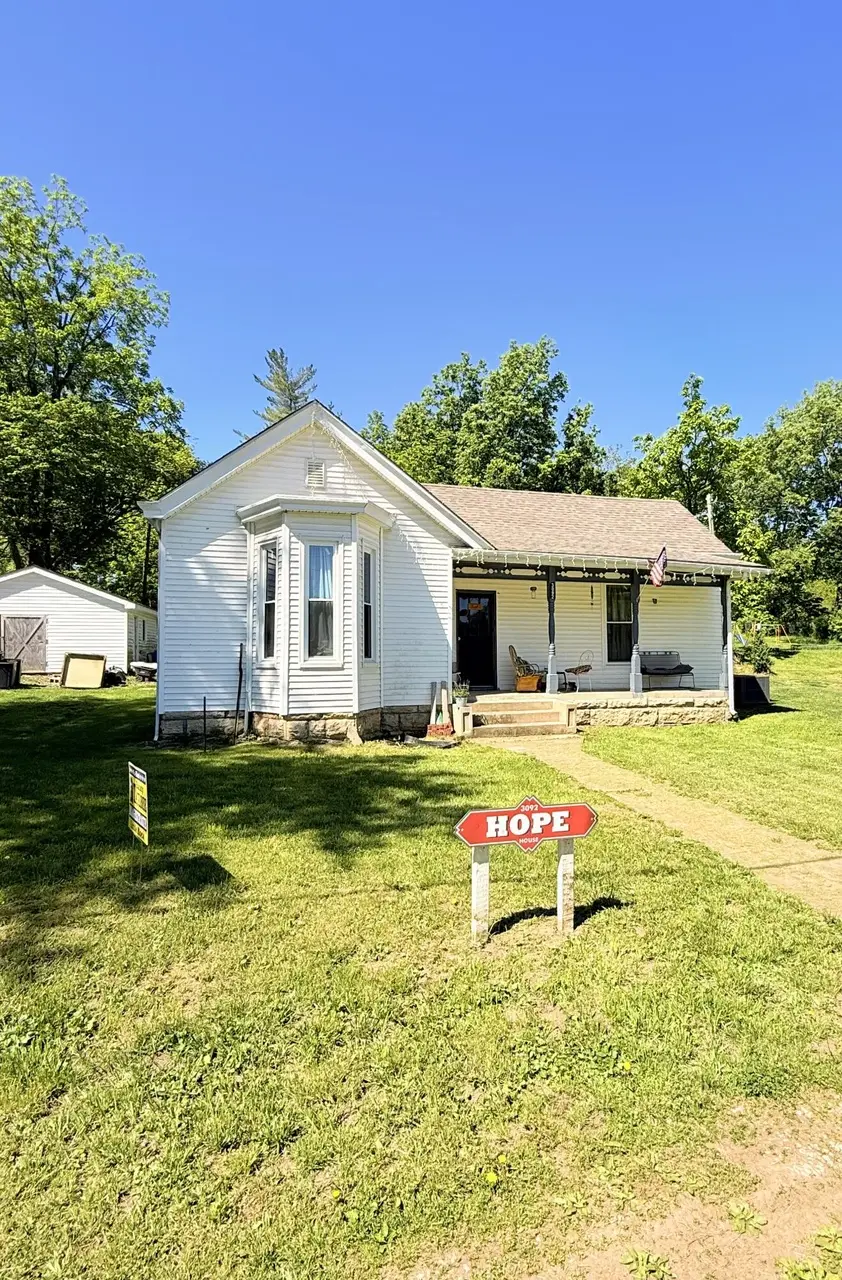
3092 Cane Ridge Rd · North Middletown, KY
Flood risk 9/10 · Severe
- FEMA flood zone
- X (unshaded)
- Chance of flooding over 30 yrs
- 0.99%
- Est. flood insurance / yr
- $507 – $1,088
Fire risk 4/10 · Minor
- Est. fire insurance / yr
- $839 – $1,559
Heat risk 4/10 · Minor
- Hot days now (above 102°F)
- 7 days/yr
- Hot days in 30 yrs
- 19 days/yr
Wind risk 2/10 · Minimal
- Chance of severe wind over 30 yrs
- 4.0%
Air-quality risk 2/10 · Minimal
- Unhealthy air days now
- 0 days/yr
- Unhealthy air days in 30 yrs
- 1 days/yr
Risk factors via First Street. Map © Google.
Why this score? — see what drove the C grade
The composite is a weighted blend of 9 inputs, each scored 0–100. Each bar is that input's sub-score; the figure is the points it added to the 100-point composite (weight × sub-score).
- Cash flow +26.7/30.0
- DSCR +9.2/10.0
- ARV discount +7.5/15.0
- 1% rule +5.9/10.0
- Livability +3.0/5.0
- Rent growth +2.5/5.0
- Schools +2.5/10.0
- Condition / age +2.5/5.0
- Appreciation +0.0/10.0
$135,000
🖨 Deal sheet 📄 Offer letter ✓ Due diligence
Listing remarks
This home in the country has lots to offer!!! Currently rented for $1000.00 per month this 1130 +/- sq. ft. 3 bedroom / 1 bath home has had major updates!!! NEW addition on the rear of the house that includes a NEW eat in kitchen, New septic system, New windows, New roof and NEW HVAC. In the spacious back yard there is a 1.5 car garage for all your storage needs. This home is part of a 10 property portfolio and can be purchased as a package or separately. Buyer or buyer agent to verify schools and sq. ft.
Key facts
- New hvac
- 1.5 car garage
- New septic system
Tags
Property features AI
Finance
- Other: Lot about 0.72 acre (public records)
Exterior
- Parking: Detached garage; Off-street parking; Garage faces front
- Utilities: Septic tank; Electricity connected; Water connected
- Home design: House; One story
- Construction: Vinyl siding; Shingle roof; Block and stone foundation; Built area approximately 1,135 total
- Exterior features: Public water; Not on waterfront
Interior
- Kitchen: Refrigerator; Range
- Flooring: Hardwood; Laminate
- Bathrooms: 1 full bathroom
- Heating & cooling: Heat pump for heating and cooling
- Interior features: Insulated windows; 6 total rooms
- Laundry & utility: Washer hookup; Electric dryer hookup
Neighborhood map
What this means for you Summary
Snapshot
- This is a 3-bed/1.0-bath other listed at $135k.
Deal economics
- At list price, monthly cash flow is $298 ($4k/yr) — positive.
- The deal already cash-flows at list — no discount required.
- Meets the 1% rule at list price ($1k rent vs $135k).
- Recommended offer: $131k (3.0% below list) — sets the bar for market timing.
Location & tenants
- Location reads 59/100 on livability (#409 in KY) — a working-class tenant base; expect higher turnover. Strengths: cost of living A+, housing A+; Watch: amenities F, commute F, employment F.
- Bourbon County (town): math 26% / reading 32% proficiency, ranked #108 of 165 in KY (top 66%) — low school quality limits family demand, transient renter base, plan for 1-2y turnover.
- Zoned schools: Bourbon Central Elementary School (math 32% / reading 27%, grade F, #393 of 676 statewide, top 63%, 483 students, 70% FRL); Bourbon County Middle School (math 25% / reading 38%, grade F, #125 of 217 statewide, top 63%, 593 students, 63% FRL); Bourbon County High School (math 27% / reading 32%, grade F, #127 of 254 statewide, top 58%, 790 students, 53% FRL).
- Market conditions: 126 active listings in the ZIP; 90 units permitted in Bourbon County in 2024 (0 in 5+ unit buildings).
Forward outlook
- Local home prices are declining (-3.0%/yr); year-one equity from $933 of loan paydown is wiped out by about $4k of value loss. Plan a longer hold.
Negotiation context
- It's been on market 31 days — a 3% lower offer ($131k) is reasonable based on typical stale-listing flexibility.
- 2 sale attempts since 4y ago with the ask held roughly flat each time — persistent listings suggest the price (not the market) is what's stuck; bring a comps-based counter.
- Current owner paid $18k; list at $135k implies a 630% gain — meaningful room to come down on a strong offer.
Risks & watch-outs
- Watch-outs: flood insurance adds $66/mo.
- Climate carrying-cost: severe flood risk — expect insurance premiums to compound above CPI over the hold.
Questions for the listing agent
- It's been on market 31 days. Have you received any prior offers? Is the seller open to a 3% concession, seller financing, or rate buy-down credit?
- What's the actual annual flood-insurance premium (NFIP or private), and is the property in a SFHA with mandatory coverage?
- Is there a deadline driving the sale (1031 exchange, divorce, estate, relocation)? That informs how much negotiation room exists.
- Schools are D-rated, which usually means shorter tenancies and higher turnover. Who's the typical renter profile here, and what's been the actual vacancy rate?
- What's the average days-on-market for RENTAL listings here right now (not sales)? A rising rental-DOM trend means longer vacancies and softer asking-rent achievability than the comps imply.
- What's the recent tenant-quality profile in this submarket — average credit score on applications, eviction rate, late-payment / NSF rate, and stable-employment percentage? A property-management company in the area should have these aggregated.
- How much new for-sale + rental construction is in the pipeline within 1–3 miles? Heavy new supply typically softens prices + rents 12–24 months out; constrained supply supports both.
Investment metrics
- 1% rule
- 1.09% ✓
- Cap rate
- 9.54%
- Cash-on-cash
- 11.58%
- DSCR
- 1.52
- GRM
- 7.6
CMA / ARV
No comps found within radius.
Projected returns pro-forma
-3.0% appreciation · 3.0% rent growth · sell at horizon
- IRR
- -2.0%
- Equity multiple
- 0.92×
- Total profit
- $-2,896
- Equity at exit
- $20,129
- IRR
- 7.6%
- Equity multiple
- 1.58×
- Total profit
- $21,862
- Equity at exit
- $11,672
Cash invested: $37,800 (down + closing). Projections, not guarantees.
Landlord ↔ Tenant lean methodology
- Overall (STATE)
- 83 Strongly Landlord-Friendly
- State Kentucky
- 83 Strongly Landlord-Friendly · R+16
- County
- — inherits STATE
- City
- — inherits STATE
ZIP-level market 40361
- Home prices YoY
- -23.1%
- Active inventory
- 126
- Price-to-rent
- 7.6×
Monthly cashflow live
- Estimated rent
- $1,472 medium interval (Pro) →
- Mortgage (P&I)
- −$708
- Tax from tax record
- −$34 /mo · $411/yr
- Insurance
- −$56
- Flood insurance flood zone
- −$66 /mo · $798/yr
- HOA
- −$0
- Vacancy / Maint / Mgmt
- −$309
- Net cashflow
- $298
Break-even live
UW: 25.0% down · 7.5% · 30yr · 1.5% tax · 5.0% vac · 8.0% maint · 8.0% mgmt
Financing live
Cash to close
- Down payment
- $33,750
- Closing costs
- $4,050
- Reserves months
- —
- Total cash needed
- —
Loan-product check · same deal, 3 products live
Conventional
25% down · 7.5% · 30yr
- Down + closing
- —
- Monthly P&I
- —
- Monthly cashflow
- —
- DSCR
- —
- Eligible?
- —
Personal DTI + credit; lowest rate.
DSCR
20% down · 8.5% · 30yr
- Down + closing
- —
- Monthly P&I
- —
- Monthly cashflow
- —
- DSCR
- —
- Eligible?
- —
No personal income docs; deal must DSCR.
Hard money
10% down · 12.0% · 12mo
- Down + closing
- —
- Monthly P&I
- —
- Monthly cashflow
- —
- DSCR
- —
- Eligible?
- —
Short-term bridge; refi at stabilization.
Listing history 20 events
-
2026-06-18days on market $135,000 Active 31 DOM
-
2026-06-17days on market $135,000 Active 30 DOM
-
2026-06-16days on market $135,000 Active 29 DOM
-
2026-06-15days on market $135,000 Active 28 DOM
-
2026-06-14days on market $135,000 Active 26 DOM
-
2026-06-13days on market $135,000 Active 25 DOM
-
2026-06-10days on market $135,000 Active 23 DOM
-
2026-06-09days on market $135,000 Active 22 DOM
-
2026-06-08days on market $135,000 Active 21 DOM
-
2026-06-07days on market $135,000 Active 20 DOM
-
2026-06-03days on market $135,000 Active 16 DOM
-
2026-06-02days on market $135,000 Active 15 DOM
-
2026-06-01days on market $135,000 Active 14 DOM
-
2026-05-31days on market $135,000 Active 13 DOM
-
2026-05-31days on market $135,000 Active 12 DOM
-
2026-05-18$135,000 Active
-
2022-08-13status Pending
-
2022-08-13soldstatus $18,500 Closed
-
2022-08-12$18,500 Active
-
1993-06-25soldstatus $25,000
ⓘ Source: listings_history table (triggers on properties + properties_extension) + one-shot
backfill from property_details.listing_events for pre-trigger history.
Tax reassessment forecast KY · Resets to sale price
- Current annual tax
- $411 · $34/mo
- Projected year-2 tax
- $1,161 · $97/mo
- Expected delta
- +$750/yr (+$62/mo · 182.4%)
ⓘ Screening estimate from a state-policy table — verify with the county assessor before closing.
Climate risk First Street
- Flood 9/10 Extreme FEMA zone X (unshaded) · 99% chance over 30 yrs
- Wildfire 4/10 Moderate
- Heat 4/10 Moderate 7 d/yr ≥102°F today · 19 d/yr by 30 yrs out
- Wind 2/10 Low 4% chance of damaging wind over 30 yrs
- Air quality 2/10 Low 0 unhealthy d/yr today · 1 by 30 yrs out
Nearby sold comps map
Loading sold comps map…
Walkable amenities ~0.75 mi
Loading nearby amenities…
Taxation est. · year 1
- Rental income
- $17,669
- − Mortgage interest
- −$7,562
- − Property taxes
- −$411
- − Insurance
- −$1,472
- − Repairs & maintenance
- −$1,414
- − Management
- −$1,414
- − Depreciation
- −$3,927
- Taxable income
- $1,469
- Est. tax owed @ 24.0%
- −$353
- After-tax cash flow
- $3,227/yr
For passive investors: Depreciation is non-cash, so a rental often shows a tax loss while cash-flowing — sheltering income. Rental losses are passive: they offset passive income freely, and up to $25,000/yr can offset ordinary (W-2) income if you actively participate and your MAGI is under $100k (phasing out to $0 by $150k); unused losses carry forward. On sale, claimed depreciation is recaptured at up to 25%, and gains may owe capital-gains tax (a 1031 exchange can defer both). Figures are a year-1 estimate at your 24.0% rate — not tax advice; consult a CPA.
Schools (NCES district)
- District
- Bourbon County
- NCES district ID
- 2100540
- Math proficiency
- 26% ▼ -19.00%
- Reading proficiency
- 32% ▼ -21.00%
- Median HH income
- $47,654
- Composite
- 25.13/100
- National rank
- #7523
- State rank
- #108 of 165 in KY
Livability — North Middletown
- Score
- 59/100
- State rank
- #409
- US rank
- #19598
Category grades
Schools grade is shown separately in the Schools card above.
Census & demographics
- County
- Bourbon County · 18,361 people
- City population
- 94
- Metro
- Lexington-Fayette, KY
- Population (ZIP)
- 18,361
- Household income
- $63,333
- Rent vs Own
- Severe rent burden
- 509.0
Population outlook (Bourbon County) Hauer SSP2
- Today (2025)
- 20,485 people
- By 2030
- 20,559 · +0.4%
- By 2040
- 20,491 · +0.0%
- By 2050
- 20,065 · -2.1%
- By 2075
- 19,173 · -6.4%
- By 2100
- 16,646 · -18.7%
Race, ethnicity, and origin ACS 2023
- Neighborhood character
- Predominantly White (83%)
- Race & ethnicity
- White 83% Hispanic / Latino 8% Two or more races 6% Black 5%
- Hispanic origin (detail)
- Mexican 6% Cuban 1%
- Common ancestry
- Slovak 2% Serbian 2% Iranian 2%
- Foreign-born
- 4% · Canada, Dominican Republic
- Languages at home
- 94% English-only · Spanish 5% French/Haitian/Cajun 1%
Political lean MEDSL · Bourbon
- 2024 margin
- Solid R (+33.5) · D 32.4% · R 65.9% · Other 1.7%
- 2008→2024 swing
- -16.3pp toward R · 2008: -17.2pp · 2024: -33.5pp
- All cycles
- 2024: R+33.5 2020: R+30.0 2016: R+31.6 2012: R+20.4 2008: R+17.2
Not yet ingested
- Civics
- —
Market trends
- HPI YoY
- ▼ -72.90%
- Current HPI
- 241.9393
- Rent YoY
- —
- Metro
- Lexington-Fayette, KY
- State GDP YoY
- ▲ 1.81%
- F500 in state
- 4
Industry mix (Fortune 500 HQ in KY)
| Industry | F500 HQs | Revenue |
|---|---|---|
| Healthcare | 1 | $118B |
|
||
| Food / Beverage | 1 | $7B |
|
||
Price history
+440.0% since first listed5 events — show timeline
- 2026-05-18 Listed $135,000 ImagineMLS
- 2022-08-13 Pending — ImagineMLS
- 2022-08-13 Sold (MLS) $18,500 ImagineMLS
- 2022-08-12 Listed $18,500 ImagineMLS
- 1993-06-25 Sold (Public Records) $25,000 Public Records
Property tax history
+38.8%/yrLatest (2025): $411 · -1.0% YoY. Source: county tax records.
Cash-flow waterfall
monthlySold comps — $/sqft
last 12 mo · ≤1 miLoading sold comps…