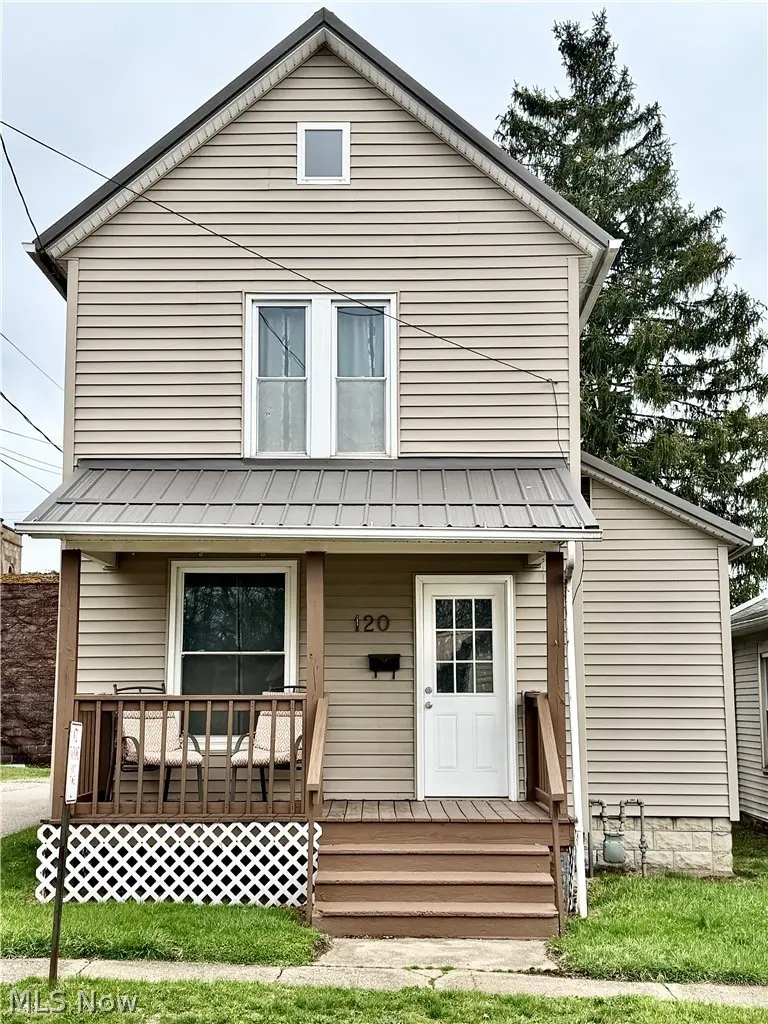
120 S Beaver St · Lisbon, OH
Flood risk 1/10 · Minimal
- FEMA flood zone
- X (unshaded)
- Chance of flooding over 30 yrs
- 0.0%
- Est. flood insurance / yr
- $473 – $860
Fire risk 2/10 · Minimal
- Est. fire insurance / yr
- $713 – $1,323
Heat risk 3/10 · Minor
- Hot days now (above 96°F)
- 8 days/yr
- Hot days in 30 yrs
- 19 days/yr
Wind risk 1/10 · Minimal
- Chance of severe wind over 30 yrs
- —
Air-quality risk 2/10 · Minimal
- Unhealthy air days now
- 1 days/yr
- Unhealthy air days in 30 yrs
- 1 days/yr
Risk factors via First Street. Map © Google.
Why this score? — see what drove the B+ grade
The composite is a weighted blend of 9 inputs, each scored 0–100. Each bar is that input's sub-score; the figure is the points it added to the 100-point composite (weight × sub-score).
- Cash flow +30.0/30.0
- ARV discount +15.0/15.0
- 1% rule +10.0/10.0
- DSCR +10.0/10.0
- Schools +4.3/10.0
- Livability +3.5/5.0
- Rent growth +2.5/5.0
- Condition / age +2.5/5.0
- Appreciation +0.0/10.0
$84,527
🖨 Deal sheet 📄 Offer letter ✓ Due diligence
Listing remarks
Why rent when you can own? This move-in ready home offers an excellent opportunity for a first-time buyer to start building equity while enjoying the comfort of a well-maintained property. Major updates were completed in 2022, including a durable steel roof, furnace, central air, and hot water tank—giving you confidence that the major mechanicals have already been addressed. Inside, you’ll find an updated kitchen and bathroom, along with a clean, functional layout that makes everyday living simple and comfortable. Energy-efficient windows contribute to lower utility costs and year-round efficiency. The inviting front porch offers a great place to sit and unwind, whether you&rsqu
Key facts
- Private deck
- Front porch
- Steel roof
Tags
Neighborhood map
What this means for you Summary
Snapshot
- This is a 2-bed/1.0-bath single-family listed at $85k.
Deal economics
- At list price, monthly cash flow is $493 ($6k/yr) — positive.
- The deal already cash-flows at list — no discount required.
- Meets the 1% rule at list price ($1k rent vs $85k).
Location & tenants
- Location reads 70/100 on livability (#453 in OH) — a middle-class / working-renter tenant base. Strengths: crime A+, cost of living A+, housing A+; Watch: health & safety C-, employment D, amenities F.
- Lisbon Exempted Village (town): math 47% / reading 55% proficiency, ranked #436 of 656 in OH (top 66%) — acceptable for families but not a draw, mixed tenant base, ~2y average lease.
- Market conditions: 31 active listings in the ZIP; 49 units permitted in Columbiana County in 2024 (0 in 5+ unit buildings).
Forward outlook
- Local home prices are declining (-3.0%/yr); year-one equity from $584 of loan paydown is wiped out by about $3k of value loss. Plan a longer hold.
- Columbiana County population projected at -23% by 2050 — secular population decline; favor cash flow + early exit over multi-decade hold.
- At projected returns (-3.0% appreciation + 3.0% rent growth), your $24k cash investment doubles in ~5 years — after that, you're playing with house money.
Negotiation context
- Only 3 days on market — expect competitive offers; lowballing is unlikely to land.
- 5 sale attempts since 18y ago with the ask held roughly flat each time — persistent listings suggest the price (not the market) is what's stuck; bring a comps-based counter.
- Current owner paid $48k; list at $85k implies a 76% gain — meaningful room to come down on a strong offer.
Risks & watch-outs
- Watch-outs: built in 1900 — expect roof / HVAC / electrical / plumbing capex.
Questions for the listing agent
- Built in 1900 — when were the roof, HVAC, electrical panel, plumbing, and water heater last replaced?
- Is there a deadline driving the sale (1031 exchange, divorce, estate, relocation)? That informs how much negotiation room exists.
- Schools are B-rated — typically a magnet for longer-tenancy family renters. What's the average tenant stay here, and is there a school-zone premium baked into asking?
- What's the average days-on-market for RENTAL listings here right now (not sales)? A rising rental-DOM trend means longer vacancies and softer asking-rent achievability than the comps imply.
- What's the recent tenant-quality profile in this submarket — average credit score on applications, eviction rate, late-payment / NSF rate, and stable-employment percentage? A property-management company in the area should have these aggregated.
- How much new for-sale + rental construction is in the pipeline within 1–3 miles? Heavy new supply typically softens prices + rents 12–24 months out; constrained supply supports both.
Investment metrics
- 1% rule
- 1.54% ✓
- Cap rate
- 13.29%
- Cash-on-cash
- 24.97%
- DSCR
- 2.11
- GRM
- 5.4
CMA / ARV
- ARV (on-the-fly)
- $132,662
- Comps found
- 12
Show comp detail 12 sales within ~0.75 mi
| Address | Dist | Beds/Ba | Sqft | Sold | Price | $/sf | Match |
|---|---|---|---|---|---|---|---|
| 236 N Market St | 0.21mi | 2/2.5 | 1,152 (-2%) | 3mo | $127,500 | $111 | 79 |
| 224 E Pine St | 0.34mi | 2/1.5 | 1,184 (+1%) | 12mo | $137,500 | $116 | 70 |
| 9 Prospect St | 0.52mi | 3/1.0 (+1) | 1,136 (-3%) | 1mo | $130,500 | $115 | 64 |
| 121 Jerome St | 0.44mi | 2/1.0 | 1,074 (-8%) | 3mo | $25,000 | $23 | 63 |
| 305 E Chestnut St | 0.29mi | 2/1.0 | 1,320 (+12%) | 10mo | $105,000 | $80 | 58 |
| 205 E High St | 0.28mi | 2/2.0 | 1,248 (+6%) | 20mo | $128,900 | $103 | 56 |
| 8382 Pritchard Ave | 0.61mi | 3/1.0 (+1) | 1,120 (-5%) | 8mo | $24,000 | $21 | 53 |
| 131 Mckinley Ave | 0.63mi | 3/1.0 (+1) | 1,054 (-10%) | 6mo | $92,000 | $87 | 44 |
| 526 N Beaver St | 0.42mi | 3/1.5 (+1) | 1,328 (+13%) | 14mo | $150,000 | $113 | 40 |
| 625 N Beaver St | 0.47mi | 3/1.0 (+1) | 1,344 (+14%) | 12mo | $154,000 | $115 | 39 |
| 739 Sunset Dr | 0.66mi | 3/2.0 (+1) | 1,008 (-14%) | 1mo | $210,000 | $208 | 36 |
| 719 Sunset Dr | 0.58mi | 2/2.0 | 997 (-15%) | 12mo | $155,000 | $155 | 34 |
Match score weights: distance 35% · size 25% · config 20% · recency 20%. Top-matched comps best support the ARV.
Projected returns pro-forma
-3.0% appreciation · 3.0% rent growth · sell at horizon
- IRR
- 18.4%
- Equity multiple
- 1.75×
- Total profit
- $17,662
- Equity at exit
- $12,603
- IRR
- 26.8%
- Equity multiple
- 3.35×
- Total profit
- $55,731
- Equity at exit
- $7,308
Cash invested: $23,668 (down + closing). Projections, not guarantees.
Landlord ↔ Tenant lean methodology
- Overall (STATE)
- 73 Landlord-Friendly
- State Ohio
- 73 Landlord-Friendly · R+6
- County
- — inherits STATE
- City
- — inherits STATE
ZIP-level market 44432
- Home prices YoY
- -24.8%
- Active inventory
- 31
- Price-to-rent
- 5.4×
Monthly cashflow live
- Estimated rent
- $1,302 medium interval (Pro) →
- Mortgage (P&I)
- −$443
- Tax from tax record
- −$57 /mo · $687/yr
- Insurance
- −$35
- HOA
- −$0
- Vacancy / Maint / Mgmt
- −$273
- Net cashflow
- $493
Break-even live
UW: 25.0% down · 7.5% · 30yr · 1.5% tax · 5.0% vac · 8.0% maint · 8.0% mgmt
Financing live
Cash to close
- Down payment
- $21,132
- Closing costs
- $2,536
- Reserves months
- —
- Total cash needed
- —
Loan-product check · same deal, 3 products live
Conventional
25% down · 7.5% · 30yr
- Down + closing
- —
- Monthly P&I
- —
- Monthly cashflow
- —
- DSCR
- —
- Eligible?
- —
Personal DTI + credit; lowest rate.
DSCR
20% down · 8.5% · 30yr
- Down + closing
- —
- Monthly P&I
- —
- Monthly cashflow
- —
- DSCR
- —
- Eligible?
- —
No personal income docs; deal must DSCR.
Hard money
10% down · 12.0% · 12mo
- Down + closing
- —
- Monthly P&I
- —
- Monthly cashflow
- —
- DSCR
- —
- Eligible?
- —
Short-term bridge; refi at stabilization.
Listing history 14 events
-
2026-03-29status Pending
-
2026-03-26$84,527 Active
-
2025-10-01historical
-
2025-07-30$129,900 Active
-
2025-06-13historical
-
2025-03-11price $129,900
-
2025-01-30price $134,900
-
2024-12-13$139,900 Active
-
2024-06-05historical
-
2024-03-14price $124,000
-
2023-09-15$129,000 Active
-
2022-03-04soldstatus $47,900
-
2009-03-18soldstatus $18,000
-
2008-11-05$23,000
ⓘ Source: listings_history table (triggers on properties + properties_extension) + one-shot
backfill from property_details.listing_events for pre-trigger history.
Tax reassessment forecast OH · Partial reset (capped growth)
- Current annual tax
- $687 · $57/mo
- Projected year-2 tax
- $1,003 · $84/mo
- Expected delta
- +$316/yr (+$26/mo · 45.9%)
ⓘ Screening estimate from a state-policy table — verify with the county assessor before closing.
Climate risk First Street
- Flood 1/10 Low FEMA zone X (unshaded) · 0% chance over 30 yrs
- Wildfire 2/10 Low
- Heat 3/10 Moderate 8 d/yr ≥96°F today · 19 d/yr by 30 yrs out
- Wind 1/10 Low
- Air quality 2/10 Low 1 unhealthy d/yr today · 1 by 30 yrs out
Nearby sold comps map
Loading sold comps map…
Walkable amenities ~0.75 mi
Loading nearby amenities…
Taxation est. · year 1
- Rental income
- $15,620
- − Mortgage interest
- −$4,735
- − Property taxes
- −$687
- − Insurance
- −$423
- − Repairs & maintenance
- −$1,250
- − Management
- −$1,250
- − Depreciation
- −$2,459
- Taxable income
- $4,817
- Est. tax owed @ 24.0%
- −$1,156
- After-tax cash flow
- $4,754/yr
For passive investors: Depreciation is non-cash, so a rental often shows a tax loss while cash-flowing — sheltering income. Rental losses are passive: they offset passive income freely, and up to $25,000/yr can offset ordinary (W-2) income if you actively participate and your MAGI is under $100k (phasing out to $0 by $150k); unused losses carry forward. On sale, claimed depreciation is recaptured at up to 25%, and gains may owe capital-gains tax (a 1031 exchange can defer both). Figures are a year-1 estimate at your 24.0% rate — not tax advice; consult a CPA.
Schools (NCES district)
- District
- Lisbon Exempted Village
- NCES district ID
- 3904545
- Math proficiency
- 47% ▼ -20.00%
- Reading proficiency
- 55% ▼ -9.00%
- Median HH income
- $40,249
- Composite
- 42.66/100
- National rank
- #3177
- State rank
- #436 of 656 in OH
Livability — Lisbon
- Score
- 70/100
- State rank
- #453
- US rank
- #7377
Category grades
Schools grade is shown separately in the Schools card above.
Census & demographics
- Census place
- Lisbon, OH
- County
- Columbiana · 99,532 people
- Population (ZIP)
- 12,029
- Household income
- $63,173
- Rent vs Own
- Severe rent burden
- 7.7
Population outlook (Columbiana County) Hauer SSP2
- Today (2025)
- 98,353 people
- By 2030
- 94,225 · -4.2%
- By 2040
- 85,169 · -13.4%
- By 2050
- 76,157 · -22.6%
- By 2075
- 58,451 · -40.6%
- By 2100
- 42,805 · -56.5%
Race, ethnicity, and origin ACS 2023
- Neighborhood character
- Predominantly White (86%)
- Race & ethnicity
- White 86% Black 6% Hispanic / Latino 4% Two or more races 4%
- Common ancestry
- Iranian 2% Slovak 2% Italian 2%
- Foreign-born
- 2% · Canada
- Languages at home
- 97% English-only · Spanish 2%
Political lean MEDSL · Columbiana
- 2024 margin
- Solid R (+49.0) · D 25.1% · R 74.1%
- 2008→2024 swing
- -41.4pp toward R · 2008: -7.6pp · 2024: -49.0pp
- All cycles
- 2024: R+49.0 2020: R+44.9 2016: R+41.6 2012: R+12.0 2008: R+7.6
Not yet ingested
- Civics
- —
Market trends
- HPI YoY
- ▼ -75.65%
- Current HPI
- 229.991
- Rent YoY
- —
- Metro
- —
- State GDP YoY
- ▲ 1.98%
- F500 in state
- 48
Industry mix (Fortune 500 HQ in OH)
| Industry | F500 HQs | Revenue |
|---|---|---|
| Insurance | 3 | $145B |
|
||
| Industrial Machinery | 3 | $49B |
|
||
| Financial Services | 3 | $24B |
|
||
| Consumer Goods | 2 | $93B |
|
||
| Aerospace / Defense | 2 | $47B |
|
||
| Utilities | 2 | $33B |
|
||
Price history
+267.5% since first listed14 events — show timeline
- 2026-03-29 Pending — MLSNOW
- 2026-03-26 Listed $84,527 MLSNOW
- 2025-10-01 Listing Removed — MLSNOW
- 2025-07-30 Listed $129,900 MLSNOW
- 2025-06-13 Listing Removed — MLSNOW
- 2025-03-11 Price Changed $129,900 MLSNOW
- 2025-01-30 Price Changed $134,900 MLSNOW
- 2024-12-13 Listed $139,900 MLSNOW
- 2024-06-05 Listing Removed — MLSNOW
- 2024-03-14 Price Changed $124,000 MLSNOW
- 2023-09-15 Listed $129,000 MLSNOW
- 2022-03-04 Sold (Public Records) $47,900 Public Records
- 2009-03-18 Sold (MLS) $18,000 MLSNOW
- 2008-11-05 Listed $23,000 MLSNOW
Property tax history
+4.8%/yrLatest (2025): $687 · +12.4% YoY. Source: county tax records.
Cash-flow waterfall
monthlySold comps — $/sqft
last 12 mo · ≤1 miLoading sold comps…