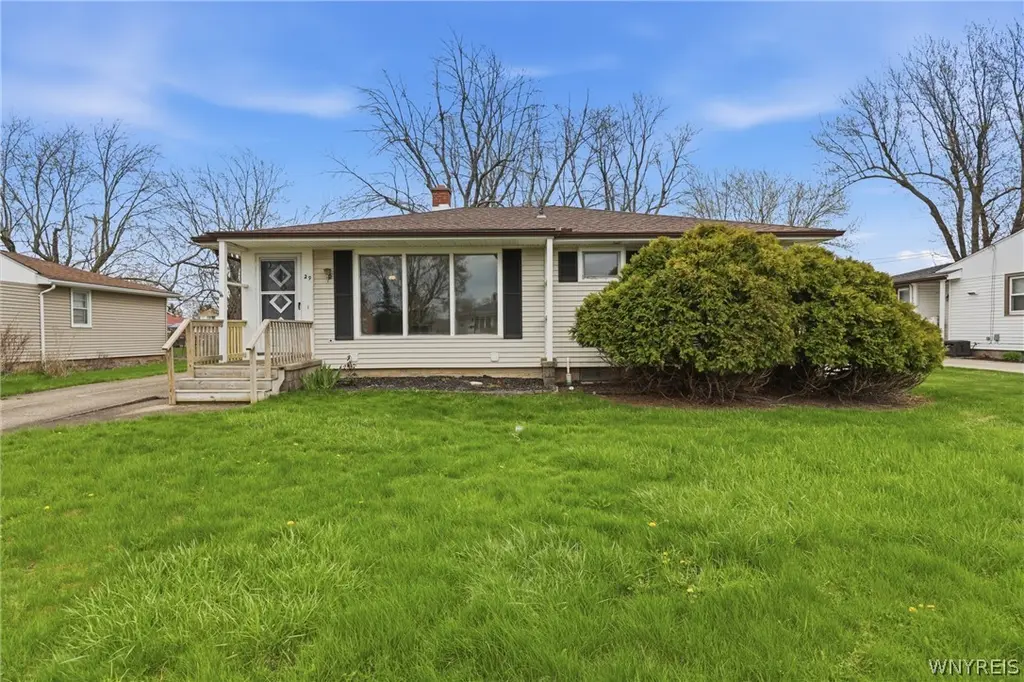
29 Overbrook Ave · Tonawanda Town, NY
Flood risk 4/10 · Minor
- FEMA flood zone
- X (unshaded)
- Chance of flooding over 30 yrs
- 0.2%
- Est. flood insurance / yr
- $473 – $860
Fire risk 1/10 · Minimal
- Est. fire insurance / yr
- $691 – $1,283
Heat risk 3/10 · Minor
- Hot days now (above 93°F)
- 7 days/yr
- Hot days in 30 yrs
- 15 days/yr
Wind risk 1/10 · Minimal
- Chance of severe wind over 30 yrs
- —
Air-quality risk 3/10 · Minor
- Unhealthy air days now
- 2 days/yr
- Unhealthy air days in 30 yrs
- 3 days/yr
Risk factors via First Street. Map © Google.
Why this score? — see what drove the D+ grade
The composite is a weighted blend of 9 inputs, each scored 0–100. Each bar is that input's sub-score; the figure is the points it added to the 100-point composite (weight × sub-score).
- ARV discount +15.0/15.0
- Cash flow +12.2/30.0
- 1% rule +5.0/10.0
- Rent growth +4.2/5.0
- Schools +3.9/10.0
- DSCR +3.6/10.0
- Livability +2.5/5.0
- Condition / age +2.5/5.0
- Appreciation +0.0/10.0
$219,900
🖨 Deal sheet 📄 Offer letter ✓ Due diligence
Listing remarks
Flexible Ranch in Town Of Tonawanda Nice Schools . Located close to a ton of shopping, entertainment-movie theatres, sports and recreational facilities, restaurants . Or Relax in your comfortable ranch. In the Town of Tonawanda Move in ready, well built sturdy ranch, meets multiple needs- Nice size and comfortable space. Detached Garage. Nice House. Some updates Showing starts Wendesday 4/29/26 , Open House Saturday 5/2/26 11 am - 1 pm. Offers Due Tuesday 5/5/26 at 12 pm noon. Thanks
Key facts
- Close to restaurants
- Move in ready
- Close to shopping
Tags
Property features AI
Exterior
- Parking: Detached garage
- Utilities: Public water (connected); Sewer connected
- Home design: One-story property; Existing (resale) condition; Vinyl siding
- Construction: Block foundation
- Exterior features: Concrete driveway; Rectangular lot (approx. 67 x 138 feet)
Interior
- Kitchen: Electric oven; Electric range; Refrigerator
- Bedrooms: Three main-level bedrooms (first floor)
- Flooring: Carpet; Laminate; Vinyl; Varies
- Bathrooms: Two full bathrooms, one of which is on the main level
- Heating & cooling: Gas forced-air heating; Central air conditioning
- Interior features: Eat-in kitchen; Other interior features (see remarks)
- Laundry & utility: Dryer; Gas water heater
Neighborhood map
What this means for you Summary
Snapshot
- This is a 3-bed/2.0-bath single-family listed at $220k.
Deal economics
- At list price, monthly cash flow is $-43 ($-516/yr) — negative.
- To cash-flow at today's rent, offer at most $212k (3.5% below list).
- To meet the 1% rule (rent ≥ 1% of price), the offer needs to be $219k (0.4% below list).
- Recommended offer: $212k (3.5% below list) — sets the bar for cash-flow.
- Cap rate 6.1% vs local median 4.1% in Tonawanda Town — top-decile yield for the area; either an underpriced asset or a hidden risk that comps aren't pricing in. Stress-test before assuming the spread holds.
Location & tenants
- Location reads: area grade D — affects rentability + tenant quality, not the cash-flow math above.
- Kenmore-Tonawanda Union Free School District (suburban): math 44% / reading 47% proficiency, ranked #453 of 590 in NY (top 77%) — families likely to look elsewhere, expect single-tenant / working-renter base with shorter leases.
- Market conditions: Rents rising fast (+6.8%/yr); 191 active listings in the ZIP; 10 comparable units currently listed for rent nearby; rentals at typical pace (median 20d on market — plan ~3-4 weeks tenant-placement turnaround); 1,244 units permitted in Erie County in 2024 (563 in 5+ unit buildings).
- This rent runs 37% of the median local income ($71k/yr) — at the standard rent-burdened threshold; future hikes will face affordability resistance.
Forward outlook
- Local home prices are declining (-3.0%/yr); year-one equity from $2k of loan paydown is wiped out by about $7k of value loss. Plan a longer hold.
Negotiation context
- Only 6 days on market — expect competitive offers; lowballing is unlikely to land.
Risks & watch-outs
- Watch-outs: property tax is 2.9% of price; built in 1951 — expect roof / HVAC / electrical / plumbing capex.
Questions for the listing agent
- What do current leases actually rent for vs. the listed asking? Can we see a recent rent roll and the last 12 months of T-12 income?
- Built in 1951 — when were the roof, HVAC, electrical panel, plumbing, and water heater last replaced?
- Property tax is high relative to price — has the assessment been appealed recently, and will the sale trigger a re-assessment?
- Is there a deadline driving the sale (1031 exchange, divorce, estate, relocation)? That informs how much negotiation room exists.
- The area grade is low — what's the realistic commute time and amenity access for the typical tenant pool here? Any planned neighborhood developments (good or bad) we should know about?
- What's the average days-on-market for RENTAL listings here right now (not sales)? A rising rental-DOM trend means longer vacancies and softer asking-rent achievability than the comps imply.
- What's the recent tenant-quality profile in this submarket — average credit score on applications, eviction rate, late-payment / NSF rate, and stable-employment percentage? A property-management company in the area should have these aggregated.
- How much new for-sale + rental construction is in the pipeline within 1–3 miles? Heavy new supply typically softens prices + rents 12–24 months out; constrained supply supports both.
Investment metrics
- 1% rule
- 1.00% ✗
- Cap rate
- 6.06%
- Cash-on-cash
- -0.84%
- DSCR
- 0.96
- GRM
- 8.4
CMA / ARV
- ARV (on-the-fly)
- $264,690
- Comps found
- 12
Show comp detail 12 sales within ~0.75 mi
| Address | Dist | Beds/Ba | Sqft | Sold | Price | $/sf | Match |
|---|---|---|---|---|---|---|---|
| 132 Overbrook Ave | 0.19mi | 2/1.0 (-1) | 1,042 (+0%) | 4mo | $261,000 | $250 | 78 |
| 158 Overbrook Ave | 0.24mi | 2/1.0 (-1) | 1,019 (-2%) | 2mo | $255,000 | $250 | 75 |
| 440 Lynbrook Ave | 0.38mi | 3/1.0 | 1,038 (0%) | 7mo | $216,700 | $209 | 73 |
| 615 Lynbrook Ave | 0.56mi | 3/1.0 | 1,038 (0%) | 5mo | $247,900 | $239 | 66 |
| 121 Melody Ln | 0.61mi | 3/2.0 | 1,024 (-1%) | 7mo | $270,000 | $264 | 64 |
| 542 Lynbrook Ave | 0.48mi | 3/1.0 | 1,082 (+4%) | 6mo | $327,500 | $303 | 62 |
| 162 Fries Rd | 0.55mi | 3/1.0 | 972 (-6%) | 3mo | $270,000 | $278 | 58 |
| 83 Melody Ln | 0.66mi | 3/2.0 | 952 (-8%) | 5mo | $272,950 | $287 | 51 |
| 25 Jamaica Rd | 0.65mi | 3/1.0 | 1,150 (+11%) | 3mo | $215,000 | $187 | 45 |
| 98 Jamaica Rd | 0.70mi | 3/1.0 | 909 (-12%) | 1mo | $232,000 | $255 | 42 |
| 125 Springfield Ave | 0.64mi | 3/1.0 | 898 (-14%) | 3mo | $255,000 | $284 | 41 |
| 240 Koenig Rd | 0.68mi | 2/1.0 (-1) | 1,175 (+13%) | 8mo | $211,500 | $180 | 31 |
Match score weights: distance 35% · size 25% · config 20% · recency 20%. Top-matched comps best support the ARV.
Projected returns pro-forma
-3.0% appreciation · 6.75% rent growth · sell at horizon
- IRR
- -12.8%
- Equity multiple
- 0.52×
- Total profit
- $-29,608
- Equity at exit
- $32,788
- IRR
- 1.8%
- Equity multiple
- 1.15×
- Total profit
- $9,467
- Equity at exit
- $19,013
Cash invested: $61,572 (down + closing). Projections, not guarantees.
Landlord ↔ Tenant lean methodology
- Overall (STATE)
- 15 Strongly Tenant-Friendly
- State New York
- 15 Strongly Tenant-Friendly · D+10
- County
- — inherits STATE
- City
- — inherits STATE
ZIP-level market 14150
- Rents YoY
- 6.8%
- Active inventory
- 191
- Price-to-rent
- 8.4×
Monthly cashflow live
- Estimated rent
- $2,190 high interval (Pro) →
- Mortgage (P&I)
- −$1,153
- Tax from tax record
- −$528 /mo · $6,337/yr
- Insurance
- −$92
- HOA
- −$0
- Vacancy / Maint / Mgmt
- −$460
- Net cashflow
- $-43
Break-even live
Sensitivity live
| Price | -10% $82 | -5% $19 | +0% $-43 | +5% $-105 | +10% $-167 |
|---|---|---|---|---|---|
| Rent | -10% $-216 | -5% $-129 | +0% $-43 | +5% $44 | +10% $130 |
| Rate | -1.0pp $68 | -0.5pp $13 | base $-43 | +0.5pp $-100 | +1.0pp $-158 |
UW: 25.0% down · 7.5% · 30yr · 1.5% tax · 5.0% vac · 8.0% maint · 8.0% mgmt
Financing live
Cash to close
- Down payment
- $54,975
- Closing costs
- $6,597
- Reserves months
- —
- Total cash needed
- —
Loan-product check · same deal, 3 products live
Conventional
25% down · 7.5% · 30yr
- Down + closing
- —
- Monthly P&I
- —
- Monthly cashflow
- —
- DSCR
- —
- Eligible?
- —
Personal DTI + credit; lowest rate.
DSCR
20% down · 8.5% · 30yr
- Down + closing
- —
- Monthly P&I
- —
- Monthly cashflow
- —
- DSCR
- —
- Eligible?
- —
No personal income docs; deal must DSCR.
Hard money
10% down · 12.0% · 12mo
- Down + closing
- —
- Monthly P&I
- —
- Monthly cashflow
- —
- DSCR
- —
- Eligible?
- —
Short-term bridge; refi at stabilization.
Rent comps 10 comps
| Address | Beds | Baths | Sqft | Rent | $/sqft | DOM | Units | Dist |
|---|---|---|---|---|---|---|---|---|
| 1257 Brighton Rd Tonawanda, NY | 4.0 | 1.0 | 1268 | $2,500 | $1.97 | 3d | 1 | 0.09mi |
| 1257 Brighton Rd Tonawanda, NY | 4.0 | 1.0 | 1268 | $2,500 | $1.97 | 16d | 1 | 0.09mi |
| 2776 Eggert Rd #2 Tonawanda, NY | 3.0 | 1.0 | 972 | $1,600 | $1.65 | 24d | 1 | 0.65mi |
| 200 Koenig Rd Tonawanda, NY | 2.0 | 1.5 | 1481 | $2,200 | $1.49 | 2d | 1 | 0.67mi |
| 182 Woodcrest Dr Amherst, NY | 3.0 | 1.5 | 1380 | $2,300 | $1.67 | 19d | 1 | 0.76mi |
| 3948 Ridge Lea Rd Unit D Buffalo, NY | 2.0 | 1.0 | 952 | $1,850 | $1.94 | 2d | 1 | 0.81mi |
| 4765 N Bailey Ave Buffalo, NY | 2.0 | 1.0 | 900 | $2,100 | $2.33 | 44d | 1 | 0.84mi |
| 1410 Deer Lakes Dr Amherst, NY | 2.0 | 2.0 | 1300 | $1,995 | $1.53 | 3d | 5 | 1.20mi |
| 4585 Chestnut Ridge Rd #4 Buffalo, NY | 2.0 | 2.0 | 1197 | $1,600 | $1.34 | 24d | 1 | 1.21mi |
| 325 Kaymar Dr Unit 325 Buffalo, NY | 3.0 | 1.0 | 1073 | $1,695 | $1.58 | 44d | 1 | 1.46mi |
Listing history 2 events
-
2026-05-05status Pending
-
2026-04-29$219,900 Active
ⓘ Source: listings_history table (triggers on properties + properties_extension) + one-shot
backfill from property_details.listing_events for pre-trigger history.
Tax reassessment forecast NY · Partial reset (capped growth)
- Current annual tax
- $6,337 · $528/mo
- Projected year-2 tax
- $6,337 · $528/mo
- Expected delta
- $0/yr ($0/mo · 0.0%)
ⓘ Screening estimate from a state-policy table — verify with the county assessor before closing.
Climate risk First Street
- Flood 4/10 Moderate FEMA zone X (unshaded) · 20% chance over 30 yrs
- Wildfire 1/10 Low
- Heat 3/10 Moderate 7 d/yr ≥93°F today · 15 d/yr by 30 yrs out
- Wind 1/10 Low
- Air quality 3/10 Moderate 2 unhealthy d/yr today · 3 by 30 yrs out
Nearby sold comps map
Loading sold comps map…
Walkable amenities ~0.75 mi
Loading nearby amenities…
Taxation est. · year 1
- Rental income
- $26,277
- − Mortgage interest
- −$12,318
- − Property taxes
- −$6,337
- − Insurance
- −$1,100
- − Repairs & maintenance
- −$2,102
- − Management
- −$2,102
- − Depreciation
- −$6,397
- Taxable loss
- −$4,079
- Est. tax savings @ 24.0%
- +$979
- After-tax cash flow
- $463/yr
For passive investors: Depreciation is non-cash, so a rental often shows a tax loss while cash-flowing — sheltering income. Rental losses are passive: they offset passive income freely, and up to $25,000/yr can offset ordinary (W-2) income if you actively participate and your MAGI is under $100k (phasing out to $0 by $150k); unused losses carry forward. On sale, claimed depreciation is recaptured at up to 25%, and gains may owe capital-gains tax (a 1031 exchange can defer both). Figures are a year-1 estimate at your 24.0% rate — not tax advice; consult a CPA.
Schools (NCES district)
- District
- Kenmore-Tonawanda Union Free School District
- NCES district ID
- 3616230
- Math proficiency
- 44% ▼ -12.00%
- Reading proficiency
- 47% ▼ -1.00%
- Median HH income
- $51,433
- Composite
- 39.18/100
- National rank
- #4024
- State rank
- #453 of 590 in NY
Livability — Tonawanda Town
No livability data for this city. (Only ~50 U.S. cities are tracked.)
Census & demographics
- Census place
- Tonawanda Town, NY
- County
- Erie County · 714,559 people
- City population
- 63,948
- Metro
- Buffalo-Cheektowaga, NY
- Population (ZIP)
- 41,260
- Household income
- $71,406
- Rent vs Own
- Severe rent burden
- 1427.0
Population outlook (Erie County) Hauer SSP2
- Today (2025)
- 933,037 people
- By 2030
- 935,181 · +0.2%
- By 2040
- 928,531 · -0.5%
- By 2050
- 905,725 · -2.9%
- By 2075
- 834,037 · -10.6%
- By 2100
- 708,033 · -24.1%
Race, ethnicity, and origin ACS 2023
- Neighborhood character
- Predominantly White (87%)
- Race & ethnicity
- White 87% Two or more races 5% Hispanic / Latino 5% Black 4% Asian 2%
- Common ancestry
- Romanian 13% Lithuanian 3% Slovak 2%
- Foreign-born
- 6% · Canada, Philippines, Vietnam
- Languages at home
- 94% English-only · Other Indo-European 2% Spanish 1% Russian/Polish/Slavic 1%
Political lean MEDSL · Erie
- 2024 margin
- Lean D (+9.7) · D 54.8% · R 45.2%
- 2008→2024 swing
- -7.9pp toward R · 2008: 17.5pp · 2024: 9.7pp
- All cycles
- 2024: D+9.7 2020: D+14.7 2016: D+4.8 2012: D+15.6 2008: D+17.5
Not yet ingested
- Civics
- —
Market trends
- HPI YoY
- ▼ -260.43%
- Current HPI
- 334.5893
- Rent YoY
- ▲ 6.75%
- Metro
- Buffalo-Cheektowaga, NY
- State GDP YoY
- ▲ 2.60%
- F500 in state
- 92
Industry mix (Fortune 500 HQ in NY)
| Industry | F500 HQs | Revenue |
|---|---|---|
| Financial Services | 10 | $950B |
|
||
| Consumer Goods | 9 | $162B |
|
||
| Insurance | 4 | $225B |
|
||
| Telecommunications | 2 | $144B |
|
||
| Pharmaceuticals | 2 | $112B |
|
||
| Media / Entertainment | 2 | $69B |
|
||
Price history
2 events — show timeline
- 2026-05-05 Pending — WNYREIS
- 2026-04-29 Listed $219,900 WNYREIS
Property tax history
+5.3%/yrLatest (2025): $6,337 · +1.1% YoY. Source: county tax records.
Cash-flow waterfall
monthlySold comps — $/sqft
last 12 mo · ≤1 miLoading sold comps…