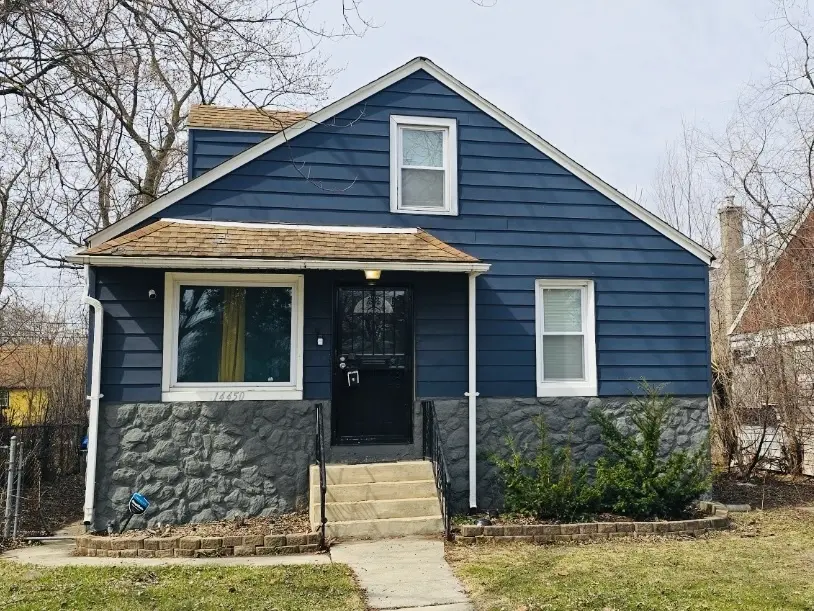
14450 S Sangamon St · Harvey, IL
Flood risk 1/10 · Minimal
- FEMA flood zone
- X (unshaded)
- Chance of flooding over 30 yrs
- 0.0%
- Est. flood insurance / yr
- $473 – $860
Fire risk 1/10 · Minimal
- Est. fire insurance / yr
- $804 – $1,492
Heat risk 3/10 · Minor
- Hot days now (above 102°F)
- 7 days/yr
- Hot days in 30 yrs
- 15 days/yr
Wind risk 2/10 · Minimal
- Chance of severe wind over 30 yrs
- —
Air-quality risk 4/10 · Minor
- Unhealthy air days now
- 4 days/yr
- Unhealthy air days in 30 yrs
- 5 days/yr
Risk factors via First Street. Map © Google.
Why this score? — see what drove the D- grade
The composite is a weighted blend of 9 inputs, each scored 0–100. Each bar is that input's sub-score; the figure is the points it added to the 100-point composite (weight × sub-score).
- Cash flow +11.3/30.0
- Appreciation +10.0/10.0
- 1% rule +3.8/10.0
- Livability +3.4/5.0
- DSCR +3.3/10.0
- Rent growth +2.5/5.0
- Condition / age +2.5/5.0
- Schools +0.7/10.0
- ARV discount +0.0/15.0
$169,900
🖨 Deal sheet (PDF) 📄 Offer letter ✓ Due diligence
Listing remarks MLS
Check out this diamond in the ruff located in Harvey!!! COMPLETELY REHABBED and move-in ready. This beautiful home has original hardwood floors throughout, great space, and perfect for entertaining. Updated features include: new windows, A/C, furnace, water heater, cabinets, countertops, sink, and much more. Enjoy and entertain in the remodeled kitchen and have family dinner in the formal dining room. Home is FHA approved and has already passed the village inspection. Schedule a showing today to make this your new home!!!
Key facts
- 2 garage spots
- Built 1950
- Listed 84 days
Property features AI
Finance
- Other: Fee simple ownership
- HOA & community: No master association fee required
Exterior
- Parking: Detached garage (garage owned); Side driveway; Total parking for 4 vehicles; 2 garage spaces
- Utilities: Public water; Public sewer
- Home design: Detached single-family home; 1.5-story design; Rehab completed in 2022; Built before 1978
- Construction: Aluminum siding and brick/stone exterior; Estimated living area; 71–80 years old
- Exterior features: Lot under 0.25 acre (less than .25 acre); Lot size per county records
Interior
- Kitchen: Kitchen on the main level (approx. 15 x 11)
- Bedrooms: 4 bedrooms (Master bedroom on the main level; additional bedrooms on main and second levels)
- Bathrooms: 1 full bathroom
- Heating & cooling: Natural gas heating; Central air conditioning
- Interior features: Unfinished full basement; 7 total rooms
- Laundry & utility: Laundry in the basement (approx. 6 x 9)
Neighborhood map
What this means for you Summary
Snapshot
- This is a 4-bed/1.0-bath single-family listed at $170k.
Deal economics
- At list price, monthly cash flow is $-63 ($-757/yr) — negative.
- To cash-flow at today's rent, offer at most $159k (6.6% below list).
- To meet the 1% rule (rent ≥ 1% of price), the offer needs to be $150k (12.0% below list).
- Recommended offer: $150k (12.0% below list) — sets the bar for 1% rule.
- Cap rate 5.8% vs local median 9.3% in Harvey — below-typical yield; the buyer is paying a premium for something (appreciation thesis, condition, location) that the cap rate doesn't capture.
Location & tenants
- Location reads 67/100 on livability (#539 in IL) — a middle-class / working-renter tenant base. Strengths: commute A+, cost of living A+, housing A-; Watch: health & safety D+, crime F, amenities F.
- Thornton Twp Hsd 205 (suburban): math 7% / reading 8% proficiency, ranked #594 of 620 in IL (top 96%) — low school quality limits family demand, transient renter base, plan for 1-2y turnover.
- Zoned schools: Thornton Township High School (math 7% / reading 7%, grade F, #605 of 693 statewide, top 87%, 1,628 students, 0% FRL).
- Market conditions: 134 active listings in the ZIP; 1 comparable units currently listed for rent nearby; 6,272 units permitted in Cook County in 2024 (4,658 in 5+ unit buildings).
Forward outlook
- In year one you build about $18k of equity ($1k loan paydown + $17k appreciation (10.0% local appreciation)).
- At projected returns (10.0% appreciation + 3.0% rent growth), your $48k cash investment doubles in ~3 years — after that, you're playing with house money.
- By year 3, paydown + projected appreciation supports a ~$46k cash-out refi (75% LTV) — recoverable capital for the next deal without selling this one.
Negotiation context
- It's been on market 84 days — a 6% lower offer ($160k) is reasonable based on typical stale-listing flexibility.
- 10 sale attempts since 12y ago; this cycle's ask has dropped $10k (6%) from the opening price — seller is motivated, your offer sets the floor, not the list.
Risks & watch-outs
- Watch-outs: built in 1950 — expect roof / HVAC / electrical / plumbing capex.
Questions for the listing agent
- What do current leases actually rent for vs. the listed asking? Can we see a recent rent roll and the last 12 months of T-12 income?
- It's been on market 84 days. Have you received any prior offers? Is the seller open to a 12% concession, seller financing, or rate buy-down credit?
- Built in 1950 — when were the roof, HVAC, electrical panel, plumbing, and water heater last replaced?
- Why hasn't it sold? Are there any deal-killer items the seller is aware of (foundation, flood, title, zoning, code violations)?
- Is there a deadline driving the sale (1031 exchange, divorce, estate, relocation)? That informs how much negotiation room exists.
- Schools are F-rated, which usually means shorter tenancies and higher turnover. Who's the typical renter profile here, and what's been the actual vacancy rate?
- Crime grade is F in this area — have there been break-ins, vandalism, or insurance claims at this property in the last 3 years? What carrier currently insures it and at what premium?
- The area grade is low — what's the realistic commute time and amenity access for the typical tenant pool here? Any planned neighborhood developments (good or bad) we should know about?
- What's the average days-on-market for RENTAL listings here right now (not sales)? A rising rental-DOM trend means longer vacancies and softer asking-rent achievability than the comps imply.
- What's the recent tenant-quality profile in this submarket — average credit score on applications, eviction rate, late-payment / NSF rate, and stable-employment percentage? A property-management company in the area should have these aggregated.
- How much new for-sale + rental construction is in the pipeline within 1–3 miles? Heavy new supply typically softens prices + rents 12–24 months out; constrained supply supports both.
Investment metrics
- 1% rule
- 0.88% ✗
- Cap rate
- 5.85%
- Cash-on-cash
- -1.59%
- DSCR
- 0.93
- GRM
- 9.5
CMA / ARV
- ARV (on-the-fly)
- $140,400
- Comps found
- 12
Show comp detail 12 sales within ~0.75 mi
| Address | Dist | Beds/Ba | Sqft | Sold | Price | $/sf | Match |
|---|---|---|---|---|---|---|---|
| 14817 Lexington Ave | 0.49mi | 3/1.0 (-1) | 946 (+1%) | 5mo | $110,000 | $116 | 66 |
| 14508 Des Plaines St | 0.31mi | 3/3.0 (-1) | 904 (-3%) | 8mo | $59,000 | $65 | 60 |
| 14533 Ashland Ave | 0.54mi | 4/1.0 | 960 (+3%) | 13mo | $58,000 | $60 | 60 |
| 14455 Des Plaines St | 0.34mi | 3/1.0 (-1) | 1,035 (+11%) | 4mo | $155,000 | $150 | 58 |
| 14320 Parnell Ave | 0.53mi | 3/2.0 (-1) | 912 (-3%) | 5mo | $127,000 | $139 | 58 |
| 23 W 143 St | 0.69mi | 4/1.0 | 984 (+5%) | 5mo | $155,000 | $158 | 55 |
| 14609 Justine St | 0.51mi | 3/2.0 (-1) | 1,000 (+7%) | 6mo | $237,500 | $238 | 51 |
| 14103 Marshfield Ave | 0.73mi | 3/1.0 (-1) | 960 (+3%) | 8mo | $177,000 | $184 | 50 |
| 34 W 142nd St | 0.72mi | 3/1.0 (-1) | 960 (+3%) | 9mo | $175,000 | $182 | 49 |
| 42 E 149th St | 0.68mi | 3/1.0 (-1) | 900 (-4%) | 11mo | $100,000 | $111 | 48 |
| 14301 Parnell Ave | 0.57mi | 3/2.0 (-1) | 1,008 (+8%) | 5mo | $217,000 | $215 | 47 |
| 14931 Center Ave | 0.60mi | 4/2.0 | 1,071 (+14%) | 12mo | $100,000 | $93 | 33 |
Match score weights: distance 35% · size 25% · config 20% · recency 20%. Top-matched comps best support the ARV.
Projected returns pro-forma
10.0% appreciation · 3.0% rent growth · sell at horizon
- IRR
- 23.2%
- Equity multiple
- 2.86×
- Total profit
- $88,579
- Equity at exit
- $153,059
- IRR
- 20.7%
- Equity multiple
- 6.55×
- Total profit
- $264,140
- Equity at exit
- $330,078
Cash invested: $47,572 (down + closing). Projections, not guarantees.
Landlord ↔ Tenant lean methodology
- Overall (STATE)
- 43 Moderately Tenant-Leaning
- State Illinois
- 43 Moderately Tenant-Leaning · D+7
- County
- — inherits STATE
- City
- — inherits STATE
ZIP-level market 60426
- Home prices YoY
- 6.9%
- Active inventory
- 134
- Price-to-rent
- 9.5×
Monthly cashflow live
- Estimated rent
- $1,495 medium interval (Pro) →
- Mortgage (P&I)
- −$891
- Tax from tax record
- −$282 /mo · $3,389/yr
- Insurance
- −$71
- HOA
- −$0
- Vacancy / Maint / Mgmt
- −$314
- Net cashflow
- $-63
Break-even live
Sensitivity live
| Price | -10% $33 | -5% $-15 | +0% $-63 | +5% $-111 | +10% $-159 |
|---|---|---|---|---|---|
| Rent | -10% $-181 | -5% $-122 | +0% $-63 | +5% $-4 | +10% $55 |
| Rate | -1.0pp $22 | -0.5pp $-20 | base $-63 | +0.5pp $-107 | +1.0pp $-152 |
UW: 25.0% down · 7.5% · 30yr · 1.5% tax · 5.0% vac · 8.0% maint · 8.0% mgmt
Financing live
Cash to close
- Down payment
- $42,475
- Closing costs
- $5,097
- Reserves months
- —
- Total cash needed
- —
Loan-product check · same deal, 3 products live
Conventional
25% down · 7.5% · 30yr
- Down + closing
- —
- Monthly P&I
- —
- Monthly cashflow
- —
- DSCR
- —
- Eligible?
- —
Personal DTI + credit; lowest rate.
DSCR
20% down · 8.5% · 30yr
- Down + closing
- —
- Monthly P&I
- —
- Monthly cashflow
- —
- DSCR
- —
- Eligible?
- —
No personal income docs; deal must DSCR.
Hard money
10% down · 12.0% · 12mo
- Down + closing
- —
- Monthly P&I
- —
- Monthly cashflow
- —
- DSCR
- —
- Eligible?
- —
Short-term bridge; refi at stabilization.
Rent comps 1 comps
| Address | Beds | Baths | Sqft | Rent | $/sqft | DOM | Units | Dist |
|---|---|---|---|---|---|---|---|---|
| 14629 Hoyne Ave Dixmoor, IL | 3.0 | 1.0 | 920 | $1,495 | $1.62 | 25d | 1 | 1.21mi |
Listing history 43 events
-
2026-06-18days on market $169,900 Active 84 DOM
-
2026-06-17days on market $169,900 Active 83 DOM
-
2026-06-16days on market $169,900 Active 82 DOM
-
2026-06-15days on market $169,900 Active 81 DOM
-
2026-06-13days on market $169,900 Active 79 DOM
-
2026-06-13days on market $169,900 Active 78 DOM
-
2026-06-09days on market $169,900 Active 75 DOM
-
2026-06-08days on market $169,900 Active 74 DOM
-
2026-06-07days on market $169,900 Active 73 DOM
-
2026-06-04days on market $169,900 Active 70 DOM
-
2026-06-03days on market $169,900 Active 69 DOM
-
2026-06-02days on market $169,900 Active 68 DOM
-
2026-06-01days on market $169,900 Active 67 DOM
-
2026-05-31days on market $169,900 Active 66 DOM
-
2026-05-22price $169,900
-
2026-03-26$179,999 Active
-
2026-03-26historical
-
2026-01-30Active
-
2022-07-21soldstatus $160,000
-
2022-07-14soldstatus $160,000 Closed 530-char remark
Show marketing remark (530 chars)
Check out this diamond in the ruff located in Harvey!!! COMPLETELY REHABBED and move-in ready. This beautiful home has original hardwood floors throughout, great space, and perfect for entertaining. Updated features include: new windows, A/C, furnace, water heater, cabinets, countertops, sink, and much more. Enjoy and entertain in the remodeled kitchen and have family dinner in the formal dining room. Home is FHA approved and has already passed the village inspection. Schedule a showing today to make this your new home!!!
-
2022-06-01historical Contingent - Continue to Show 530-char remark
Show marketing remark (530 chars)
Check out this diamond in the ruff located in Harvey!!! COMPLETELY REHABBED and move-in ready. This beautiful home has original hardwood floors throughout, great space, and perfect for entertaining. Updated features include: new windows, A/C, furnace, water heater, cabinets, countertops, sink, and much more. Enjoy and entertain in the remodeled kitchen and have family dinner in the formal dining room. Home is FHA approved and has already passed the village inspection. Schedule a showing today to make this your new home!!!
-
2022-05-23$163,000 Active 530-char remark
Show marketing remark (530 chars)
Check out this diamond in the ruff located in Harvey!!! COMPLETELY REHABBED and move-in ready. This beautiful home has original hardwood floors throughout, great space, and perfect for entertaining. Updated features include: new windows, A/C, furnace, water heater, cabinets, countertops, sink, and much more. Enjoy and entertain in the remodeled kitchen and have family dinner in the formal dining room. Home is FHA approved and has already passed the village inspection. Schedule a showing today to make this your new home!!!
-
2022-05-21historical
-
2022-05-19status Active
-
2022-05-19price
-
2022-03-13historical Contingent - No Showings
-
2022-03-06price
-
2022-02-22status Active
-
2022-02-15historical Contingent - No Showings
-
2022-01-08price
-
2021-11-24price
-
2021-11-04Active
-
2021-02-01soldstatus $34,206 Closed Sale
-
2020-12-26status Pending
-
2020-12-10$20,000 New
-
2018-08-14historical
-
2018-07-19status Back On Market
-
2018-06-30historical
-
2018-06-12price
-
2018-03-19New
-
2014-05-08historical
-
2014-03-25New
-
2009-10-14soldstatus $75,000
ⓘ Source: listings_history table (triggers on properties + properties_extension) + one-shot
backfill from property_details.listing_events for pre-trigger history.
Tax reassessment forecast IL · Partial reset (capped growth)
- Current annual tax
- $3,389 · $282/mo
- Projected year-2 tax
- $3,623 · $302/mo
- Expected delta
- +$234/yr (+$20/mo · 6.9%)
ⓘ Screening estimate from a state-policy table — verify with the county assessor before closing.
Climate risk First Street
- Flood 1/10 Low FEMA zone X (unshaded) · 0% chance over 30 yrs
- Wildfire 1/10 Low
- Heat 3/10 Moderate 7 d/yr ≥102°F today · 15 d/yr by 30 yrs out
- Wind 2/10 Low
- Air quality 4/10 Moderate 4 unhealthy d/yr today · 5 by 30 yrs out
Nearby sold comps map
Loading sold comps map…
Walkable amenities ~0.75 mi
Loading nearby amenities…
Taxation est. · year 1
- Rental income
- $17,940
- − Mortgage interest
- −$9,517
- − Property taxes
- −$3,389
- − Insurance
- −$850
- − Repairs & maintenance
- −$1,435
- − Management
- −$1,435
- − Depreciation
- −$4,943
- Taxable loss
- −$3,628
- Est. tax savings @ 24.0%
- +$871
- After-tax cash flow
- $114/yr
For passive investors: Depreciation is non-cash, so a rental often shows a tax loss while cash-flowing — sheltering income. Rental losses are passive: they offset passive income freely, and up to $25,000/yr can offset ordinary (W-2) income if you actively participate and your MAGI is under $100k (phasing out to $0 by $150k); unused losses carry forward. On sale, claimed depreciation is recaptured at up to 25%, and gains may owe capital-gains tax (a 1031 exchange can defer both). Figures are a year-1 estimate at your 24.0% rate — not tax advice; consult a CPA.
Schools (NCES district)
- District
- Thornton Twp Hsd 205
- NCES district ID
- 1738970
- Math proficiency
- 7% ▬ 0.00%
- Reading proficiency
- 8% ▼ -2.00%
- Median HH income
- $43,392
- Composite
- 6.92/100
- National rank
- #9976
- State rank
- #594 of 620 in IL
Livability — Harvey
- Score
- 67/100
- State rank
- #539
- US rank
- #11162
Category grades
Schools grade is shown separately in the Schools card above.
Census & demographics
- Census place
- Harvey, IL
- City population
- 23,066
- Population (ZIP)
- 23,066
Population outlook (Cook County) Hauer SSP2
- Today (2025)
- 5,347,519 people
- By 2030
- 5,357,703 · +0.2%
- By 2040
- 5,324,924 · -0.4%
- By 2050
- 5,230,762 · -2.2%
- By 2075
- 4,785,735 · -10.5%
- By 2100
- 4,188,836 · -21.7%
Race, ethnicity, and origin ACS 2023
- Neighborhood character
- Majority Black (59%)
- Race & ethnicity
- Black 59% Hispanic / Latino 33% Two or more races 12% White 3% Asian 2%
- Hispanic origin (detail)
- Mexican 31%
- Foreign-born
- 17% · Canada
- Languages at home
- 67% English-only · Spanish 30% Other Indo-European 2% French/Haitian/Cajun 1%
Political lean MEDSL · Cook
- 2024 margin
- Solid D (+42.0) · D 70.4% · R 28.4% · Other 1.2%
- 2008→2024 swing
- -11.4pp toward R · 2008: 53.4pp · 2024: 42.0pp
- All cycles
- 2024: D+42.0 2020: D+50.3 2016: D+53.0 2012: D+49.4 2008: D+53.4
Not yet ingested
- Civics
- —
Market trends
- HPI YoY
- ▲ 20.36%
- Current HPI
- 313.7895
- Rent YoY
- —
- Metro
- —
- State GDP YoY
- ▲ 1.59%
- F500 in state
- 60
Industry mix (Fortune 500 HQ in IL)
| Industry | F500 HQs | Revenue |
|---|---|---|
| Insurance | 4 | $201B |
|
||
| Consumer Goods | 4 | $87B |
|
||
| Industrial Machinery | 3 | $64B |
|
||
| Healthcare | 2 | $55B |
|
||
| Retail / Pharmacy | 1 | $148B |
|
||
| Agriculture / Food | 1 | $86B |
|
||
Price history
+126.5% since first listed29 events — show timeline
- 2026-05-22 Price Changed $169,900 MRED as Distributed by MLS Grid
- 2026-03-26 Listing Removed — MRED as Distributed by MLS Grid
- 2026-03-26 Listed $179,999 MRED as Distributed by MLS Grid
- 2026-01-30 Listed — MRED as Distributed by MLS Grid
- 2022-07-21 Sold (Public Records) $160,000 Public Records
- 2022-07-14 Sold (MLS) $160,000 MRED as Distributed by MLS Grid
- 2022-06-01 Contingent — MRED as Distributed by MLS Grid
- 2022-05-23 Listed $163,000 MRED as Distributed by MLS Grid
- 2022-05-21 Listing Removed — MRED as Distributed by MLS Grid
- 2022-05-19 Relisted — MRED as Distributed by MLS Grid
- 2022-05-19 Price Changed — MRED as Distributed by MLS Grid
- 2022-03-13 Contingent — MRED as Distributed by MLS Grid
- 2022-03-06 Price Changed — MRED as Distributed by MLS Grid
- 2022-02-22 Relisted — MRED as Distributed by MLS Grid
- 2022-02-15 Contingent — MRED as Distributed by MLS Grid
- 2022-01-08 Price Changed — MRED as Distributed by MLS Grid
- 2021-11-24 Price Changed — MRED as Distributed by MLS Grid
- 2021-11-04 Listed — MRED as Distributed by MLS Grid
- 2021-02-01 Sold (MLS) $34,206 MRED as Distributed by MLS Grid
- 2020-12-26 Pending — MRED as Distributed by MLS Grid
- 2020-12-10 Listed $20,000 MRED as Distributed by MLS Grid
- 2018-08-14 Listing Removed — MRED as Distributed by MLS Grid
- 2018-07-19 Relisted — MRED as Distributed by MLS Grid
- 2018-06-30 Listing Removed — MRED as Distributed by MLS Grid
- 2018-06-12 Price Changed — MRED as Distributed by MLS Grid
- 2018-03-19 Listed — MRED as Distributed by MLS Grid
- 2014-05-08 Listing Removed — MRED as Distributed by MLS Grid
- 2014-03-25 Listed — MRED as Distributed by MLS Grid
- 2009-10-14 Sold (Public Records) $75,000 Public Records
Property tax history
+1.6%/yrLatest (2023): $3,389 · -22.8% YoY. Source: county tax records.
Cash-flow waterfall
monthlySold comps — $/sqft
last 12 mo · ≤1 miLoading sold comps…