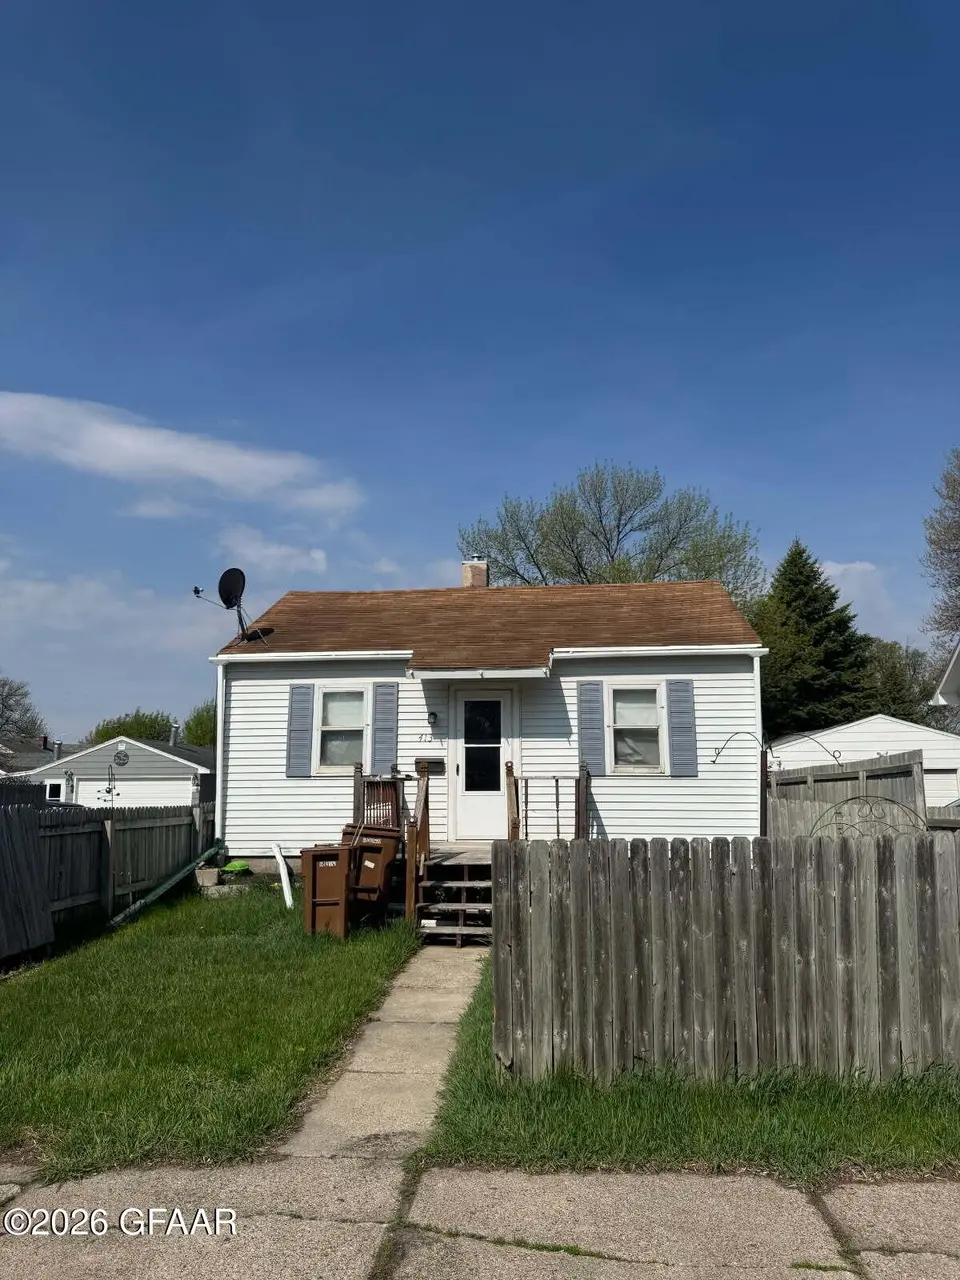
413 4th Ave NE · East Grand Forks, MN
Flood risk 1/10 · Minimal
- FEMA flood zone
- —
- Chance of flooding over 30 yrs
- 0.0%
- Est. flood insurance / yr
- —
Fire risk 2/10 · Minimal
- Est. fire insurance / yr
- $888 – $1,650
Heat risk 2/10 · Minimal
- Hot days now (above 96°F)
- 7 days/yr
- Hot days in 30 yrs
- 12 days/yr
Wind risk 1/10 · Minimal
- Chance of severe wind over 30 yrs
- —
Air-quality risk 4/10 · Minor
- Unhealthy air days now
- 4 days/yr
- Unhealthy air days in 30 yrs
- 4 days/yr
Risk factors via First Street. Map © Google.
Why this score? — see what drove the B grade
The composite is a weighted blend of 9 inputs, each scored 0–100. Each bar is that input's sub-score; the figure is the points it added to the 100-point composite (weight × sub-score).
- Cash flow +30.0/30.0
- 1% rule +10.0/10.0
- DSCR +10.0/10.0
- ARV discount +7.5/15.0
- Schools +4.0/10.0
- Livability +3.8/5.0
- Rent growth +2.5/5.0
- Condition / age +2.5/5.0
- Appreciation +0.0/10.0
$69,900
🖨 Deal sheet 📄 Offer letter ✓ Due diligence
Listing remarks
SOLD BEFORE PRINT!!! Rehab special!! 2 bed, 1 bath home ready for new owners to bring back to life and make it their own!
Key facts
- 7,000 sq ft lot
- Garage
- Built 1950
Property features AI
Finance
- Financial info: Annual tax amount of $864
Exterior
- Parking: Attached or detached garage with 1 parking space
- Utilities: Public water; Natural gas available
- Home design: Single-family residence; One story
- Construction: Vinyl siding; Other foundation
- Exterior features: Lot approximately 7,000 square feet (about 150 x 40)
Interior
- Bathrooms: 1 full bathroom
- Interior features: Full basement
Neighborhood map
What this means for you Summary
Snapshot
- This is a 2-bed/1.0-bath single-family listed at $70k.
Deal economics
- At list price, monthly cash flow is $389 ($5k/yr) — positive.
- The deal already cash-flows at list — no discount required.
- Meets the 1% rule at list price ($1k rent vs $70k).
- Cap rate 13.0% vs local median 3.1% in East Grand Forks — top-decile yield for the area; either an underpriced asset or a hidden risk that comps aren't pricing in. Stress-test before assuming the spread holds.
Location & tenants
- Location reads 76/100 on livability (#167 in MN, #3,598 nationally) — a middle-class / working-renter tenant base. Strengths: crime A+, housing A+, health & safety A+; Watch: amenities D, commute F.
- East Grand Forks Public School District (suburban): math 42% / reading 49% proficiency, ranked #168 of 301 in MN (top 56%) — families likely to look elsewhere, expect single-tenant / working-renter base with shorter leases.
- Zoned schools: East Grand Forks Senior High (math 27% / reading 52%, grade F, #246 of 471 statewide, top 59%, 541 students, 34% FRL).
- Market conditions: 57 active listings in the ZIP; 5 comparable units currently listed for rent nearby; rentals lingering (median 44d on market — plan ~5-8 weeks vacancy on turnover, expect pricing pressure); 100% of comp listings sitting > 30 days — soft ceiling on asking rent; solid renter incomes; 42 units permitted in Polk County in 2024 (0 in 5+ unit buildings).
- This rent is only 16% of the median local income ($83k/yr) — well below the 30% rent-burden line; pricing power to push rent on renewal without tenant pushback.
Forward outlook
- Local home prices are declining (-3.0%/yr); year-one equity from $483 of loan paydown is wiped out by about $2k of value loss. Plan a longer hold.
- Polk County population projected to shrink 7% by 2050 — rents likely to lag national; underwrite the cash flow, not the appreciation.
- At projected returns (-3.0% appreciation + 3.0% rent growth), your $20k cash investment doubles in ~6 years — after that, you're playing with house money.
Negotiation context
- Only 5 days on market — expect competitive offers; lowballing is unlikely to land.
- 2 sale attempts with the ask held roughly flat each time — persistent listings suggest the price (not the market) is what's stuck; bring a comps-based counter.
- Current owner paid $23k; list at $70k implies a 207% gain — meaningful room to come down on a strong offer.
Risks & watch-outs
- Watch-outs: built in 1950 — expect roof / HVAC / electrical / plumbing capex.
Questions for the listing agent
- Built in 1950 — when were the roof, HVAC, electrical panel, plumbing, and water heater last replaced?
- Is there a deadline driving the sale (1031 exchange, divorce, estate, relocation)? That informs how much negotiation room exists.
- Schools are B-rated — typically a magnet for longer-tenancy family renters. What's the average tenant stay here, and is there a school-zone premium baked into asking?
- What's the average days-on-market for RENTAL listings here right now (not sales)? A rising rental-DOM trend means longer vacancies and softer asking-rent achievability than the comps imply.
- What's the recent tenant-quality profile in this submarket — average credit score on applications, eviction rate, late-payment / NSF rate, and stable-employment percentage? A property-management company in the area should have these aggregated.
- How much new for-sale + rental construction is in the pipeline within 1–3 miles? Heavy new supply typically softens prices + rents 12–24 months out; constrained supply supports both.
Investment metrics
- 1% rule
- 1.55% ✓
- Cap rate
- 12.97%
- Cash-on-cash
- 23.84%
- DSCR
- 2.06
- GRM
- 5.4
CMA / ARV
No comps found within radius.
Projected returns pro-forma
-3.0% appreciation · 3.0% rent growth · sell at horizon
- IRR
- 17.0%
- Equity multiple
- 1.69×
- Total profit
- $13,446
- Equity at exit
- $10,422
- IRR
- 25.5%
- Equity multiple
- 3.23×
- Total profit
- $43,626
- Equity at exit
- $6,044
Cash invested: $19,572 (down + closing). Projections, not guarantees.
Landlord ↔ Tenant lean methodology
- Overall (STATE)
- 46 Balanced
- State Minnesota
- 46 Balanced · D+2
- County
- — inherits STATE
- City
- — inherits STATE
ZIP-level market 56721
- Active inventory
- 57
- Price-to-rent
- 5.4×
Monthly cashflow live
- Estimated rent
- $1,084 high interval (Pro) →
- Mortgage (P&I)
- −$367
- Tax from tax record
- −$72 /mo · $864/yr
- Insurance
- −$29
- HOA
- −$0
- Vacancy / Maint / Mgmt
- −$228
- Net cashflow
- $389
Break-even live
UW: 25.0% down · 7.5% · 30yr · 1.5% tax · 5.0% vac · 8.0% maint · 8.0% mgmt
Financing live
Cash to close
- Down payment
- $17,475
- Closing costs
- $2,097
- Reserves months
- —
- Total cash needed
- —
Loan-product check · same deal, 3 products live
Conventional
25% down · 7.5% · 30yr
- Down + closing
- —
- Monthly P&I
- —
- Monthly cashflow
- —
- DSCR
- —
- Eligible?
- —
Personal DTI + credit; lowest rate.
DSCR
20% down · 8.5% · 30yr
- Down + closing
- —
- Monthly P&I
- —
- Monthly cashflow
- —
- DSCR
- —
- Eligible?
- —
No personal income docs; deal must DSCR.
Hard money
10% down · 12.0% · 12mo
- Down + closing
- —
- Monthly P&I
- —
- Monthly cashflow
- —
- DSCR
- —
- Eligible?
- —
Short-term bridge; refi at stabilization.
Rent comps 5 comps
| Address | Beds | Baths | Sqft | Rent | $/sqft | DOM | Units | Dist |
|---|---|---|---|---|---|---|---|---|
| 33 S 3rd St Grand Forks, ND | 1.0 | 1.0 | 740 | $925 | $1.25 | 43d | 1 | 0.77mi |
| 95 4th Ave S Grand Forks, ND | 1.0 | 1.0 | 500 | $725 | $1.45 | 44d | 1 | 0.90mi |
| 214 N 4th St Grand Forks, ND | 3.0 | 1.0–2.0 | 974 | $1,897 | $1.95 | 43d | 1 | 0.96mi |
| 1720 5th Ave NE East Grand Forks, MN | 1.0 | 1.0 | 575 | $690 | $1.20 | 43d | 1 | 0.97mi |
| 318 17th St NW Unit 400-30 East Grand Forks, MN | 1.0 | 1.0 | 479 | $758 | $1.58 | 43d | 1 | 1.06mi |
Listing history 3 events
-
2026-05-21Active Under Contract
-
2026-05-21$69,900
-
1997-06-30soldstatus $22,800
ⓘ Source: listings_history table (triggers on properties + properties_extension) + one-shot
backfill from property_details.listing_events for pre-trigger history.
Tax reassessment forecast MN · Partial reset (capped growth)
- Current annual tax
- $864 · $72/mo
- Projected year-2 tax
- $864 · $72/mo
- Expected delta
- $0/yr ($0/mo · 0.0%)
ⓘ Screening estimate from a state-policy table — verify with the county assessor before closing.
Climate risk First Street
- Flood 1/10 Low 0% chance over 30 yrs
- Wildfire 2/10 Low
- Heat 2/10 Low 7 d/yr ≥96°F today · 12 d/yr by 30 yrs out
- Wind 1/10 Low
- Air quality 4/10 Moderate 4 unhealthy d/yr today · 4 by 30 yrs out
Nearby sold comps map
Loading sold comps map…
Walkable amenities ~0.75 mi
Loading nearby amenities…
Taxation est. · year 1
- Rental income
- $13,011
- − Mortgage interest
- −$3,915
- − Property taxes
- −$864
- − Insurance
- −$350
- − Repairs & maintenance
- −$1,041
- − Management
- −$1,041
- − Depreciation
- −$2,033
- Taxable income
- $3,766
- Est. tax owed @ 24.0%
- −$904
- After-tax cash flow
- $3,762/yr
For passive investors: Depreciation is non-cash, so a rental often shows a tax loss while cash-flowing — sheltering income. Rental losses are passive: they offset passive income freely, and up to $25,000/yr can offset ordinary (W-2) income if you actively participate and your MAGI is under $100k (phasing out to $0 by $150k); unused losses carry forward. On sale, claimed depreciation is recaptured at up to 25%, and gains may owe capital-gains tax (a 1031 exchange can defer both). Figures are a year-1 estimate at your 24.0% rate — not tax advice; consult a CPA.
Schools (NCES district)
- District
- East Grand Forks Public School District
- NCES district ID
- 2711130
- Math proficiency
- 42% ▼ -10.00%
- Reading proficiency
- 49% ▼ -5.00%
- Median HH income
- $55,956
- Composite
- 39.6/100
- National rank
- #3924
- State rank
- #168 of 301 in MN
Livability — East Grand Forks
- Score
- 76/100
- State rank
- #167
- US rank
- #3598
Category grades
Schools grade is shown separately in the Schools card above.
Census & demographics
- Census place
- East Grand Forks, MN
- County
- Polk County · 10,679 people
- City population
- 10,679
- Metro
- Grand Forks, ND-MN
- Population (ZIP)
- 10,679
- Household income
- $82,525
- Rent vs Own
- Severe rent burden
- 276.0
Population outlook (Polk County) Hauer SSP2
- Today (2025)
- 31,123 people
- By 2030
- 30,720 · -1.3%
- By 2040
- 29,806 · -4.2%
- By 2050
- 29,022 · -6.8%
- By 2075
- 27,972 · -10.1%
- By 2100
- 26,953 · -13.4%
Race, ethnicity, and origin ACS 2023
- Neighborhood character
- Predominantly White (82%)
- Race & ethnicity
- White 82% Two or more races 8% Hispanic / Latino 7% Black 4% Native American 1%
- Hispanic origin (detail)
- Mexican 5%
- Common ancestry
- Portuguese 31% Lithuanian 4% Romanian 4%
- Foreign-born
- 3% · Canada
- Languages at home
- 95% English-only · Spanish 2% Arabic 1%
Political lean MEDSL · Polk
- 2024 margin
- Solid R (+33.8) · D 32.3% · R 66.0% · Other 1.7%
- 2008→2024 swing
- -38.3pp toward R · 2008: 4.6pp · 2024: -33.8pp
- All cycles
- 2024: R+33.8 2020: R+28.4 2016: R+29.0 2012: R+5.8 2008: D+4.6
Not yet ingested
- Civics
- —
Market trends
- HPI YoY
- ▼ -120.89%
- Current HPI
- 176.3062
- Rent YoY
- —
- Metro
- Grand Forks, ND-MN
- State GDP YoY
- ▲ 2.41%
- F500 in state
- 34
Industry mix (Fortune 500 HQ in MN)
| Industry | F500 HQs | Revenue |
|---|---|---|
| Healthcare | 2 | $407B |
|
||
| Retail | 2 | $150B |
|
||
| Consumer Goods | 2 | $32B |
|
||
| Industrial Machinery | 2 | $6B |
|
||
| Agriculture | 1 | $40B |
|
||
| Healthcare / Medical Devices | 1 | $32B |
|
||
Price history
+206.6% since first listed3 events — show timeline
- 2026-05-21 Listed — GFAAR
- 2026-05-21 Listed $69,900 GFAAR
- 1997-06-30 Sold (Public Records) $22,800 Public Records
Property tax history
+5.2%/yrLatest (2026): $864 · +11.9% YoY. Source: county tax records.
Cash-flow waterfall
monthlySold comps — $/sqft
last 12 mo · ≤1 miLoading sold comps…