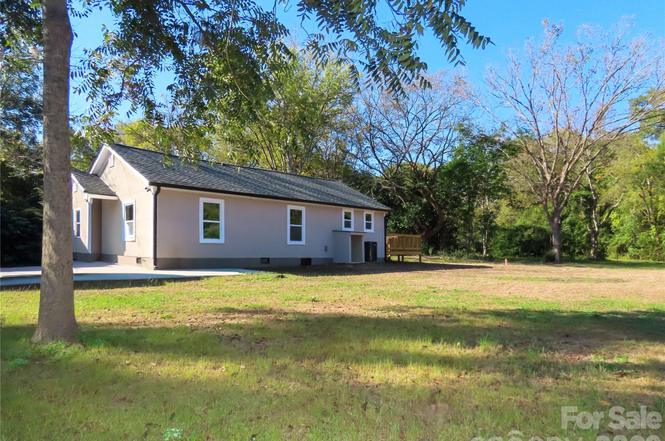
433 Clinton Ave · Lancaster, SC
Flood risk 1/10 · Minimal
- FEMA flood zone
- X (unshaded)
- Chance of flooding over 30 yrs
- 0.0%
- Est. flood insurance / yr
- $507 – $1,088
Fire risk 3/10 · Minor
- Est. fire insurance / yr
- $783 – $1,453
Heat risk 6/10 · Moderate
- Hot days now (above 106°F)
- 7 days/yr
- Hot days in 30 yrs
- 16 days/yr
Wind risk 6/10 · Moderate
- Chance of severe wind over 30 yrs
- 36.0%
Air-quality risk 2/10 · Minimal
- Unhealthy air days now
- 2 days/yr
- Unhealthy air days in 30 yrs
- 2 days/yr
Risk factors via First Street. Map © Google.
Why this score? — see what drove the F grade
The composite is a weighted blend of 9 inputs, each scored 0–100. Each bar is that input's sub-score; the figure is the points it added to the 100-point composite (weight × sub-score).
- Cash flow +13.2/30.0
- DSCR +4.0/10.0
- Schools +3.7/10.0
- Livability +2.8/5.0
- 1% rule +2.5/10.0
- Rent growth +2.5/5.0
- Condition / age +2.5/5.0
- ARV discount +0.1/15.0
- Appreciation +0.0/10.0
$185,000
🖨 Deal sheet 📄 Offer letter ✓ Due diligence
Listing remarks MLS
The home has the potential to be renovated into a beautiful starter home or investment property. Looking for a fixer-upper to flip, renovate and rent, or looking to renovate your own personal home? This could be an adorable home with the right vision. The home is waiting on your creativity. Please note, the room beyond the kitchen has a weak floor, so exercise caution when showing it. Also, there is a lot beside this home for sale separately the address is 435 Clinton Ave.
Key facts
- 4,700 sq ft lot
- Built 1955
- Listed 232 days
Property features AI
Finance
- Other: Property has additional parcels
- HOA & community: No HOA
Exterior
- Parking: Driveway
- Utilities: City water; Public sewer
- Home design: Single-family residential home; One story; Site-built construction
- Construction: Hard stucco exterior; Crawl space foundation
- Exterior features: Lot dimensions approximately 47 x 100; Road surfaces include dirt and paved; Publicly maintained road
Interior
- Bedrooms: Three bedrooms on the main level
- Bathrooms: Three full bathrooms (all on the main level)
- Heating & cooling: Central heating; Central air conditioning
- Interior features: Nine total rooms; Central heating; Central air; No built-in appliances listed
- Laundry & utility: Laundry located in a common area
Neighborhood map
What this means for you Summary
Snapshot
- This is a 3-bed/1.0-bath single-family listed at $185k.
Deal economics
- At list price, monthly cash flow is $-4 ($-43/yr) — negative.
- To cash-flow at today's rent, offer at most $184k (0.3% below list).
- To meet the 1% rule (rent ≥ 1% of price), the offer needs to be $138k (25.2% below list).
- Recommended offer: $138k (25.2% below list) — sets the bar for 1% rule.
- Cap rate 6.3% vs local median 3.0% in Lancaster — top-decile yield for the area; either an underpriced asset or a hidden risk that comps aren't pricing in. Stress-test before assuming the spread holds.
Location & tenants
- Location reads 55/100 on livability (#301 in SC) — a working-class tenant base; expect higher turnover. Strengths: cost of living A+, housing B+; Watch: schools C-, crime F, amenities F.
- Lancaster 01 (rural): math 41% / reading 47% proficiency, ranked #26 of 80 in SC (top 32%) — families likely to look elsewhere, expect single-tenant / working-renter base with shorter leases.
- Market conditions: 675 active listings in the ZIP; 5 comparable units currently listed for rent nearby; rentals leasing fast (median 2d on market — plan ~1-2 weeks tenant-placement turnaround); 976 units permitted in Lancaster County in 2024 (0 in 5+ unit buildings).
Forward outlook
- Local home prices are declining (-3.0%/yr); year-one equity from $1k of loan paydown is wiped out by about $6k of value loss. Plan a longer hold.
- Lancaster County population projected at +40% by 2050 — long-run rental-demand tailwind backs the buy-and-hold thesis.
Negotiation context
- It's been on market 232 days — a 12% lower offer ($163k) is reasonable based on typical stale-listing flexibility.
- 3 sale attempts; this cycle's ask has dropped $50k (21%) from the opening price — seller is motivated, your offer sets the floor, not the list.
- Current owner paid $45k; list at $185k implies a 311% gain — meaningful room to come down on a strong offer.
Risks & watch-outs
- Watch-outs: built in 1955 — expect roof / HVAC / electrical / plumbing capex.
- Climate carrying-cost: major wind risk, 36% chance of damaging wind over 30y; extreme-heat days projected 7→16/yr by 2055 (HVAC capex compounding) — expect insurance premiums to compound above CPI over the hold.
Questions for the listing agent
- What do current leases actually rent for vs. the listed asking? Can we see a recent rent roll and the last 12 months of T-12 income?
- It's been on market 232 days. Have you received any prior offers? Is the seller open to a 25% concession, seller financing, or rate buy-down credit?
- Built in 1955 — when were the roof, HVAC, electrical panel, plumbing, and water heater last replaced?
- Why hasn't it sold? Are there any deal-killer items the seller is aware of (foundation, flood, title, zoning, code violations)?
- Is there a deadline driving the sale (1031 exchange, divorce, estate, relocation)? That informs how much negotiation room exists.
- Crime grade is F in this area — have there been break-ins, vandalism, or insurance claims at this property in the last 3 years? What carrier currently insures it and at what premium?
- The area grade is low — what's the realistic commute time and amenity access for the typical tenant pool here? Any planned neighborhood developments (good or bad) we should know about?
- What's the average days-on-market for RENTAL listings here right now (not sales)? A rising rental-DOM trend means longer vacancies and softer asking-rent achievability than the comps imply.
- What's the recent tenant-quality profile in this submarket — average credit score on applications, eviction rate, late-payment / NSF rate, and stable-employment percentage? A property-management company in the area should have these aggregated.
- How much new for-sale + rental construction is in the pipeline within 1–3 miles? Heavy new supply typically softens prices + rents 12–24 months out; constrained supply supports both.
Investment metrics
- 1% rule
- 0.75% ✗
- Cap rate
- 6.27%
- Cash-on-cash
- -0.08%
- DSCR
- 1.00
- GRM
- 11.1
CMA / ARV
- ARV (on-the-fly)
- $158,946
- Comps found
- 7
Show comp detail 7 sales within ~0.75 mi
| Address | Dist | Beds/Ba | Sqft | Sold | Price | $/sf | Match |
|---|---|---|---|---|---|---|---|
| 408 Isom St | 0.08mi | 3/2.0 | 912 (+2%) | 22mo | $170,000 | $186 | 72 |
| 609 N Market St | 0.05mi | 3/1.0 | 1,025 (+14%) | 15mo | $112,900 | $110 | 62 |
| 428 Clinton Ave | 0.04mi | 2/1.0 (-1) | 780 (-13%) | 22mo | $145,000 | $186 | 53 |
| 304 N Market St | 0.27mi | 2/1.0 (-1) | 800 (-11%) | 18mo | $45,000 | $56 | 49 |
| 412 N French St | 0.50mi | 2/1.0 (-1) | 994 (+11%) | 7mo | $65,000 | $65 | 48 |
| 143 Pleasant Hill St | 0.31mi | 2/1.0 (-1) | 765 (-15%) | 18mo | $156,000 | $204 | 41 |
| 105 Witherspoon St | 0.44mi | 3/2.0 | 1,025 (+14%) | 19mo | $181,000 | $177 | 36 |
Match score weights: distance 35% · size 25% · config 20% · recency 20%. Top-matched comps best support the ARV.
Projected returns pro-forma
-3.0% appreciation · 3.0% rent growth · sell at horizon
- IRR
- -16.5%
- Equity multiple
- 0.42×
- Total profit
- $-30,300
- Equity at exit
- $27,584
- IRR
- -8.4%
- Equity multiple
- 0.48×
- Total profit
- $-27,052
- Equity at exit
- $15,995
Cash invested: $51,800 (down + closing). Projections, not guarantees.
Landlord ↔ Tenant lean methodology
- Overall (STATE)
- 90 Strongly Landlord-Friendly
- State South Carolina
- 90 Strongly Landlord-Friendly · R+6
- County
- — inherits STATE
- City
- — inherits STATE
ZIP-level market 29720
- Home prices YoY
- -28.2%
- Active inventory
- 675
- Price-to-rent
- 11.1×
Monthly cashflow live
- Estimated rent
- $1,383 high interval (Pro) →
- Mortgage (P&I)
- −$970
- Tax from tax record
- −$49 /mo · $588/yr
- Insurance
- −$77
- HOA
- −$0
- Vacancy / Maint / Mgmt
- −$290
- Net cashflow
- $-4
Break-even live
UW: 25.0% down · 7.5% · 30yr · 1.5% tax · 5.0% vac · 8.0% maint · 8.0% mgmt
Financing live
Cash to close
- Down payment
- $46,250
- Closing costs
- $5,550
- Reserves months
- —
- Total cash needed
- —
Loan-product check · same deal, 3 products live
Conventional
25% down · 7.5% · 30yr
- Down + closing
- —
- Monthly P&I
- —
- Monthly cashflow
- —
- DSCR
- —
- Eligible?
- —
Personal DTI + credit; lowest rate.
DSCR
20% down · 8.5% · 30yr
- Down + closing
- —
- Monthly P&I
- —
- Monthly cashflow
- —
- DSCR
- —
- Eligible?
- —
No personal income docs; deal must DSCR.
Hard money
10% down · 12.0% · 12mo
- Down + closing
- —
- Monthly P&I
- —
- Monthly cashflow
- —
- DSCR
- —
- Eligible?
- —
Short-term bridge; refi at stabilization.
Rent comps 5 comps
| Address | Beds | Baths | Sqft | Rent | $/sqft | DOM | Units | Dist |
|---|---|---|---|---|---|---|---|---|
| 205 S Catawba St Lancaster, SC | 2.0 | 1.0 | 950 | $1,350 | $1.42 | 1d | 1 | 0.68mi |
| 3038 Miller St Unit 3016-A Lancaster, SC | 2.0 | 2.0 | 915 | $1,363 | $1.49 | 17d | 1 | 1.15mi |
| 730 Taylor St Lancaster, SC | 2.0 | 1.0 | 868 | $985 | $1.13 | 1d | 1 | 1.23mi |
| 732 Taylor St Lancaster, SC | 2.0 | 1.0 | 868 | $985 | $1.13 | 1d | 1 | 1.24mi |
| 1305 Eula St Lancaster, SC | 2.0 | 1.0 | 900 | $945 | $1.05 | 23d | 1 | 1.36mi |
Listing history 24 events
-
2026-06-18days on market $185,000 Active 232 DOM
-
2026-06-17days on market $185,000 Active 231 DOM
-
2026-06-16days on market $185,000 Active 230 DOM
-
2026-06-15days on market $185,000 Active 229 DOM
-
2026-06-13days on market $185,000 Active 227 DOM
-
2026-06-09days on market $185,000 Active 223 DOM
-
2026-06-08days on market $185,000 Active 222 DOM
-
2026-06-07days on market $185,000 Active 221 DOM
-
2026-06-04days on market $185,000 Active 218 DOM
-
2026-06-03days on market $185,000 Active 217 DOM
-
2026-06-02days on market $185,000 Active 216 DOM
-
2026-06-01days on market $185,000 Active 215 DOM
-
2026-05-31days on market $185,000 Active 214 DOM
-
2026-05-22price $185,000
-
2026-04-07price $199,000
-
2025-10-29$235,000 Active
-
2025-10-29price $235,000
-
2025-10-22historical $225,000
-
2025-04-23soldstatus $45,000
-
2025-04-22soldstatus $45,000 Closed 482-char remark
Show marketing remark (482 chars)
The home has the potential to be renovated into a beautiful starter home or investment property. Looking for a fixer-upper to flip, renovate and rent, or looking to renovate your own personal home? This could be an adorable home with the right vision. The home is waiting on your creativity. Please note, the room beyond the kitchen has a weak floor, so exercise caution when showing it. Also, there is a lot beside this home for sale separately the address is 435 Clinton Ave.
-
2025-04-09status Pending
Show marketing remark (482 chars)
The home has the potential to be renovated into a beautiful starter home or investment property. Looking for a fixer-upper to flip, renovate and rent, or looking to renovate your own personal home? This could be an adorable home with the right vision. The home is waiting on your creativity. Please note, the room beyond the kitchen has a weak floor, so exercise caution when showing it. Also, there is a lot beside this home for sale separately the address is 435 Clinton Ave.
-
2025-04-09status Pending 482-char remark
Show marketing remark (482 chars)
The home has the potential to be renovated into a beautiful starter home or investment property. Looking for a fixer-upper to flip, renovate and rent, or looking to renovate your own personal home? This could be an adorable home with the right vision. The home is waiting on your creativity. Please note, the room beyond the kitchen has a weak floor, so exercise caution when showing it. Also, there is a lot beside this home for sale separately the address is 435 Clinton Ave.
-
2025-04-04$45,000 Active 482-char remark
Show marketing remark (482 chars)
The home has the potential to be renovated into a beautiful starter home or investment property. Looking for a fixer-upper to flip, renovate and rent, or looking to renovate your own personal home? This could be an adorable home with the right vision. The home is waiting on your creativity. Please note, the room beyond the kitchen has a weak floor, so exercise caution when showing it. Also, there is a lot beside this home for sale separately the address is 435 Clinton Ave.
-
2025-04-03$45,000 Active
ⓘ Source: listings_history table (triggers on properties + properties_extension) + one-shot
backfill from property_details.listing_events for pre-trigger history.
Tax reassessment forecast SC · Resets to sale price
- Current annual tax
- $588 · $49/mo
- Projected year-2 tax
- $1,054 · $88/mo
- Expected delta
- +$466/yr (+$39/mo · 79.3%)
ⓘ Screening estimate from a state-policy table — verify with the county assessor before closing.
Climate risk First Street
- Flood 1/10 Low FEMA zone X (unshaded) · 0% chance over 30 yrs
- Wildfire 3/10 Moderate
- Heat 6/10 Major 7 d/yr ≥106°F today · 16 d/yr by 30 yrs out
- Wind 6/10 Major 36% chance of damaging wind over 30 yrs
- Air quality 2/10 Low 2 unhealthy d/yr today · 2 by 30 yrs out
Nearby sold comps map
Loading sold comps map…
Walkable amenities ~0.75 mi
Loading nearby amenities…
Taxation est. · year 1
- Rental income
- $16,597
- − Mortgage interest
- −$10,363
- − Property taxes
- −$588
- − Insurance
- −$925
- − Repairs & maintenance
- −$1,328
- − Management
- −$1,328
- − Depreciation
- −$5,382
- Taxable loss
- −$3,316
- Est. tax savings @ 24.0%
- +$796
- After-tax cash flow
- $752/yr
For passive investors: Depreciation is non-cash, so a rental often shows a tax loss while cash-flowing — sheltering income. Rental losses are passive: they offset passive income freely, and up to $25,000/yr can offset ordinary (W-2) income if you actively participate and your MAGI is under $100k (phasing out to $0 by $150k); unused losses carry forward. On sale, claimed depreciation is recaptured at up to 25%, and gains may owe capital-gains tax (a 1031 exchange can defer both). Figures are a year-1 estimate at your 24.0% rate — not tax advice; consult a CPA.
Schools (NCES district)
- District
- Lancaster 01
- NCES district ID
- 4502580
- Math proficiency
- 41% ▼ -7.00%
- Reading proficiency
- 47% ▼ -1.00%
- Median HH income
- $44,165
- Composite
- 37.23/100
- National rank
- #4462
- State rank
- #26 of 80 in SC
Livability — Lancaster
- Score
- 55/100
- State rank
- #301
- US rank
- #23178
Category grades
Schools grade is shown separately in the Schools card above.
Census & demographics
- Census place
- Lancaster, SC
- County
- Lancaster County · 91,213 people
- City population
- 53,584
- Metro
- Charlotte-Concord-Gastonia, NC-SC
- Population (ZIP)
- 53,584
- Household income
- $62,969
- Rent vs Own
- Severe rent burden
- 1158.0
Population outlook (Lancaster County) Hauer SSP2
- Today (2025)
- 105,572 people
- By 2030
- 114,865 · +8.8%
- By 2040
- 132,268 · +25.3%
- By 2050
- 148,252 · +40.4%
- By 2075
- 182,540 · +72.9%
- By 2100
- 202,237 · +91.6%
Race, ethnicity, and origin ACS 2023
- Neighborhood character
- Majority White (62%)
- Race & ethnicity
- White 62% Black 26% Hispanic / Latino 8% Two or more races 5%
- Hispanic origin (detail)
- Mexican 4%
- Common ancestry
- Slovak 3% Serbian 2% Romanian 1%
- Foreign-born
- 6% · Canada
- Languages at home
- 91% English-only · Spanish 7% Other Indo-European 1%
Political lean MEDSL · Lancaster
- 2024 margin
- Strong R (+24.8) · D 37.0% · R 61.8% · Other 1.2%
- 2008→2024 swing
- -9.9pp toward R · 2008: -14.9pp · 2024: -24.8pp
- All cycles
- 2024: R+24.8 2020: R+22.8 2016: R+25.5 2012: R+18.0 2008: R+14.9
Not yet ingested
- Civics
- —
Market trends
- HPI YoY
- ▼ -95.90%
- Current HPI
- 244.328
- Rent YoY
- —
- Metro
- Charlotte-Concord-Gastonia, NC-SC
- State GDP YoY
- ▲ 4.51%
- F500 in state
- 2
Industry mix (Fortune 500 HQ in SC)
| Industry | F500 HQs | Revenue |
|---|---|---|
| Packaging | 1 | $7B |
|
||
Price history
+311.1% since first listed11 events — show timeline
- 2026-05-22 Price Changed $185,000 CANOPYMLS as Distributed by MLS Grid
- 2026-04-07 Price Changed $199,000 CANOPYMLS as Distributed by MLS Grid
- 2025-10-29 Listed $235,000 CANOPYMLS as Distributed by MLS Grid
- 2025-10-29 Price Changed $235,000 CANOPYMLS as Distributed by MLS Grid
- 2025-10-22 Coming Soon $225,000 CANOPYMLS as Distributed by MLS Grid
- 2025-04-23 Sold (Public Records) $45,000 Public Records
- 2025-04-22 Sold (MLS) $45,000 CANOPYMLS as Distributed by MLS Grid
- 2025-04-09 Pending — Consolidated MLS
- 2025-04-09 Pending — CANOPYMLS as Distributed by MLS Grid
- 2025-04-04 Listed $45,000 CANOPYMLS as Distributed by MLS Grid
- 2025-04-03 Listed $45,000 Consolidated MLS
Property tax history
+3.7%/yrLatest (2025): $588 · +12.9% YoY. Source: county tax records.
Cash-flow waterfall
monthlySold comps — $/sqft
last 12 mo · ≤1 miLoading sold comps…