100 Fairway Park Blvd #2102 · Palm Valley, FL
Flood risk 4/10 · Minor
- FEMA flood zone
- X (unshaded)
- Chance of flooding over 30 yrs
- 0.13%
- Est. flood insurance / yr
- $507 – $1,088
Fire risk 2/10 · Minimal
- Est. fire insurance / yr
- $947 – $1,759
Heat risk 10/10 · Severe
- Hot days now (above 103°F)
- 7 days/yr
- Hot days in 30 yrs
- 22 days/yr
Wind risk 10/10 · Severe
- Chance of severe wind over 30 yrs
- 99.0%
Air-quality risk 4/10 · Minor
- Unhealthy air days now
- 5 days/yr
- Unhealthy air days in 30 yrs
- 5 days/yr
Risk factors via First Street. Map © Google.
Why this score? — see what drove the D+ grade
The composite is a weighted blend of 9 inputs, each scored 0–100. Each bar is that input's sub-score; the figure is the points it added to the 100-point composite (weight × sub-score).
- Cash flow +12.9/30.0
- ARV discount +7.5/15.0
- 1% rule +6.9/10.0
- Schools +6.4/10.0
- Rent growth +4.3/5.0
- DSCR +3.9/10.0
- Livability +3.5/5.0
- Condition / age +2.5/5.0
- Appreciation +0.0/10.0
$195,000
🖨 Deal sheet 📄 Offer letter ✓ Due diligence
Listing remarks MLS
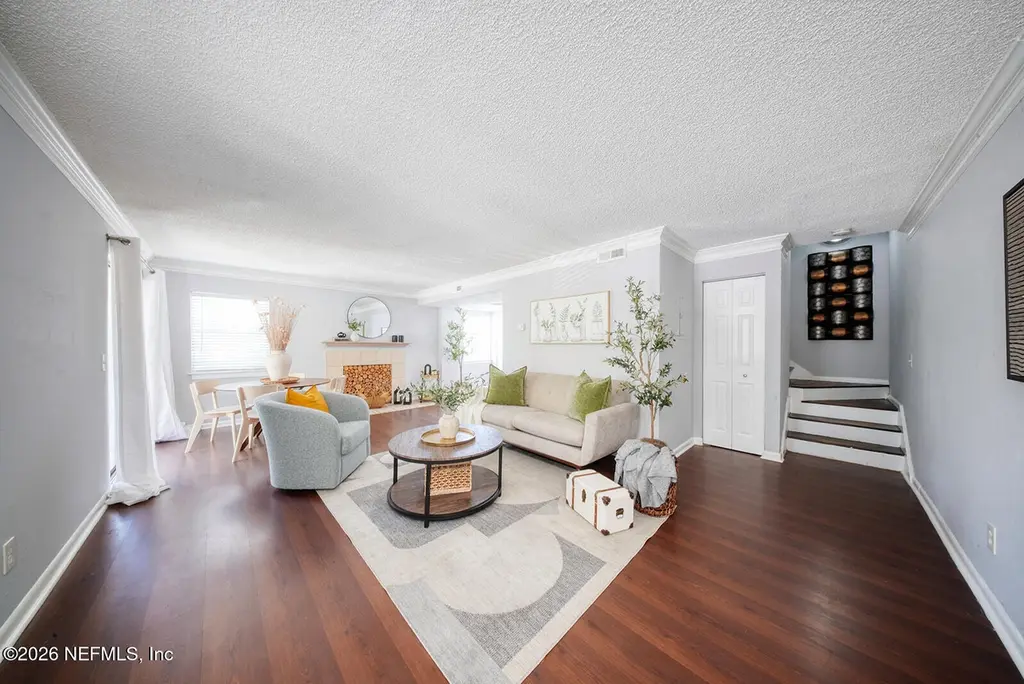
Welcome to Summer House! This 2/2 condo is located in beautiful Ponte Vedra Beach! Enjoy the many amenities this community has to offer, as well as excellent schools and convenience to local shops and restaurants. This home is also just a WALK TO THE BEACH! Life is good!
Key facts
- Fitness center
- Sparkling pools
- Private patio
Tags
Property features AI
Finance
- Other: Community pool (association) — not a private pool
- HOA & community: Has association; Monthly association fee; Association amenities include clubhouse, fitness center, full-time management, security, tennis courts, trash service; Association fee covers insurance, grounds maintenance, pest control, security, sewer, and water
Exterior
- Parking: Guest parking; On-street parking; Unassigned parking
- Security: Smoke detectors; Community security (association-provided)
- Utilities: Public sewer; Electricity connected; Sewer connected; Water connected
- Home design: Condominium; Two levels; Entry on level 2; Property is attached
- Construction: Frame construction with wood siding; Shingle roof; 2 stories
- Exterior features: Balcony; City street frontage; Asphalt road surface
Interior
- Kitchen: Dishwasher; Electric range; Microwave; Refrigerator
- Bedrooms: 2 bedrooms
- Flooring: Wood flooring
- Bathrooms: 2 full bathrooms
- Heating & cooling: Central heating (electric); Central air conditioning (electric)
- Interior features: Entrance foyer; Pantry; Primary bathroom with tub and shower
- Laundry & utility: In-unit washer and dryer
Neighborhood map
What this means for you Summary
Snapshot
- This is a 2-bed/2.0-bath condo listed at $195k.
Deal economics
- At list price, monthly cash flow is $-14 ($-168/yr) — negative.
- To cash-flow at today's rent, offer at most $193k (1.3% below list).
- Meets the 1% rule at list price ($2k rent vs $195k).
- Recommended offer: $193k (1.3% below list) — sets the bar for cash-flow.
- Cap rate 6.2% vs local median 2.3% in Palm Valley — top-decile yield for the area; either an underpriced asset or a hidden risk that comps aren't pricing in. Stress-test before assuming the spread holds.
Location & tenants
- Location reads 69/100 on livability (#462 in FL) — a middle-class / working-renter tenant base. Strengths: schools A+, crime A+, employment A+; Watch: amenities F, commute F, cost of living F.
- St. Johns (rural): math 75% / reading 73% proficiency, ranked #2 of 73 in FL (top 3%) — strong family-tenant draw, lease renewals of 3-5y typical; only 20% free/reduced lunch — higher-income household profile.
- Market conditions: Rents rising fast (+7.4%/yr); 333 active listings in the ZIP; 17 comparable units currently listed for rent nearby; rentals at typical pace (median 24d on market — plan ~3-4 weeks tenant-placement turnaround); high-income renter base; 5,575 units permitted in St. Johns County in 2024 (584 in 5+ unit buildings).
Forward outlook
- Local home prices are declining (-3.0%/yr); year-one equity from $1k of loan paydown is wiped out by about $6k of value loss. Plan a longer hold.
- St. Johns County population projected at +60% by 2050 — long-run rental-demand tailwind backs the buy-and-hold thesis.
Negotiation context
- Only 7 days on market — expect competitive offers; lowballing is unlikely to land.
- 4 sale attempts since 21y ago with the ask held roughly flat each time — persistent listings suggest the price (not the market) is what's stuck; bring a comps-based counter.
- Current owner paid $132k; 47% above their basis — modest negotiation headroom, anchor on the comps not their cost.
Risks & watch-outs
- Watch-outs: HOA is 24% of rent.
- Climate carrying-cost: severe wind risk, 99% chance of damaging wind over 30y; extreme-heat days projected 7→22/yr by 2055 (HVAC capex compounding) — expect insurance premiums to compound above CPI over the hold.
Questions for the listing agent
- What do current leases actually rent for vs. the listed asking? Can we see a recent rent roll and the last 12 months of T-12 income?
- What does the HOA fee cover, when was the last increase, and are there any pending special assessments or reserve-fund shortfalls?
- Any open or pending special assessments — roof, HVAC, plumbing, elevator, façade? What's the per-unit balance and payoff schedule, and is the seller paying it off at close or rolling it to the buyer?
- Is there a deadline driving the sale (1031 exchange, divorce, estate, relocation)? That informs how much negotiation room exists.
- Schools are A-rated — typically a magnet for longer-tenancy family renters. What's the average tenant stay here, and is there a school-zone premium baked into asking?
- The area grade is low — what's the realistic commute time and amenity access for the typical tenant pool here? Any planned neighborhood developments (good or bad) we should know about?
- What's the average days-on-market for RENTAL listings here right now (not sales)? A rising rental-DOM trend means longer vacancies and softer asking-rent achievability than the comps imply.
- What's the recent tenant-quality profile in this submarket — average credit score on applications, eviction rate, late-payment / NSF rate, and stable-employment percentage? A property-management company in the area should have these aggregated.
- How much new apartment / multifamily construction is in the pipeline within 1–3 miles? Heavy new supply (>2% of stock underway) typically softens rents 12–24 months out; light construction supports rent growth.
Investment metrics
- 1% rule
- 1.19% ✓
- Cap rate
- 6.21%
- Cash-on-cash
- -0.31%
- DSCR
- 0.99
- GRM
- 7.0
CMA / ARV
No comps found within radius.
Projected returns pro-forma
-3.0% appreciation · 7.39% rent growth · sell at horizon
- IRR
- -10.2%
- Equity multiple
- 0.61×
- Total profit
- $-21,455
- Equity at exit
- $29,075
- IRR
- 5.8%
- Equity multiple
- 1.54×
- Total profit
- $29,606
- Equity at exit
- $16,860
Cash invested: $54,600 (down + closing). Projections, not guarantees.
Landlord ↔ Tenant lean methodology
- Overall (STATE)
- 87 Strongly Landlord-Friendly
- State Florida
- 87 Strongly Landlord-Friendly · R+3
- County
- — inherits STATE
- City
- — inherits STATE
ZIP-level market 32082
- Rents YoY
- 7.4%
- Active inventory
- 333
- Price-to-rent
- 7.0×
Monthly cashflow live
- Estimated rent
- $2,319 high interval (Pro) →
- Mortgage (P&I)
- −$1,023
- Tax from tax record
- −$195 /mo · $2,338/yr
- Insurance
- −$81
- HOA
- −$547
- Vacancy / Maint / Mgmt
- −$487
- Net cashflow
- $-14
Break-even live
UW: 25.0% down · 7.5% · 30yr · 1.5% tax · 5.0% vac · 8.0% maint · 8.0% mgmt
Financing live
Cash to close
- Down payment
- $48,750
- Closing costs
- $5,850
- Reserves months
- —
- Total cash needed
- —
Loan-product check · same deal, 3 products live
Conventional
25% down · 7.5% · 30yr
- Down + closing
- —
- Monthly P&I
- —
- Monthly cashflow
- —
- DSCR
- —
- Eligible?
- —
Personal DTI + credit; lowest rate.
DSCR
20% down · 8.5% · 30yr
- Down + closing
- —
- Monthly P&I
- —
- Monthly cashflow
- —
- DSCR
- —
- Eligible?
- —
No personal income docs; deal must DSCR.
Hard money
10% down · 12.0% · 12mo
- Down + closing
- —
- Monthly P&I
- —
- Monthly cashflow
- —
- DSCR
- —
- Eligible?
- —
Short-term bridge; refi at stabilization.
Rent comps 17 comps
| Address | Beds | Baths | Sqft | Rent | $/sqft | DOM | Units | Dist |
|---|---|---|---|---|---|---|---|---|
| 100 Fairway Park Blvd Ponte Vedra Beach, FL | 1.0–2.0 | 1.0–2.0 | 750 | $1,700 | $2.27 | 14d | 3 | 0.09mi |
| 19 Arbor Club Dr Ponte Vedra Beach, FL | 2.0 | 2.0 | 1116 | $2,095 | $1.88 | 23d | 1 | 0.11mi |
| 5 Arbor Club Dr #103 Ponte Vedra Beach, FL | 2.0 | 2.0 | 1200 | $2,300 | $1.92 | 7d | 1 | 0.16mi |
| 11 Arbor Club Dr #214 Ponte Vedra Beach, FL | 2.0 | 2.0 | 1116 | $2,200 | $1.97 | 23d | 1 | 0.16mi |
| 908 Shoreline Cir Ponte Vedra Beach, FL | 2.0 | 2.0 | 1033 | $2,100 | $2.03 | 3d | 1 | 0.21mi |
| 46 Ponte Vedra Colony Cir Ponte Vedra Beach, FL | 2.0 | 2.0 | 1000 | $1,900 | $1.90 | 21d | 1 | 0.48mi |
| 71 Ponte Vedra Colony Cir Ponte Vedra Beach, FL | 2.0 | 2.0 | 950 | $3,200 | $3.37 | 23d | 1 | 0.48mi |
| 650 Ponte Vedra Blvd Unit E Ponte Vedra Beach, FL | 2.0 | 2.5 | 1406 | $3,995 | $2.84 | 23d | 1 | 0.75mi |
| 622 Ponte Vedra Blvd Unit D4 Ponte Vedra Beach, FL | 3.0 | 2.0 | 1440 | $4,500 | $3.12 | 23d | 1 | 0.78mi |
| 130 Veracruz Dr #722 Ponte Vedra Beach, FL | 2.0 | 2.0 | 991 | $2,000 | $2.02 | 23d | 1 | 0.79mi |
| 230 Colima Ct Ponte Vedra Beach, FL | 2.0 | 2.0 | 990 | $2,148 | $2.17 | 7d | 1 | 0.80mi |
| 657 Ponte Vedra Blvd Unit 657C Ponte Vedra Beach, FL | 2.0 | 2.0 | 1226 | $6,500 | $5.30 | 23d | 1 | 0.80mi |
| 160 Veracruz Dr Ponte Vedra Beach, FL | 2.0 | 2.0 | 1065 | $2,188 | $2.05 | 23d | 1 | 0.88mi |
| 562 Ponte Vedra Blvd Ponte Vedra Beach, FL | 3.0 | 1.5 | 1453 | $4,500 | $3.10 | 23d | 1 | 0.93mi |
| 43 Tifton Way N Ponte Vedra Beach, FL | 2.0 | 2.0 | 1415 | $3,950 | $2.79 | 23d | 1 | 1.09mi |
| 100 Ironwood Dr #133 Ponte Vedra Beach, FL | 2.0 | 2.0 | 1117 | $2,295 | $2.05 | 23d | 1 | 1.22mi |
| 743 Spinnakers Reach Dr Ponte Vedra Beach, FL | 1.0 | 1.0 | 700 | $4,500 | $6.43 | 23d | 1 | 1.45mi |
HOA detail condo
- Monthly dues
- $547 · $6,564/yr
- Assessments
- None detected in remarks — confirm with the listing agent.
Listing history 7 events
-
2026-06-18days on market $195,000 Active 7 DOM
-
2026-06-17days on market $195,000 Active 6 DOM
-
2026-06-16days on market $195,000 Active 5 DOM
-
2026-06-15days on market $195,000 Active 4 DOM
-
2026-06-13days on market $195,000 Active 2 DOM
-
2026-06-13remarks 699-char remark
-
2026-06-13$195,000 Active 1 DOM
ⓘ Source: listings_history table (triggers on properties + properties_extension) + one-shot
backfill from property_details.listing_events for pre-trigger history.
Tax reassessment forecast FL · Resets to sale price
- Current annual tax
- $2,338 · $195/mo
- Projected year-2 tax
- $2,338 · $195/mo
- Expected delta
- $0/yr ($0/mo · 0.0%)
ⓘ Screening estimate from a state-policy table — verify with the county assessor before closing.
Climate risk First Street
- Flood 4/10 Moderate FEMA zone X (unshaded) · 13% chance over 30 yrs
- Wildfire 2/10 Low
- Heat 10/10 Extreme 7 d/yr ≥103°F today · 22 d/yr by 30 yrs out
- Wind 10/10 Extreme 99% chance of damaging wind over 30 yrs
- Air quality 4/10 Moderate 5 unhealthy d/yr today · 5 by 30 yrs out
Nearby sold comps map
Loading sold comps map…
Walkable amenities ~0.75 mi
Loading nearby amenities…
Taxation est. · year 1
- Rental income
- $27,823
- − Mortgage interest
- −$10,923
- − Property taxes
- −$2,338
- − Insurance
- −$975
- − Repairs & maintenance
- −$2,226
- − Management
- −$2,226
- − HOA
- −$6,564
- − Depreciation
- −$5,673
- Taxable loss
- −$3,101
- Est. tax savings @ 24.0%
- +$744
- After-tax cash flow
- $576/yr
For passive investors: Depreciation is non-cash, so a rental often shows a tax loss while cash-flowing — sheltering income. Rental losses are passive: they offset passive income freely, and up to $25,000/yr can offset ordinary (W-2) income if you actively participate and your MAGI is under $100k (phasing out to $0 by $150k); unused losses carry forward. On sale, claimed depreciation is recaptured at up to 25%, and gains may owe capital-gains tax (a 1031 exchange can defer both). Figures are a year-1 estimate at your 24.0% rate — not tax advice; consult a CPA.
Schools (NCES district)
- District
- St. Johns
- NCES district ID
- 1201740
- Math proficiency
- 75% ▼ -5.00%
- Reading proficiency
- 73% ▼ -2.00%
- Median HH income
- $66,842
- Composite
- 64.31/100
- National rank
- #556
- State rank
- #2 of 73 in FL
Livability — Palm Valley
- Score
- 69/100
- State rank
- #462
- US rank
- #8349
Category grades
Schools grade is shown separately in the Schools card above.
Census & demographics
- Census place
- Palm Valley, FL
- County
- Saint Johns County · 301,599 people
- Metro
- Jacksonville, FL
- Population (ZIP)
- 29,289
- Household income
- $124,558
- Rent vs Own
- Severe rent burden
- 672.0
Population outlook (St. Johns County) Hauer SSP2
- Today (2025)
- 303,941 people
- By 2030
- 342,590 · +12.7%
- By 2040
- 417,328 · +37.3%
- By 2050
- 487,011 · +60.2%
- By 2075
- 635,395 · +109.1%
- By 2100
- 717,469 · +136.1%
Race, ethnicity, and origin ACS 2023
- Neighborhood character
- Predominantly White (87%)
- Race & ethnicity
- White 87% Two or more races 6% Hispanic / Latino 6% Asian 3% Black 1%
- Hispanic origin (detail)
- Puerto Rican 1% Cuban 1%
- Common ancestry
- Slovak 4% Romanian 3% Italian 3%
- Foreign-born
- 9% · Canada, China
- Languages at home
- 91% English-only · Spanish 3% Other Indo-European 2% Russian/Polish/Slavic 1%
Political lean MEDSL · St. Johns
- 2024 margin
- Solid R (+31.4) · D 33.9% · R 65.2%
- 2008→2024 swing
- +0.2pp no change · 2008: -31.6pp · 2024: -31.4pp
- All cycles
- 2024: R+31.4 2020: R+26.7 2016: R+33.4 2012: R+37.8 2008: R+31.6
Not yet ingested
- Civics
- —
Market trends
- HPI YoY
- ▼ -435.26%
- Current HPI
- 306.134
- Rent YoY
- ▲ 7.39%
- Metro
- Jacksonville, FL
- State GDP YoY
- ▲ 3.28%
- F500 in state
- 36
Industry mix (Fortune 500 HQ in FL)
| Industry | F500 HQs | Revenue |
|---|---|---|
| Industrial Technology | 2 | $29B |
|
||
| Insurance | 2 | $17B |
|
||
| Retail | 1 | $60B |
|
||
| Technology Distribution | 1 | $58B |
|
||
| Homebuilding | 1 | $35B |
|
||
| Technology Manufacturing | 1 | $35B |
|
||
Price history
-15.2% since first listed10 events — show timeline
- 2026-06-11 Listed $195,000 realMLS
- 2018-02-20 Sold (Public Records) $132,500 Public Records
- 2018-02-16 Sold (MLS) $132,500 realMLS
- 2018-02-01 Pending — realMLS
- 2018-01-26 Listed $138,000 realMLS
- 2010-08-30 Sold (MLS) $55,000 realMLS
- 2010-08-24 Listed $55,000 realMLS
- 2006-04-20 Listing Removed — realMLS
- 2006-03-14 Sold (MLS) $229,900 realMLS
- 2005-05-11 Listed $229,900 realMLS
Property tax history
+8.5%/yrLatest (2025): $2,338 · +7.7% YoY. Source: county tax records.
Cash-flow waterfall
monthlySold comps — $/sqft
last 12 mo · ≤1 miLoading sold comps…