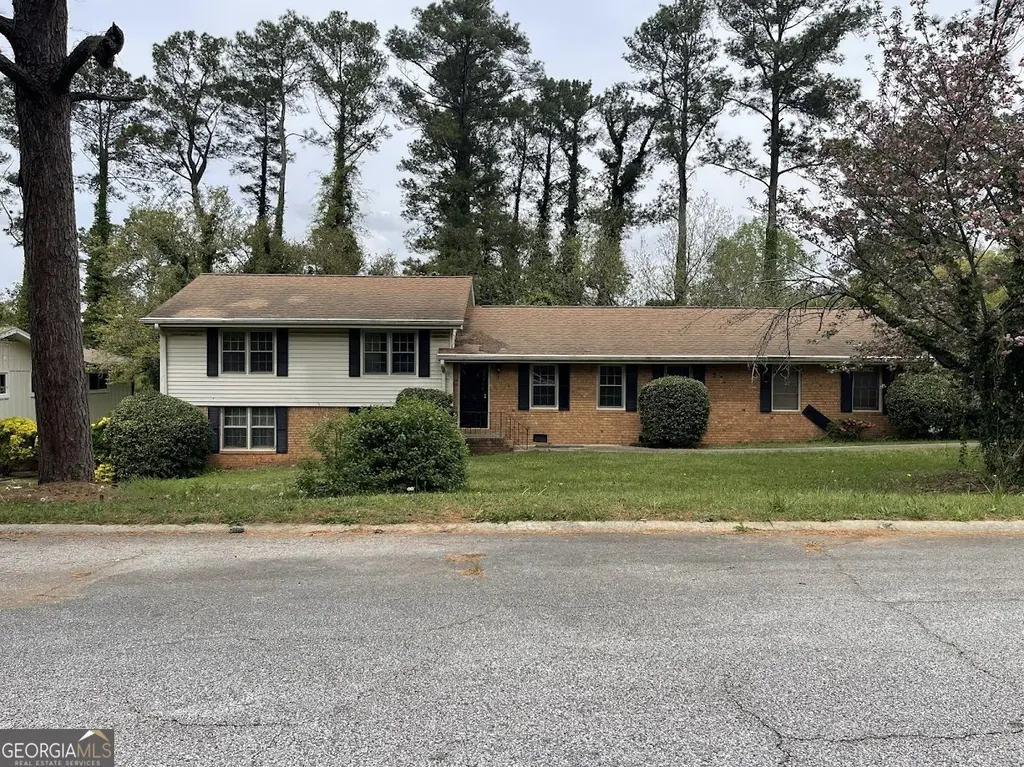
1621 Hebron Ln · Riverdale, GA
Flood risk 1/10 · Minimal
- FEMA flood zone
- X (unshaded)
- Chance of flooding over 30 yrs
- 0.0%
- Est. flood insurance / yr
- $507 – $1,088
Fire risk 3/10 · Minor
- Est. fire insurance / yr
- $963 – $1,789
Heat risk 5/10 · Moderate
- Hot days now (above 105°F)
- 7 days/yr
- Hot days in 30 yrs
- 18 days/yr
Wind risk 6/10 · Moderate
- Chance of severe wind over 30 yrs
- 27.0%
Air-quality risk 4/10 · Minor
- Unhealthy air days now
- 4 days/yr
- Unhealthy air days in 30 yrs
- 7 days/yr
Risk factors via First Street. Map © Google.
Why this score? — see what drove the C+ grade
The composite is a weighted blend of 9 inputs, each scored 0–100. Each bar is that input's sub-score; the figure is the points it added to the 100-point composite (weight × sub-score).
- Cash flow +22.6/30.0
- ARV discount +15.0/15.0
- DSCR +7.2/10.0
- 1% rule +5.9/10.0
- Livability +3.5/5.0
- Rent growth +3.4/5.0
- Condition / age +2.5/5.0
- Schools +1.3/10.0
- Appreciation +0.0/10.0
$189,000
🖨 Deal sheet (PDF) 📄 Offer letter ✓ Due diligence
Listing remarks
Unlock the Potential: Solid 4-Sided Brick Home in Riverdale! Calling all investors and sweat-equity enthusiasts! This 3-bedroom, 2-bathroom split-level gem at 1621 Hebron Lane is your next big opportunity in the heart of Riverdale. Boasting a classic 4-sided brick exterior with frame construction on the upper level, this home offers the kind of "good bones" and enduring quality that are increasingly hard to find. Additional Pics are coming! Inside, you'll discover beautiful hardwood floors throughout most of the home, just waiting to be polished to their original luster. While the kitchen and bathrooms are ready for a modern refresh, a simple deep clean and a fresh coat of paint
Key facts
- Spacious lot
- 4 sided brick home
- Hardwood floors
Tags
Neighborhood map
What this means for you Summary
Snapshot
- This is a 3-bed/2.0-bath single-family listed at $189k.
Deal economics
- At list price, monthly cash flow is $321 ($4k/yr) — positive.
- The deal already cash-flows at list — no discount required.
- Meets the 1% rule at list price ($2k rent vs $189k).
- Cap rate 8.3% vs local median 5.5% in Riverdale — top-decile yield for the area; either an underpriced asset or a hidden risk that comps aren't pricing in. Stress-test before assuming the spread holds.
Location & tenants
- Location reads 70/100 on livability (#100 in GA) — a middle-class / working-renter tenant base. Strengths: cost of living A+, housing A+; Watch: crime D, amenities F, commute F.
- Clayton County (suburban): math 11% / reading 20% proficiency, ranked #155 of 174 in GA (top 89%) — low school quality limits family demand, transient renter base, plan for 1-2y turnover; 78% free/reduced lunch — lower-income household profile, screen leases tightly.
- Zoned schools: Oliver Elementary School (math 12% / reading 27%, grade F, #878 of 1,228 statewide, top 75%, 539 students, 90% FRL); Riverdale Middle School (math 12% / reading 27%, grade F, #356 of 470 statewide, top 78%, 660 students, 90% FRL); North Clayton High School (math 2% / reading 22%, grade F, #336 of 424 statewide, top 80%, 1,206 students, 90% FRL).
- Market conditions: Rents rising (+3.5%/yr); 142 active listings in the ZIP; 40 comparable units currently listed for rent nearby; rentals at typical pace (median 25d on market — plan ~3-4 weeks tenant-placement turnaround); 42% of comp listings sitting > 30 days — soft ceiling on asking rent; 865 units permitted in Clayton County in 2024 (448 in 5+ unit buildings).
- This rent runs 39% of the median local income ($63k/yr) — at the standard rent-burdened threshold; future hikes will face affordability resistance.
Forward outlook
- Local home prices are declining (-3.0%/yr); year-one equity from $1k of loan paydown is wiped out by about $6k of value loss. Plan a longer hold.
- Clayton County population projected at +29% by 2050 — long-run rental-demand tailwind backs the buy-and-hold thesis.
Negotiation context
- Only 9 days on market — expect competitive offers; lowballing is unlikely to land.
- Current owner paid $93k; list at $189k implies a 103% gain — meaningful room to come down on a strong offer.
Risks & watch-outs
- Climate carrying-cost: major wind risk, 27% chance of damaging wind over 30y; extreme-heat days projected 7→18/yr by 2055 (HVAC capex compounding) — expect insurance premiums to compound above CPI over the hold.
Questions for the listing agent
- Built in 1967 — when were the roof, HVAC, electrical panel, plumbing, and water heater last replaced?
- Is there a deadline driving the sale (1031 exchange, divorce, estate, relocation)? That informs how much negotiation room exists.
- Schools are D-rated, which usually means shorter tenancies and higher turnover. Who's the typical renter profile here, and what's been the actual vacancy rate?
- Crime grade is D in this area — have there been break-ins, vandalism, or insurance claims at this property in the last 3 years? What carrier currently insures it and at what premium?
- What's the average days-on-market for RENTAL listings here right now (not sales)? A rising rental-DOM trend means longer vacancies and softer asking-rent achievability than the comps imply.
- What's the recent tenant-quality profile in this submarket — average credit score on applications, eviction rate, late-payment / NSF rate, and stable-employment percentage? A property-management company in the area should have these aggregated.
- How much new for-sale + rental construction is in the pipeline within 1–3 miles? Heavy new supply typically softens prices + rents 12–24 months out; constrained supply supports both.
Investment metrics
- 1% rule
- 1.09% ✓
- Cap rate
- 8.33%
- Cash-on-cash
- 7.27%
- DSCR
- 1.32
- GRM
- 7.6
CMA / ARV
- ARV (on-the-fly)
- $240,210
- Comps found
- 12
Show comp detail 12 sales within ~0.75 mi
| Address | Dist | Beds/Ba | Sqft | Sold | Price | $/sf | Match |
|---|---|---|---|---|---|---|---|
| 1621 Hebron Ln | 0.00mi | 3/2.0 | 1,570 (0%) | 1mo | $170,000 | $108 | 100 |
| 1396 Huntsmen Gln | 0.62mi | 3/2.0 | 1,584 (+1%) | 7mo | $287,000 | $181 | 64 |
| 6645 Collier Rd | 0.55mi | 4/2.0 (+1) | 1,560 (-1%) | 9mo | $289,900 | $186 | 61 |
| 7256 Attache Way | 0.62mi | 3/2.0 | 1,592 (+1%) | 10mo | $270,700 | $170 | 60 |
| 1729 Norden Rd | 0.38mi | 3/1.5 | 1,421 (-10%) | 9mo | $198,500 | $140 | 57 |
| 7038 Whitfield Dr | 0.75mi | 3/2.5 | 1,500 (-4%) | 0mo | $165,000 | $110 | 55 |
| 1625 Coronet Dr | 0.68mi | 3/2.0 | 1,666 (+6%) | 4mo | $95,000 | $57 | 55 |
| 7337 Czar Pl | 0.74mi | 3/2.0 | 1,461 (-7%) | 1mo | $211,000 | $144 | 53 |
| 1295 Brookvale Dr | 0.60mi | 3/2.0 | 1,716 (+9%) | 4mo | $285,000 | $166 | 53 |
| 7037 Shangrila Trl | 0.57mi | 4/2.0 (+1) | 1,718 (+9%) | 1mo | $195,000 | $114 | 52 |
| 6733 Walker Rd | 0.50mi | 4/2.5 (+1) | 1,350 (-14%) | 12mo | $250,000 | $185 | 36 |
| 1958 Bethsaida Rd | 0.71mi | 3/2.5 | 1,764 (+12%) | 10mo | $270,000 | $153 | 36 |
Match score weights: distance 35% · size 25% · config 20% · recency 20%. Top-matched comps best support the ARV.
Projected returns pro-forma
-3.0% appreciation · 3.55% rent growth · sell at horizon
- IRR
- -4.5%
- Equity multiple
- 0.83×
- Total profit
- $-9,015
- Equity at exit
- $28,181
- IRR
- 5.8%
- Equity multiple
- 1.44×
- Total profit
- $23,347
- Equity at exit
- $16,341
Cash invested: $52,920 (down + closing). Projections, not guarantees.
Landlord ↔ Tenant lean methodology
- Overall (STATE)
- 90 Strongly Landlord-Friendly
- State Georgia
- 90 Strongly Landlord-Friendly · R+3
- County
- — inherits STATE
- City
- — inherits STATE
ZIP-level market 30296
- Rents YoY
- 3.5%
- Active inventory
- 142
- Price-to-rent
- 7.6×
Monthly cashflow live
- Estimated rent
- $2,060 high interval (Pro) →
- Mortgage (P&I)
- −$991
- Tax from tax record
- −$237 /mo · $2,845/yr
- Insurance
- −$79
- HOA
- −$0
- Vacancy / Maint / Mgmt
- −$433
- Net cashflow
- $321
Break-even live
Sensitivity live
| Price | -10% $428 | -5% $374 | +0% $321 | +5% $267 | +10% $214 |
|---|---|---|---|---|---|
| Rent | -10% $158 | -5% $239 | +0% $321 | +5% $402 | +10% $484 |
| Rate | -1.0pp $416 | -0.5pp $369 | base $321 | +0.5pp $272 | +1.0pp $222 |
UW: 25.0% down · 7.5% · 30yr · 1.5% tax · 5.0% vac · 8.0% maint · 8.0% mgmt
Financing live
Cash to close
- Down payment
- $47,250
- Closing costs
- $5,670
- Reserves months
- —
- Total cash needed
- —
Loan-product check · same deal, 3 products live
Conventional
25% down · 7.5% · 30yr
- Down + closing
- —
- Monthly P&I
- —
- Monthly cashflow
- —
- DSCR
- —
- Eligible?
- —
Personal DTI + credit; lowest rate.
DSCR
20% down · 8.5% · 30yr
- Down + closing
- —
- Monthly P&I
- —
- Monthly cashflow
- —
- DSCR
- —
- Eligible?
- —
No personal income docs; deal must DSCR.
Hard money
10% down · 12.0% · 12mo
- Down + closing
- —
- Monthly P&I
- —
- Monthly cashflow
- —
- DSCR
- —
- Eligible?
- —
Short-term bridge; refi at stabilization.
Rent comps 40 comps
| Address | Beds | Baths | Sqft | Rent | $/sqft | DOM | Units | Dist |
|---|---|---|---|---|---|---|---|---|
| 1645 Hebron Ln Unit Top Floor Riverdale, GA | 3.0 | 2.0 | 1539 | $2,400 | $1.56 | 44d | 1 | 0.02mi |
| 7037 Dalmatia Dr Riverdale, GA | 4.0 | 3.0 | 1674 | $1,976 | $1.18 | 44d | 1 | 0.26mi |
| 7045 Eden Ct Riverdale, GA | 3.0 | 2.5 | 1976 | $2,100 | $1.06 | 44d | 1 | 0.32mi |
| 6798 Collier Way Riverdale, GA | 4.0 | 2.0 | 1900 | $1,900 | $1.00 | 25d | 1 | 0.40mi |
| 6704 Amesbury Ln Riverdale, GA | 3.0 | 2.0 | 1654 | $1,985 | $1.20 | 44d | 1 | 0.46mi |
| 6635 Autumn West Dr Riverdale, GA | 3.0 | 2.0 | 1728 | $1,840 | $1.06 | 25d | 1 | 0.69mi |
| 1357 Diplomat Dr Riverdale, GA | 4.0 | 2.5 | 2128 | $1,895 | $0.89 | 45d | 1 | 0.71mi |
| 1684 Regency Pl Riverdale, GA | 3.0 | 2.0 | 2175 | $2,035 | $0.94 | 6d | 1 | 0.75mi |
| 1041 Quail Hunt Dr Riverdale, GA | 3.0 | 2.5 | 2102 | $2,161 | $1.03 | 0d | 1 | 0.78mi |
| 7398 Embassy Trce Riverdale, GA | 4.0 | 2.5 | 2168 | $2,300 | $1.06 | 18d | 1 | 0.87mi |
| 6684 Judy Ln Riverdale, GA | 3.0 | 2.0 | 1356 | $1,705 | $1.26 | 44d | 1 | 0.92mi |
| 1118 Quail Hunt Dr Riverdale, GA | 4.0 | 2.5 | 2227 | $2,100 | $0.94 | 44d | 1 | 0.94mi |
| 6454 W Fayetteville Rd Riverdale, GA | 3.0 | 2.0 | 1204 | $1,950 | $1.62 | 21d | 1 | 0.97mi |
| 1161 Salisbury Trl Riverdale, GA | 3.0 | 2.0 | 1530 | $1,800 | $1.18 | 0d | 1 | 1.02mi |
| 7413 Penland Dr Riverdale, GA | 3.0 | 2.0 | 1422 | $2,100 | $1.48 | 44d | 1 | 1.03mi |
| 6616 Wellesley Dr Riverdale, GA | 4.0 | 3.0 | 1652 | $2,395 | $1.45 | 23d | 1 | 1.04mi |
| 7301 Fern Ct Riverdale, GA | 3.0 | 3.0 | 1325 | $1,909 | $1.44 | 5d | 1 | 1.07mi |
| 2003 Echota Way Riverdale, GA | 3.0 | 2.0 | 1449 | $1,750 | $1.21 | 44d | 1 | 1.12mi |
| 1471 Riverrock Trl Riverdale, GA | 3.0 | 2.5 | 1526 | $1,675 | $1.10 | 44d | 1 | 1.12mi |
| 7254 Fernwood Dr Riverdale, GA | 3.0 | 2.0 | 1272 | $1,765 | $1.39 | 25d | 1 | 1.15mi |
| 7324 Caribou Trl Riverdale, GA | 3.0 | 2.0 | 1312 | $1,631 | $1.24 | 44d | 1 | 1.17mi |
| 1070 Salisbury Trl Riverdale, GA | 3.0 | 2.0 | 1422 | $1,735 | $1.22 | 0d | 1 | 1.18mi |
| 7620 Creekside Ln Riverdale, GA | 4.0 | 2.5 | 1520 | $1,695 | $1.12 | 25d | 1 | 1.20mi |
| 7620 Creekside Ln Riverdale, GA | 4.0 | 2.5 | 1520 | $1,795 | $1.18 | 44d | 1 | 1.20mi |
| 1462 Riverrock Ct Riverdale, GA | 3.0 | 2.5 | 1620 | $1,715 | $1.06 | 0d | 1 | 1.20mi |
| 7683 Creekside Ln Riverdale, GA | 3.0 | 2.5 | 1904 | $1,800 | $0.95 | 0d | 1 | 1.27mi |
| 6989 Cedar Dr Riverdale, GA | 3.0 | 2.0 | 1536 | $1,680 | $1.09 | 3d | 1 | 1.28mi |
| 7495 Royale Ct Riverdale, GA | 4.0 | 3.0 | 1284 | $2,150 | $1.67 | 2d | 1 | 1.28mi |
| 6310 Thornhedge Dr Riverdale, GA | 4.0 | 2.0 | 1600 | $2,400 | $1.50 | 25d | 1 | 1.29mi |
| 839 River Glen Pl Riverdale, GA | 3.0 | 2.0 | 1414 | $1,870 | $1.32 | 6d | 1 | 1.30mi |
| 1857 Whitworth Dr Riverdale, GA | 4.0 | 3.0 | 1857 | $1,888 | $1.02 | 44d | 1 | 1.30mi |
| 7299 Indian Hill Trl Riverdale, GA | 4.0 | 2.5 | 1201 | $1,900 | $1.58 | 44d | 1 | 1.32mi |
| 7272 Indian Hill Trl Riverdale, GA | 3.0 | 2.0 | 1416 | $1,787 | $1.26 | 5d | 1 | 1.32mi |
| 1109 Mary Lee Ct Riverdale, GA | 3.0 | 2.5 | 1905 | $1,900 | $1.00 | 44d | 1 | 1.35mi |
| 1019 River Stone Ct Riverdale, GA | 3.0 | 2.0 | 1228 | $1,715 | $1.40 | 16d | 1 | 1.35mi |
| 6554 River Glen Dr Riverdale, GA | 3.0 | 2.5 | 1634 | $1,861 | $1.14 | 6d | 1 | 1.37mi |
| 2328 Creel Rd Atlanta, GA | 4.0 | 3.0 | 2100 | $1,895 | $0.90 | 44d | 1 | 1.39mi |
| 6215 Stimson Way Riverdale, GA | 3.0 | 2.0 | 1384 | $1,805 | $1.30 | 3d | 1 | 1.39mi |
| 1387 Cater Ln Riverdale, GA | 4.0 | 2.5 | 2136 | $2,095 | $0.98 | 6d | 1 | 1.40mi |
| 1290 Georgia 314 Unit 314 Fayetteville, GA | 3.0 | 2.0 | 2150 | $3,400 | $1.58 | 44d | 1 | 1.44mi |
Listing history 4 events
-
2026-04-24status Under Contract
-
2026-04-03$189,000 New
-
1993-11-09soldstatus $93,000
-
1977-06-27soldstatus $43,400
ⓘ Source: listings_history table (triggers on properties + properties_extension) + one-shot
backfill from property_details.listing_events for pre-trigger history.
Tax reassessment forecast GA · Resets to sale price
- Current annual tax
- $2,845 · $237/mo
- Projected year-2 tax
- $2,845 · $237/mo
- Expected delta
- $0/yr ($0/mo · 0.0%)
ⓘ Screening estimate from a state-policy table — verify with the county assessor before closing.
Climate risk First Street
- Flood 1/10 Low FEMA zone X (unshaded) · 0% chance over 30 yrs
- Wildfire 3/10 Moderate
- Heat 5/10 Major 7 d/yr ≥105°F today · 18 d/yr by 30 yrs out
- Wind 6/10 Major 27% chance of damaging wind over 30 yrs
- Air quality 4/10 Moderate 4 unhealthy d/yr today · 7 by 30 yrs out
Nearby sold comps map
Loading sold comps map…
Walkable amenities ~0.75 mi
Loading nearby amenities…
Taxation est. · year 1
- Rental income
- $24,725
- − Mortgage interest
- −$10,587
- − Property taxes
- −$2,845
- − Insurance
- −$945
- − Repairs & maintenance
- −$1,978
- − Management
- −$1,978
- − Depreciation
- −$5,498
- Taxable income
- $895
- Est. tax owed @ 24.0%
- −$215
- After-tax cash flow
- $3,635/yr
For passive investors: Depreciation is non-cash, so a rental often shows a tax loss while cash-flowing — sheltering income. Rental losses are passive: they offset passive income freely, and up to $25,000/yr can offset ordinary (W-2) income if you actively participate and your MAGI is under $100k (phasing out to $0 by $150k); unused losses carry forward. On sale, claimed depreciation is recaptured at up to 25%, and gains may owe capital-gains tax (a 1031 exchange can defer both). Figures are a year-1 estimate at your 24.0% rate — not tax advice; consult a CPA.
Schools (NCES district)
- District
- Clayton County
- NCES district ID
- 1301230
- Math proficiency
- 11% ▼ -13.00%
- Reading proficiency
- 20% ▼ -9.00%
- Median HH income
- $42,266
- Composite
- 13.41/100
- National rank
- #9527
- State rank
- #155 of 174 in GA
Livability — Riverdale
- Score
- 70/100
- State rank
- #100
- US rank
- #7907
Category grades
Schools grade is shown separately in the Schools card above.
Census & demographics
- County
- Clayton County · 230,153 people
- City population
- 61,126
- Metro
- Atlanta-Sandy Springs-Alpharetta, GA
- Population (ZIP)
- 27,045
- Household income
- $63,292
- Rent vs Own
- Severe rent burden
- 1400.0
Population outlook (Clayton County) Hauer SSP2
- Today (2025)
- 310,777 people
- By 2030
- 329,762 · +6.1%
- By 2040
- 368,052 · +18.4%
- By 2050
- 401,196 · +29.1%
- By 2075
- 472,488 · +52.0%
- By 2100
- 500,446 · +61.0%
Race, ethnicity, and origin ACS 2023
- Neighborhood character
- Predominantly Black (81%)
- Race & ethnicity
- Black 81% Hispanic / Latino 10% White 4% Asian 4% Two or more races 4%
- Hispanic origin (detail)
- Mexican 7%
- Common ancestry
- Hispanic 2%
- Foreign-born
- 14% · Canada, China, Vietnam
- Languages at home
- 80% English-only · Spanish 9% Chinese 3% French/Haitian/Cajun 2%
Political lean MEDSL · Clayton
- 2024 margin
- Solid D (+69.2) · D 84.3% · R 15.1%
- 2008→2024 swing
- +2.8pp toward D · 2008: 66.4pp · 2024: 69.2pp
- All cycles
- 2024: D+69.2 2020: D+70.9 2016: D+71.9 2012: D+70.1 2008: D+66.4
Not yet ingested
- Civics
- —
Market trends
- HPI YoY
- ▼ -137.25%
- Current HPI
- 209.7527
- Rent YoY
- ▲ 3.55%
- Metro
- Atlanta-Sandy Springs-Alpharetta, GA
- State GDP YoY
- ▲ 2.66%
- F500 in state
- 28
Industry mix (Fortune 500 HQ in GA)
| Industry | F500 HQs | Revenue |
|---|---|---|
| Paper / Packaging | 2 | $29B |
|
||
| Retail | 1 | $160B |
|
||
| Transportation / Logistics | 1 | $91B |
|
||
| Airlines | 1 | $62B |
|
||
| Consumer Goods | 1 | $47B |
|
||
| Utilities | 1 | $25B |
|
||
Price history
+335.5% since first listed4 events — show timeline
- 2026-04-24 Pending — GAMLS
- 2026-04-03 Listed $189,000 GAMLS
- 1993-11-09 Sold (Public Records) $93,000 Public Records
- 1977-06-27 Sold (Public Records) $43,400 Public Records
Property tax history
+6.8%/yrLatest (2025): $2,845 · -4.7% YoY. Source: county tax records.
Cash-flow waterfall
monthlySold comps — $/sqft
last 12 mo · ≤1 miLoading sold comps…