 🏗️ New Construction
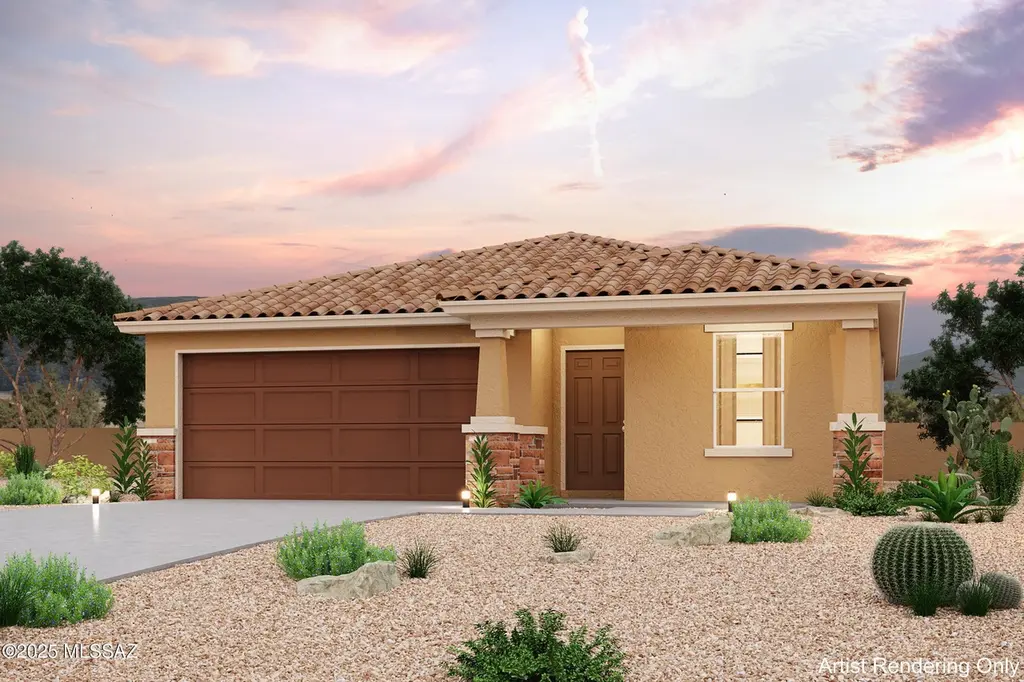
1185 Flowstone Trl · Benson, AZ
Flood risk 1/10 · Minimal
- FEMA flood zone
- X (unshaded)
- Chance of flooding over 30 yrs
- 0.0%
- Est. flood insurance / yr
- $507 – $1,088
Fire risk 8/10 · Major
- Est. fire insurance / yr
- $610 – $1,132
Heat risk 6/10 · Moderate
- Hot days now (above 99°F)
- 8 days/yr
- Hot days in 30 yrs
- 22 days/yr
Wind risk 1/10 · Minimal
- Chance of severe wind over 30 yrs
- —
Air-quality risk 1/10 · Minimal
- Unhealthy air days now
- 0 days/yr
- Unhealthy air days in 30 yrs
- 0 days/yr
Risk factors via First Street. Map © Google.
Why this score? — see what drove the D- grade
The composite is a weighted blend of 9 inputs, each scored 0–100. Each bar is that input's sub-score; the figure is the points it added to the 100-point composite (weight × sub-score).
- Cash flow +10.3/30.0
- ARV discount +7.5/15.0
- Condition / age +4.8/5.0
- Schools +3.6/10.0
- Livability +3.6/5.0
- 1% rule +3.3/10.0
- DSCR +2.9/10.0
- Rent growth +2.5/5.0
- Appreciation +0.0/10.0
$234,990
🖨 Deal sheet 📄 Offer letter ✓ Due diligence
Listing remarks
Step into your new home located in the highly sought-after The Canyons at Whestone Ranch. The Alamar Plan features a open-concept design, seamlessly connecting the Living, Dining, and Kitchen areas--perfect for relaxation and entertaining. Natural light fills the home through low-E insulated dual-pane windows, highlighting elegant Shaker cabinets, granite countertops, and stainless steel LG appliances. Retreat to the expansive primary suite with a private bath, dual vanity sinks, and a generous walk-in closet. This home also includes two additional well-appointed bedrooms. There also a covered patio. Make this beautiful home yours!
Key facts
- 9,148 sq ft lot
- 2 garage spots
- Built 2026
Property features AI
Finance
- Other: Lot dimensions approximately 49 x 121; Zoned Benson - R2
- HOA & community: Community association (AAM LLC); HOA fee $43 annually
Exterior
- Parking: Attached 2-car garage; 2 covered parking spaces
- Security: Smoke detector(s)
- Utilities: Public water; Sewer connected
- Home design: Single family residence; One story; New construction
- Construction: Frame with stucco exterior; Tile roof
- Exterior features: Decorative gravel; Front sprinklers; Subdivided lot; Paved roads; Paved street (community)
Interior
- Kitchen: Dishwasher; Electric range; Microwave
- Flooring: Carpet; Vinyl
- Bathrooms: 2 full bathrooms
- Heating & cooling: Electric heating; Central air conditioning
- Interior features: Walk-in closets; Double pane windows; Smoke detectors; Accessible entrance
- Laundry & utility: Electric dryer hookup
Neighborhood map
What this means for you Summary
Snapshot
- This is a 3-bed/2.0-bath single-family listed at $235k. Condition is rated excellent.
Deal economics
- At list price, monthly cash flow is $-135 ($-2k/yr) — negative.
- To cash-flow at today's rent, offer at most $224k (4.6% below list).
- To meet the 1% rule (rent ≥ 1% of price), the offer needs to be $202k (14.2% below list).
- Recommended offer: $202k (14.2% below list) — sets the bar for 1% rule.
- Cap rate 5.6% vs local median 4.5% in Benson — meaningfully above typical; check what's discounted (condition, days-on-market, listing class) to confirm the premium yield is real.
Location & tenants
- Location reads 71/100 on livability (#34 in AZ) — a middle-class / working-renter tenant base. Strengths: cost of living A+, housing A+, health & safety A; Watch: commute D, employment D, amenities F.
- St David Unified District (4173) (rural): math 40% / reading 40% proficiency, ranked #200 of 501 in AZ (top 40%) — families likely to look elsewhere, expect single-tenant / working-renter base with shorter leases.
- Market conditions: 263 active listings in the ZIP; 3 comparable units currently listed for rent nearby; rentals at typical pace (median 24d on market — plan ~3-4 weeks tenant-placement turnaround); 437 units permitted in Cochise County in 2024 (6 in 5+ unit buildings).
Forward outlook
- Local home prices are declining (-3.0%/yr); year-one equity from $2k of loan paydown is wiped out by about $7k of value loss. Plan a longer hold.
- Cochise County population projected at -30% by 2050 — secular population decline; favor cash flow + early exit over multi-decade hold.
Negotiation context
- It's been on market 48 days — a 3% lower offer ($228k) is reasonable based on typical stale-listing flexibility.
Risks & watch-outs
- Climate carrying-cost: severe wildfire risk; extreme-heat days projected 8→22/yr by 2055 (HVAC capex compounding) — expect insurance premiums to compound above CPI over the hold.
Questions for the listing agent
- What do current leases actually rent for vs. the listed asking? Can we see a recent rent roll and the last 12 months of T-12 income?
- It's been on market 48 days. Have you received any prior offers? Is the seller open to a 14% concession, seller financing, or rate buy-down credit?
- What does the HOA fee cover, when was the last increase, and are there any pending special assessments or reserve-fund shortfalls?
- Is there a deadline driving the sale (1031 exchange, divorce, estate, relocation)? That informs how much negotiation room exists.
- Schools are B-rated — typically a magnet for longer-tenancy family renters. What's the average tenant stay here, and is there a school-zone premium baked into asking?
- The area grade is low — what's the realistic commute time and amenity access for the typical tenant pool here? Any planned neighborhood developments (good or bad) we should know about?
- What's the average days-on-market for RENTAL listings here right now (not sales)? A rising rental-DOM trend means longer vacancies and softer asking-rent achievability than the comps imply.
- What's the recent tenant-quality profile in this submarket — average credit score on applications, eviction rate, late-payment / NSF rate, and stable-employment percentage? A property-management company in the area should have these aggregated.
- How much new for-sale + rental construction is in the pipeline within 1–3 miles? Heavy new supply typically softens prices + rents 12–24 months out; constrained supply supports both.
Investment metrics
- 1% rule
- 0.83% ✗
- Cap rate
- 5.63%
- Cash-on-cash
- -2.38%
- DSCR
- 0.89
- GRM
- 10.1
CMA / ARV
- ARV (on-the-fly)
- $243,810
- Comps found
- 12
Show comp detail 12 sales within ~0.75 mi
| Address | Dist | Beds/Ba | Sqft | Sold | Price | $/sf | Match |
|---|---|---|---|---|---|---|---|
| 1185 Flowstone Trl | 0.00mi | 3/2.0 | 1,290 (0%) | 1mo | $234,990 | $182 | 99 |
| 1256 Flowstone Trl | 0.11mi | 3/2.0 | 1,290 (0%) | 3mo | $251,000 | $195 | 93 |
| 1304 W Flowstone Trl | 0.20mi | 3/2.0 | 1,290 (0%) | 3mo | $249,990 | $194 | 88 |
| 1316 Flowstone Trl | 0.21mi | 3/2.0 | 1,290 (0%) | 3mo | $245,000 | $190 | 88 |
| 1320 W Flowstone Trl | 0.23mi | 3/2.0 | 1,290 (0%) | 4mo | $250,990 | $195 | 86 |
| 1295 W Kartchner Trl | 0.17mi | 3/2.0 | 1,290 (0%) | 9mo | $232,790 | $180 | 85 |
| 1333 W Kartchner Trl | 0.22mi | 3/2.0 | 1,290 (0%) | 9mo | $232,990 | $181 | 82 |
| 1351 W Kartchner Trl | 0.27mi | 3/2.0 | 1,290 (0%) | 11mo | $243,990 | $189 | 78 |
| 1361 W Kartchner Trl | 0.29mi | 3/2.0 | 1,290 (0%) | 11mo | $242,490 | $188 | 78 |
| 1405 W Kartchner Trl | 0.34mi | 3/2.0 | 1,290 (0%) | 11mo | $243,990 | $189 | 75 |
| 1455 W Big Room Pl | 0.47mi | 3/2.0 | 1,290 (0%) | 5mo | $244,990 | $190 | 74 |
| 1474 W Sheep Wash Way | 0.47mi | 3/2.0 | 1,290 (0%) | 10mo | $234,123 | $181 | 70 |
Match score weights: distance 35% · size 25% · config 20% · recency 20%. Top-matched comps best support the ARV.
Projected returns pro-forma
-3.0% appreciation · 3.0% rent growth · sell at horizon
- IRR
- -20.2%
- Equity multiple
- 0.30×
- Total profit
- $-48,063
- Equity at exit
- $36,353
- IRR
- -13.2%
- Equity multiple
- 0.23×
- Total profit
- $-52,711
- Equity at exit
- $21,080
Cash invested: $68,267 (down + closing). Projections, not guarantees.
Landlord ↔ Tenant lean methodology
- Overall (STATE)
- 87 Strongly Landlord-Friendly
- State Arizona
- 87 Strongly Landlord-Friendly · R+3
- County
- — inherits STATE
- City
- — inherits STATE
ZIP-level market 85602
- Home prices YoY
- -23.4%
- Active inventory
- 263
- Price-to-rent
- 9.7×
Monthly cashflow live
- Estimated rent
- $2,016 medium interval (Pro) →
- Mortgage (P&I)
- −$1,279
- Tax est. 1.5%
- −$305 /mo · $3,657/yr
- Insurance
- −$102
- HOA
- −$43
- Vacancy / Maint / Mgmt
- −$423
- Net cashflow
- $-135
Break-even live
UW: 25.0% down · 7.5% · 30yr · 1.5% tax · 5.0% vac · 8.0% maint · 8.0% mgmt
Financing live
Cash to close
- Down payment
- $60,952
- Closing costs
- $7,314
- Reserves months
- —
- Total cash needed
- —
Loan-product check · same deal, 3 products live
Conventional
25% down · 7.5% · 30yr
- Down + closing
- —
- Monthly P&I
- —
- Monthly cashflow
- —
- DSCR
- —
- Eligible?
- —
Personal DTI + credit; lowest rate.
DSCR
20% down · 8.5% · 30yr
- Down + closing
- —
- Monthly P&I
- —
- Monthly cashflow
- —
- DSCR
- —
- Eligible?
- —
No personal income docs; deal must DSCR.
Hard money
10% down · 12.0% · 12mo
- Down + closing
- —
- Monthly P&I
- —
- Monthly cashflow
- —
- DSCR
- —
- Eligible?
- —
Short-term bridge; refi at stabilization.
Rent comps 3 comps
| Address | Beds | Baths | Sqft | Rent | $/sqft | DOM | Units | Dist |
|---|---|---|---|---|---|---|---|---|
| 1299 W Flowstone Trl Benson, AZ | 4.0 | 2.0 | 1850 | $2,100 | $1.14 | 44d | 1 | 0.19mi |
| 1695 S Mystery Canyon Dr Benson, AZ | 3.0 | 2.0 | 1619 | $1,950 | $1.20 | 23d | 1 | 0.60mi |
| 1695 S Mystery Canyon Dr Benson, AZ | 3.0 | 2.0 | 1619 | $1,850 | $1.14 | 2d | 1 | 0.60mi |
HOA detail
- Monthly dues
- $43 · $516/yr
Listing history 6 events
-
2026-05-20status Pending
-
2026-04-27price $234,990
-
2026-04-24price $239,990
-
2026-04-20price $244,990
-
2026-04-06price $246,990
-
2026-04-02$249,990 Active
ⓘ Source: listings_history table (triggers on properties + properties_extension) + one-shot
backfill from property_details.listing_events for pre-trigger history.
Climate risk First Street
- Flood 1/10 Low FEMA zone X (unshaded) · 0% chance over 30 yrs
- Wildfire 8/10 Severe
- Heat 6/10 Major 8 d/yr ≥99°F today · 22 d/yr by 30 yrs out
- Wind 1/10 Low
- Air quality 1/10 Low 0 unhealthy d/yr today · 0 by 30 yrs out
Nearby sold comps map
Loading sold comps map…
Walkable amenities ~0.75 mi
Loading nearby amenities…
Taxation est. · year 1
- Rental income
- $24,193
- − Mortgage interest
- −$13,657
- − Property taxes
- −$3,657
- − Insurance
- −$1,219
- − Repairs & maintenance
- −$1,935
- − Management
- −$1,935
- − HOA
- −$516
- − Depreciation
- −$7,093
- Taxable loss
- −$5,820
- Est. tax savings @ 24.0%
- +$1,397
- After-tax cash flow
- $-226/yr
For passive investors: Depreciation is non-cash, so a rental often shows a tax loss while cash-flowing — sheltering income. Rental losses are passive: they offset passive income freely, and up to $25,000/yr can offset ordinary (W-2) income if you actively participate and your MAGI is under $100k (phasing out to $0 by $150k); unused losses carry forward. On sale, claimed depreciation is recaptured at up to 25%, and gains may owe capital-gains tax (a 1031 exchange can defer both). Figures are a year-1 estimate at your 24.0% rate — not tax advice; consult a CPA.
Condition & rehab AI · 3 photos
This home is in excellent condition with no visible repairs needed. It offers a great opportunity for an investor to enhance its curb appeal and value through minor updates.
Value-add opportunities
- Both Painting the exterior — Enhances curb appeal and resale value
- Both Landscaping the front yard — Improves curb appeal and rental value
- Both Upgrading the HVAC system — Improves comfort and energy efficiency
Renovation cost estimate screening
Value-add ROI direction
- Both Painting the exterior — Enhances curb appeal and resale value ↑
- Both Landscaping the front yard — Improves curb appeal and rental value ↑
- Both Upgrading the HVAC system — Improves comfort and energy efficiency ↑
ⓘ Cost ranges are severity-bucket heuristics (US national rule-of-thumb). Get contractor quotes + a written scope before underwriting a rehab budget.
Schools (NCES district)
- District
- St David Unified District (4173)
- NCES district ID
- 0408020
- Math proficiency
- 40% ▬ 0.00%
- Reading proficiency
- 40% ▬ 0.00%
- Median HH income
- $41,269
- Composite
- 36.09/100
- National rank
- #9494
- State rank
- #200 of 501 in AZ
Livability — Benson
- Score
- 71/100
- State rank
- #34
- US rank
- #6661
Category grades
Schools grade is shown separately in the Schools card above.
Census & demographics
- Census place
- Benson, AZ
- Population (ZIP)
- 9,860
Population outlook (Cochise County) Hauer SSP2
- Today (2025)
- 113,402 people
- By 2030
- 106,197 · -6.4%
- By 2040
- 92,166 · -18.7%
- By 2050
- 79,805 · -29.6%
- By 2075
- 56,831 · -49.9%
- By 2100
- 35,103 · -69.0%
Race, ethnicity, and origin ACS 2023
- Neighborhood character
- Predominantly White (78%)
- Race & ethnicity
- White 78% Hispanic / Latino 15% Two or more races 13%
- Hispanic origin (detail)
- Mexican 14%
- Common ancestry
- Portuguese 4% Slovak 3% Italian 2%
- Foreign-born
- 3% · Canada
- Languages at home
- 93% English-only · Spanish 5% German/W. Germanic 1%
Political lean MEDSL · Cochise
- 2024 margin
- Strong R (+23.1) · D 37.8% · R 61.0% · Other 1.2%
- 2008→2024 swing
- -2.5pp toward R · 2008: -20.7pp · 2024: -23.1pp
- All cycles
- 2024: R+23.1 2020: R+19.6 2016: R+22.6 2012: R+24.0 2008: R+20.7
Not yet ingested
- Civics
- —
Market trends
- HPI YoY
- ▼ -55.74%
- Current HPI
- 182.9079
- Rent YoY
- —
- Metro
- —
- State GDP YoY
- ▲ 4.54%
- F500 in state
- 20
Industry mix (Fortune 500 HQ in AZ)
| Industry | F500 HQs | Revenue |
|---|---|---|
| Technology | 2 | $13B |
|
||
| Mining / Metals | 1 | $23B |
|
||
| Environmental Services | 1 | $16B |
|
||
| Metals / Steel | 1 | $14B |
|
||
| Technology Distribution | 1 | $9B |
|
||
| Homebuilding | 1 | $8B |
|
||
Price history
-6.0% since first listed6 events — show timeline
- 2026-05-20 Pending — MLSSAZ
- 2026-04-27 Price Changed $234,990 MLSSAZ
- 2026-04-24 Price Changed $239,990 MLSSAZ
- 2026-04-20 Price Changed $244,990 MLSSAZ
- 2026-04-06 Price Changed $246,990 MLSSAZ
- 2026-04-02 Listed $249,990 MLSSAZ
Cash-flow waterfall
monthlySold comps — $/sqft
last 12 mo · ≤1 miLoading sold comps…