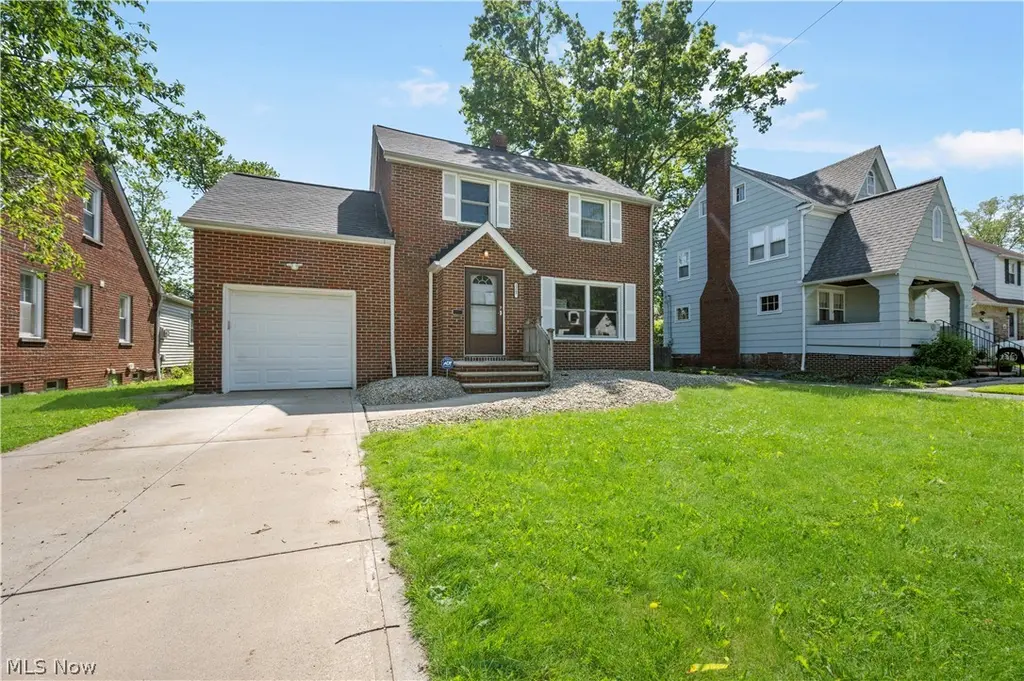
1523 Maywood Rd · South Euclid, OH
Flood risk 1/10 · Minimal
- FEMA flood zone
- X (unshaded)
- Chance of flooding over 30 yrs
- 0.0%
- Est. flood insurance / yr
- $473 – $860
Fire risk 1/10 · Minimal
- Est. fire insurance / yr
- $713 – $1,323
Heat risk 2/10 · Minimal
- Hot days now (above 96°F)
- 7 days/yr
- Hot days in 30 yrs
- 17 days/yr
Wind risk 1/10 · Minimal
- Chance of severe wind over 30 yrs
- —
Air-quality risk 3/10 · Minor
- Unhealthy air days now
- 2 days/yr
- Unhealthy air days in 30 yrs
- 5 days/yr
Risk factors via First Street. Map © Google.
Why this score? — see what drove the F grade
The composite is a weighted blend of 9 inputs, each scored 0–100. Each bar is that input's sub-score; the figure is the points it added to the 100-point composite (weight × sub-score).
- Cash flow +10.2/30.0
- Livability +4.4/5.0
- Rent growth +4.2/5.0
- 1% rule +3.9/10.0
- Schools +3.1/10.0
- DSCR +2.9/10.0
- Condition / age +2.5/5.0
- ARV discount +0.0/15.0
- Appreciation +0.0/10.0
$215,000
🖨 Deal sheet (PDF) 📄 Offer letter ✓ Due diligence
Listing remarks MLS
Meticulous and charming all brick South Euclid colonial on a wonderful street. Open concept living and dining room perfect for lounging or entertaining guests. Hardwood floors throughout. Light and bright updated kitchen with eat-in banquette area. 4 generously sized bedrooms all on the second level. Recently fully renovated 4th bedroom. Finished lower level with ample storage. Enjoy the outside with a private screened in porch opens to a lovely multi-level patio and deck space. Beautiful over-sized flat lot with loads of green space. 2 car attached tandem garage. Furnace and AC (2006). Newly painted throughout in today’s colors. Roof 2011. Water tank 2018. See listing agent with full list of improvements and low monthly utility costs.
Key facts
- Updated appliances
- Natural light
- Modern countertops
Tags
Property features AI
Exterior
- Parking: Attached garage with 1 garage space
- Utilities: Public water; Public sewer
- Home design: 2-story home; Above-grade finished area approximately 1,276; Below-grade finished area approximately 312
- Construction: Built (year source: Assessor); Asphalt/fiberglass roof
- Exterior features: Brick exterior
Interior
- Bedrooms: Total of 5 rooms (bedrooms included in room count)
- Bathrooms: 1 full bathroom; 1 half bathroom; Main level includes 1 bathroom
- Heating & cooling: Central air conditioning; Forced-air heating
- Interior features: Partially finished basement
Neighborhood map
What this means for you Summary
Snapshot
- This is a 3-bed/1.0-bath single-family listed at $215k.
Deal economics
- At list price, monthly cash flow is $-124 ($-1k/yr) — negative.
- To cash-flow at today's rent, offer at most $193k (10.2% below list).
- To meet the 1% rule (rent ≥ 1% of price), the offer needs to be $192k (10.6% below list).
- Recommended offer: $192k (10.6% below list) — sets the bar for 1% rule.
Location & tenants
- Location reads 88/100 on livability (#22 in OH, #207 nationally) — a professional / high-income tenant draw. Strengths: commute A+, cost of living A+, housing A+.
- South Euclid-Lyndhurst City (suburban): math 23% / reading 45% proficiency, ranked #556 of 656 in OH (top 85%) — families likely to look elsewhere, expect single-tenant / working-renter base with shorter leases.
- Market conditions: Rents rising fast (+6.8%/yr); 148 active listings in the ZIP; 26 comparable units currently listed for rent nearby; rentals at typical pace (median 17d on market — plan ~3-4 weeks tenant-placement turnaround); solid renter incomes; 1,441 units permitted in Cuyahoga County in 2024 (700 in 5+ unit buildings).
- This rent runs 30% of the median local income ($77k/yr) — at the standard rent-burdened threshold; future hikes will face affordability resistance.
Forward outlook
- Local home prices are declining (-3.0%/yr); year-one equity from $1k of loan paydown is wiped out by about $6k of value loss. Plan a longer hold.
- Cuyahoga County population projected to shrink 8% by 2050 — rents likely to lag national; underwrite the cash flow, not the appreciation.
Negotiation context
- Only 3 days on market — expect competitive offers; lowballing is unlikely to land.
- 4 sale attempts since 16y ago with the ask held roughly flat each time — persistent listings suggest the price (not the market) is what's stuck; bring a comps-based counter.
- Current owner paid $140k; list at $215k implies a 54% gain — meaningful room to come down on a strong offer.
Risks & watch-outs
- Watch-outs: built in 1952 — expect roof / HVAC / electrical / plumbing capex.
Questions for the listing agent
- What do current leases actually rent for vs. the listed asking? Can we see a recent rent roll and the last 12 months of T-12 income?
- Built in 1952 — when were the roof, HVAC, electrical panel, plumbing, and water heater last replaced?
- Is there a deadline driving the sale (1031 exchange, divorce, estate, relocation)? That informs how much negotiation room exists.
- Schools are B-rated — typically a magnet for longer-tenancy family renters. What's the average tenant stay here, and is there a school-zone premium baked into asking?
- The area grade is low — what's the realistic commute time and amenity access for the typical tenant pool here? Any planned neighborhood developments (good or bad) we should know about?
- What's the average days-on-market for RENTAL listings here right now (not sales)? A rising rental-DOM trend means longer vacancies and softer asking-rent achievability than the comps imply.
- What's the recent tenant-quality profile in this submarket — average credit score on applications, eviction rate, late-payment / NSF rate, and stable-employment percentage? A property-management company in the area should have these aggregated.
- How much new for-sale + rental construction is in the pipeline within 1–3 miles? Heavy new supply typically softens prices + rents 12–24 months out; constrained supply supports both.
Investment metrics
- 1% rule
- 0.89% ✗
- Cap rate
- 5.60%
- Cash-on-cash
- -2.46%
- DSCR
- 0.89
- GRM
- 9.3
CMA / ARV
- ARV (on-the-fly)
- $183,744
- Comps found
- 12
Show comp detail 12 sales within ~0.75 mi
| Address | Dist | Beds/Ba | Sqft | Sold | Price | $/sf | Match |
|---|---|---|---|---|---|---|---|
| 1567 S Belvoir Blvd | 0.51mi | 3/1.5 | 1,314 (+3%) | 1mo | $235,000 | $179 | 68 |
| 1343 Victory Dr | 0.46mi | 3/1.5 | 1,224 (-4%) | 4mo | $119,500 | $98 | 66 |
| 1834 Maywood Rd | 0.56mi | 3/1.5 | 1,270 (-0%) | 6mo | $172,500 | $136 | 66 |
| 4800 Farnhurst Rd | 0.52mi | 3/2.0 | 1,226 (-4%) | 7mo | $180,000 | $147 | 60 |
| 1762 Donwell Dr | 0.57mi | 3/2.0 | 1,332 (+4%) | 3mo | $180,000 | $135 | 59 |
| 4669 Liberty Rd | 0.58mi | 3/1.0 | 1,343 (+5%) | 7mo | $175,000 | $130 | 58 |
| 1827 Maywood Rd | 0.56mi | 3/1.5 | 1,176 (-8%) | 7mo | $218,900 | $186 | 53 |
| 4322 Tamalga Dr | 0.74mi | 2/1.5 (-1) | 1,236 (-3%) | 1mo | $190,000 | $154 | 52 |
| 4410 Lucille Ave | 0.73mi | 3/1.0 | 1,175 (-8%) | 1mo | $169,000 | $144 | 52 |
| 4406 Elmwood Rd | 0.68mi | 3/1.0 | 1,170 (-8%) | 8mo | $138,500 | $118 | 48 |
| 1400 Francis Ct | 0.58mi | 3/2.0 | 1,131 (-11%) | 6mo | $175,000 | $155 | 45 |
| 4241 Bexley Blvd | 0.71mi | 4/2.0 (+1) | 1,416 (+11%) | 1mo | $164,900 | $116 | 39 |
Match score weights: distance 35% · size 25% · config 20% · recency 20%. Top-matched comps best support the ARV.
Projected returns pro-forma
-3.0% appreciation · 6.85% rent growth · sell at horizon
- IRR
- -15.7%
- Equity multiple
- 0.42×
- Total profit
- $-34,851
- Equity at exit
- $32,057
- IRR
- -1.1%
- Equity multiple
- 0.91×
- Total profit
- $-5,624
- Equity at exit
- $18,589
Cash invested: $60,200 (down + closing). Projections, not guarantees.
Landlord ↔ Tenant lean methodology
- Overall (STATE)
- 73 Landlord-Friendly
- State Ohio
- 73 Landlord-Friendly · R+6
- County
- — inherits STATE
- City
- — inherits STATE
ZIP-level market 44121
- Rents YoY
- 6.8%
- Active inventory
- 148
- Price-to-rent
- 9.3×
Monthly cashflow live
- Estimated rent
- $1,922 high interval (Pro) →
- Mortgage (P&I)
- −$1,127
- Tax from tax record
- −$425 /mo · $5,095/yr
- Insurance
- −$90
- HOA
- −$0
- Vacancy / Maint / Mgmt
- −$404
- Net cashflow
- $-124
Break-even live
Sensitivity live
| Price | -10% $-2 | -5% $-63 | +0% $-124 | +5% $-184 | +10% $-245 |
|---|---|---|---|---|---|
| Rent | -10% $-275 | -5% $-199 | +0% $-124 | +5% $-48 | +10% $28 |
| Rate | -1.0pp $-15 | -0.5pp $-69 | base $-124 | +0.5pp $-179 | +1.0pp $-236 |
UW: 25.0% down · 7.5% · 30yr · 1.5% tax · 5.0% vac · 8.0% maint · 8.0% mgmt
Financing live
Cash to close
- Down payment
- $53,750
- Closing costs
- $6,450
- Reserves months
- —
- Total cash needed
- —
Loan-product check · same deal, 3 products live
Conventional
25% down · 7.5% · 30yr
- Down + closing
- —
- Monthly P&I
- —
- Monthly cashflow
- —
- DSCR
- —
- Eligible?
- —
Personal DTI + credit; lowest rate.
DSCR
20% down · 8.5% · 30yr
- Down + closing
- —
- Monthly P&I
- —
- Monthly cashflow
- —
- DSCR
- —
- Eligible?
- —
No personal income docs; deal must DSCR.
Hard money
10% down · 12.0% · 12mo
- Down + closing
- —
- Monthly P&I
- —
- Monthly cashflow
- —
- DSCR
- —
- Eligible?
- —
Short-term bridge; refi at stabilization.
Rent comps 26 comps
| Address | Beds | Baths | Sqft | Rent | $/sqft | DOM | Units | Dist |
|---|---|---|---|---|---|---|---|---|
| 1344 S Green Rd Cleveland, OH | 3.0 | 1.0 | 1076 | $1,150 | $1.07 | 17d | 1 | 0.45mi |
| 1405 Villa Dr Cleveland, OH | 4.0 | 1.5 | 1480 | $1,790 | $1.21 | 17d | 1 | 0.81mi |
| 1420 Villa Dr Cleveland, OH | 3.0 | 2.0 | 1600 | $1,550 | $0.97 | 44d | 1 | 0.83mi |
| 4241 Bayard Rd Cleveland, OH | 3.0 | 2.0 | 1350 | $1,995 | $1.48 | 24d | 1 | 0.84mi |
| 1599 Felton Rd Cleveland, OH | 3.0 | 1.5 | 1248 | $1,650 | $1.32 | 44d | 1 | 0.85mi |
| 4166 Ellison Rd Cleveland, OH | 3.0 | 2.0 | 1131 | $1,695 | $1.50 | 3d | 1 | 0.88mi |
| 1462 Felton Rd Cleveland, OH | 3.0 | 1.0 | 1222 | $1,500 | $1.23 | 17d | 1 | 0.89mi |
| 4165 Harwood Rd Cleveland, OH | 4.0 | 2.0 | 1608 | $1,950 | $1.21 | 44d | 1 | 0.89mi |
| 4409 Adrian Rd Cleveland, OH | 4.0 | 2.5 | 1542 | $1,855 | $1.20 | 2d | 1 | 0.93mi |
| 1478 Sherbrook Rd Cleveland, OH | 3.0 | 1.0 | 1170 | $1,195 | $1.02 | 44d | 1 | 1.02mi |
| 4994 N Sedgewick Rd Cleveland, OH | 3.0 | 1.5 | 1400 | $3,000 | $2.14 | 44d | 1 | 1.03mi |
| 1497 S Noble Rd Cleveland, OH | 4.0 | 1.0 | 1250 | $2,650 | $2.12 | 2d | 1 | 1.24mi |
| 4055 Verona Rd Unit 1496083P South Euclid, OH | 3.0 | 3.0 | 1065 | $5,069 | $4.76 | 15d | 1 | 1.26mi |
| 24111 Edgehill Dr Beachwood, OH | 4.0 | 2.5 | 1735 | $2,750 | $1.59 | 8d | 1 | 1.28mi |
| 4070 Wyncote Rd Cleveland, OH | 3.0 | 2.0 | 1233 | $1,749 | $1.42 | 3d | 1 | 1.31mi |
| 2231 S Green Rd Unit 2 Cleveland, OH | 2.0 | 1.0 | 1500 | $1,800 | $1.20 | 2d | 1 | 1.32mi |
| 2868 Noble Rd Cleveland, OH | 3.0 | 1.5 | 1200 | $1,250 | $1.04 | 24d | 1 | 1.32mi |
| 2868 Noble Rd Unit 16 Cleveland Heights, OH | 3.0 | 1.5 | 1200 | $1,750 | $1.46 | 2d | 1 | 1.33mi |
| 2200 Milton Rd University Heights, OH | 1.0–2.0 | 1.0–2.0 | 852 | $2,240 | $2.63 | 2d | 19 | 1.34mi |
| 24113 E Silsby Rd Beachwood, OH | 4.0 | 2.5 | 1650 | $2,700 | $1.64 | 2d | 1 | 1.40mi |
| 4470 Silsby Rd Cleveland, OH | 3.0 | 1.5 | 1654 | $2,400 | $1.45 | 2d | 1 | 1.44mi |
| 1270 Roland Rd Cleveland, OH | 4.0 | 2.0 | 1720 | $2,450 | $1.42 | 44d | 1 | 1.44mi |
| 1462 Parkhill Rd Cleveland, OH | 4.0 | 1.0 | 1451 | $1,950 | $1.34 | 2d | 1 | 1.46mi |
| 3917 Bluestone Rd Cleveland, OH | 4.0 | 1.5 | 1700 | $1,650 | $0.97 | 22d | 1 | 1.48mi |
| 4350 Silsby Rd Cleveland, OH | 3.0 | 2.5 | 1366 | $2,600 | $1.90 | 2d | 1 | 1.49mi |
| 4023 Okalona Rd Cleveland, OH | 3.0 | 1.5 | 1400 | $2,500 | $1.79 | 45d | 1 | 1.49mi |
Listing history 5 events
-
2026-06-03status $215,000 Pending 3 DOM
-
2026-06-02days on market $215,000 Active 3 DOM
-
2026-06-01days on market $215,000 Active 2 DOM
-
2026-05-31remarks 664-char remark
-
2026-05-31$215,000 Active 1 DOM
ⓘ Source: listings_history table (triggers on properties + properties_extension) + one-shot
backfill from property_details.listing_events for pre-trigger history.
Tax reassessment forecast OH · Partial reset (capped growth)
- Current annual tax
- $5,095 · $425/mo
- Projected year-2 tax
- $5,095 · $425/mo
- Expected delta
- $0/yr ($0/mo · 0.0%)
ⓘ Screening estimate from a state-policy table — verify with the county assessor before closing.
Climate risk First Street
- Flood 1/10 Low FEMA zone X (unshaded) · 0% chance over 30 yrs
- Wildfire 1/10 Low
- Heat 2/10 Low 7 d/yr ≥96°F today · 17 d/yr by 30 yrs out
- Wind 1/10 Low
- Air quality 3/10 Moderate 2 unhealthy d/yr today · 5 by 30 yrs out
Nearby sold comps map
Loading sold comps map…
Walkable amenities ~0.75 mi
Loading nearby amenities…
Taxation est. · year 1
- Rental income
- $23,060
- − Mortgage interest
- −$12,043
- − Property taxes
- −$5,095
- − Insurance
- −$1,075
- − Repairs & maintenance
- −$1,845
- − Management
- −$1,845
- − Depreciation
- −$6,255
- Taxable loss
- −$5,098
- Est. tax savings @ 24.0%
- +$1,223
- After-tax cash flow
- $-259/yr
For passive investors: Depreciation is non-cash, so a rental often shows a tax loss while cash-flowing — sheltering income. Rental losses are passive: they offset passive income freely, and up to $25,000/yr can offset ordinary (W-2) income if you actively participate and your MAGI is under $100k (phasing out to $0 by $150k); unused losses carry forward. On sale, claimed depreciation is recaptured at up to 25%, and gains may owe capital-gains tax (a 1031 exchange can defer both). Figures are a year-1 estimate at your 24.0% rate — not tax advice; consult a CPA.
Schools (NCES district)
- District
- South Euclid-Lyndhurst City
- NCES district ID
- 3904479
- Math proficiency
- 23% ▼ -22.00%
- Reading proficiency
- 45% ▼ -11.00%
- Median HH income
- $61,244
- Composite
- 30.51/100
- National rank
- #6212
- State rank
- #556 of 656 in OH
Livability — South Euclid
- Score
- 88/100
- State rank
- #22
- US rank
- #207
Category grades
Schools grade is shown separately in the Schools card above.
Census & demographics
- Census place
- South Euclid, OH
- County
- Cuyahoga County · 1,090,369 people
- City population
- 32,668
- Metro
- Cleveland-Elyria, OH
- Population (ZIP)
- 32,312
- Household income
- $76,767
- Rent vs Own
- Severe rent burden
- 672.0
Population outlook (Cuyahoga County) Hauer SSP2
- Today (2025)
- 1,244,621 people
- By 2030
- 1,230,093 · -1.2%
- By 2040
- 1,189,108 · -4.5%
- By 2050
- 1,145,706 · -7.9%
- By 2075
- 1,076,557 · -13.5%
- By 2100
- 978,987 · -21.3%
Race, ethnicity, and origin ACS 2023
- Neighborhood character
- Diverse neighborhood (Simpson 0.56)
- Race & ethnicity
- Black 55% White 36% Two or more races 4% Hispanic / Latino 3% Asian 2%
- Common ancestry
- Romanian 3% Italian 2% Scotch-Irish 2%
- Foreign-born
- 5% · Canada, China, India
- Languages at home
- 92% English-only · Spanish 2% Chinese 1% Other Indo-European 1%
Political lean MEDSL · Cuyahoga
- 2024 margin
- Solid D (+31.5) · D 65.4% · R 33.9%
- 2008→2024 swing
- -7.4pp toward R · 2008: 38.9pp · 2024: 31.5pp
- All cycles
- 2024: D+31.5 2020: D+34.1 2016: D+35.0 2012: D+38.7 2008: D+38.9
Not yet ingested
- Civics
- —
Market trends
- HPI YoY
- ▼ -180.15%
- Current HPI
- 173.7405
- Rent YoY
- ▲ 6.85%
- Metro
- Cleveland-Elyria, OH
- State GDP YoY
- ▲ 1.98%
- F500 in state
- 48
Industry mix (Fortune 500 HQ in OH)
| Industry | F500 HQs | Revenue |
|---|---|---|
| Insurance | 3 | $145B |
|
||
| Industrial Machinery | 3 | $49B |
|
||
| Financial Services | 3 | $24B |
|
||
| Consumer Goods | 2 | $93B |
|
||
| Aerospace / Defense | 2 | $47B |
|
||
| Utilities | 2 | $33B |
|
||
Price history
+126.3% since first listed12 events — show timeline
- 2026-05-30 Listed $215,000 MLSNOW
- 2019-07-02 Listing Removed — MLSNOW
- 2019-07-01 Sold (Public Records) $140,000 Public Records
- 2019-07-01 Sold (MLS) $140,000 MLSNOW
- 2019-05-23 Contingent — MLSNOW
- 2019-04-22 Listed $150,000 MLSNOW
- 2011-08-30 Listing Removed — MLSNOW
- 2011-08-29 Sold (Public Records) $119,000 Public Records
- 2011-04-29 Listed $124,900 MLSNOW
- 2011-02-25 Listing Removed — MLSNOW
- 2010-08-25 Listed $139,900 MLSNOW
- 1996-04-12 Sold (Public Records) $95,000 Public Records
Property tax history
+2.8%/yrLatest (2025): $5,095 · +10.2% YoY. Source: county tax records.
Cash-flow waterfall
monthlySold comps — $/sqft
last 12 mo · ≤1 miLoading sold comps…