 🏗️ New Construction
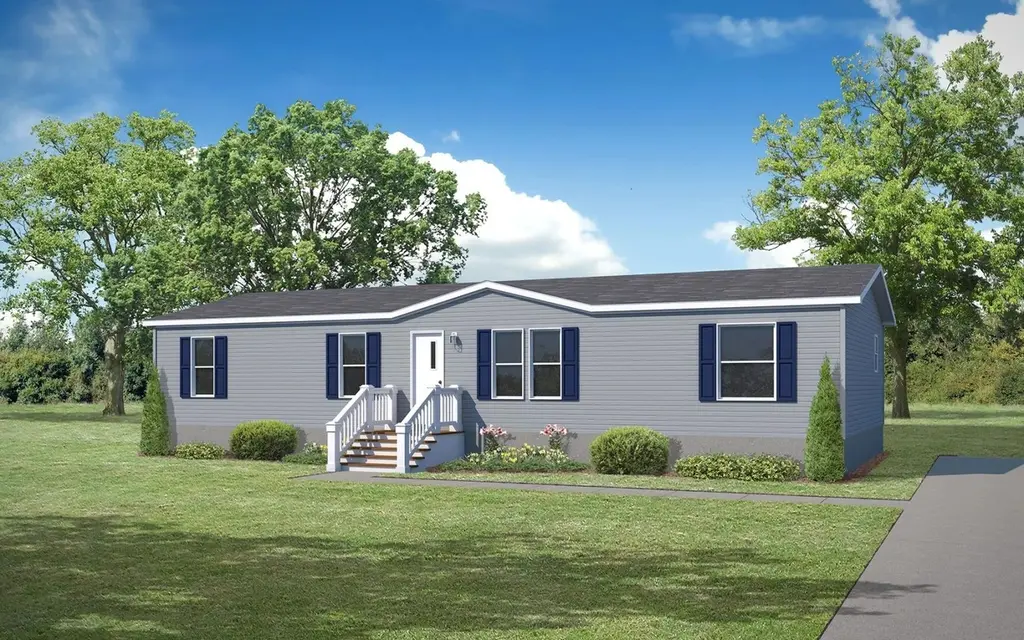
Crown (Dry Fork) Plan · Hooven, OH
Flood risk 2/10 · Minimal
- FEMA flood zone
- X (unshaded)
- Chance of flooding over 30 yrs
- 0.06%
- Est. flood insurance / yr
- $473 – $860
Fire risk 1/10 · Minimal
- Est. fire insurance / yr
- $713 – $1,323
Heat risk 4/10 · Minor
- Hot days now (above 104°F)
- 7 days/yr
- Hot days in 30 yrs
- 19 days/yr
Wind risk 2/10 · Minimal
- Chance of severe wind over 30 yrs
- 1.0%
Air-quality risk 4/10 · Minor
- Unhealthy air days now
- 3 days/yr
- Unhealthy air days in 30 yrs
- 5 days/yr
Risk factors via First Street. Map © Google.
Why this score? — see what drove the B- grade
The composite is a weighted blend of 9 inputs, each scored 0–100. Each bar is that input's sub-score; the figure is the points it added to the 100-point composite (weight × sub-score).
- Cash flow +28.4/30.0
- 1% rule +10.0/10.0
- DSCR +10.0/10.0
- ARV discount +7.5/15.0
- Schools +5.5/10.0
- Condition / age +4.0/5.0
- Rent growth +2.5/5.0
- Livability +2.1/5.0
- Appreciation +0.0/10.0
$92,995
🖨 Deal sheet 📄 Offer letter ✓ Due diligence
Listing remarks MLS
Located in a quiet, rural setting, just three minutes from I-275 in southwestern Ohio near the Great Miami River, Dry Fork Pointe is a mobile home community that is near the Ohio and the I-74 Indiana border, close to recreational parks and golfing areas. New amenities include a clubhouse, playground, basketball court and a ball field and Walking/Nature Trails. Whitewater Township in Hamilton County, Ohio, offers a small-town feel with close proximity to Cincinnati. Neighborhoods include grocery and other retails stores, community center, social services as well as churches.
Key facts
- Clubhouse
- Recreational parks
- Basketball court
Tags
Neighborhood map
What this means for you Summary
Snapshot
- This is a 4-bed/2.0-bath single-family listed at $93k. Condition is rated good.
Deal economics
- At list price, monthly cash flow is $300 ($4k/yr) — positive.
- The deal already cash-flows at list — no discount required.
- Meets the 1% rule at list price ($2k rent vs $93k).
- Recommended offer: $82k (12.0% below list) — sets the bar for market timing.
Location & tenants
- Location reads 42/100 on livability (#1,194 in OH) — a working-class tenant base; expect higher turnover. Strengths: cost of living A+, crime A; Watch: schools F, amenities F, commute F.
- Southwest Local (town): math 62% / reading 65% proficiency, ranked #222 of 656 in OH (top 34%) — acceptable for families but not a draw, mixed tenant base, ~2y average lease.
- Market conditions: 68 active listings in the ZIP; solid renter incomes; 801 units permitted in Hamilton County in 2024 (190 in 5+ unit buildings).
Forward outlook
- Local home prices are declining (-3.0%/yr); year-one equity from $643 of loan paydown is wiped out by about $3k of value loss. Plan a longer hold.
- At projected returns (-3.0% appreciation + 3.0% rent growth), your $26k cash investment doubles in ~9 years — after that, you're playing with house money.
Negotiation context
- It's been on market 320 days — a 12% lower offer ($82k) is reasonable based on typical stale-listing flexibility.
Risks & watch-outs
- Watch-outs: HOA is 26% of rent.
Questions for the listing agent
- It's been on market 320 days. Have you received any prior offers? Is the seller open to a 12% concession, seller financing, or rate buy-down credit?
- What does the HOA fee cover, when was the last increase, and are there any pending special assessments or reserve-fund shortfalls?
- Why hasn't it sold? Are there any deal-killer items the seller is aware of (foundation, flood, title, zoning, code violations)?
- Is there a deadline driving the sale (1031 exchange, divorce, estate, relocation)? That informs how much negotiation room exists.
- Schools are F-rated, which usually means shorter tenancies and higher turnover. Who's the typical renter profile here, and what's been the actual vacancy rate?
- What's the average days-on-market for RENTAL listings here right now (not sales)? A rising rental-DOM trend means longer vacancies and softer asking-rent achievability than the comps imply.
- What's the recent tenant-quality profile in this submarket — average credit score on applications, eviction rate, late-payment / NSF rate, and stable-employment percentage? A property-management company in the area should have these aggregated.
- How much new for-sale + rental construction is in the pipeline within 1–3 miles? Heavy new supply typically softens prices + rents 12–24 months out; constrained supply supports both.
Investment metrics
- 1% rule
- 1.92% ✓
- Cap rate
- 10.16%
- Cash-on-cash
- 13.81%
- DSCR
- 1.61
- GRM
- 4.3
CMA / ARV
No comps found within radius.
Projected returns pro-forma
-3.0% appreciation · 3.0% rent growth · sell at horizon
- IRR
- 4.3%
- Equity multiple
- 1.17×
- Total profit
- $4,329
- Equity at exit
- $13,866
- IRR
- 14.0%
- Equity multiple
- 2.14×
- Total profit
- $29,624
- Equity at exit
- $8,041
Cash invested: $26,039 (down + closing). Projections, not guarantees.
Landlord ↔ Tenant lean methodology
- Overall (STATE)
- 73 Landlord-Friendly
- State Ohio
- 73 Landlord-Friendly · R+6
- County
- — inherits STATE
- City
- — inherits STATE
ZIP-level market 45002
- Home prices YoY
- -28.9%
- Active inventory
- 68
- Price-to-rent
- 4.3×
Monthly cashflow live
- Estimated rent
- $1,788 medium interval (Pro) →
- Mortgage (P&I)
- −$488
- Tax est. 1.5%
- −$116 /mo · $1,395/yr
- Insurance
- −$39
- HOA
- −$470
- Vacancy / Maint / Mgmt
- −$375
- Net cashflow
- $300
Break-even live
UW: 25.0% down · 7.5% · 30yr · 1.5% tax · 5.0% vac · 8.0% maint · 8.0% mgmt
Financing live
Cash to close
- Down payment
- $23,249
- Closing costs
- $2,790
- Reserves months
- —
- Total cash needed
- —
Loan-product check · same deal, 3 products live
Conventional
25% down · 7.5% · 30yr
- Down + closing
- —
- Monthly P&I
- —
- Monthly cashflow
- —
- DSCR
- —
- Eligible?
- —
Personal DTI + credit; lowest rate.
DSCR
20% down · 8.5% · 30yr
- Down + closing
- —
- Monthly P&I
- —
- Monthly cashflow
- —
- DSCR
- —
- Eligible?
- —
No personal income docs; deal must DSCR.
Hard money
10% down · 12.0% · 12mo
- Down + closing
- —
- Monthly P&I
- —
- Monthly cashflow
- —
- DSCR
- —
- Eligible?
- —
Short-term bridge; refi at stabilization.
HOA detail
- Monthly dues
- $470 · $5,640/yr
- Likely covers
- water
Listing history 14 events
-
2026-06-18days on market $92,995 Active 320 DOM
-
2026-06-17days on market $92,995 Active 319 DOM
-
2026-06-16days on market $92,995 Active 318 DOM
-
2026-06-15days on market $92,995 Active 317 DOM
-
2026-06-13days on market $92,995 Active 315 DOM
-
2026-06-13days on market $92,995 Active 314 DOM
-
2026-06-09days on market $92,995 Active 311 DOM
-
2026-06-08days on market $92,995 Active 310 DOM
-
2026-06-07days on market $92,995 Active 309 DOM
-
2026-06-03days on market $92,995 Active 305 DOM
-
2026-06-02days on market $92,995 Active 304 DOM
-
2026-06-01days on market $92,995 Active 303 DOM
-
2026-05-31days on market $92,995 Active 302 DOM
-
2025-08-02$92,995 Active 580-char remark
Show marketing remark (580 chars)
Located in a quiet, rural setting, just three minutes from I-275 in southwestern Ohio near the Great Miami River, Dry Fork Pointe is a mobile home community that is near the Ohio and the I-74 Indiana border, close to recreational parks and golfing areas. New amenities include a clubhouse, playground, basketball court and a ball field and Walking/Nature Trails. Whitewater Township in Hamilton County, Ohio, offers a small-town feel with close proximity to Cincinnati. Neighborhoods include grocery and other retails stores, community center, social services as well as churches.
ⓘ Source: listings_history table (triggers on properties + properties_extension) + one-shot
backfill from property_details.listing_events for pre-trigger history.
Climate risk First Street
- Flood 2/10 Low FEMA zone X (unshaded) · 6% chance over 30 yrs
- Wildfire 1/10 Low
- Heat 4/10 Moderate 7 d/yr ≥104°F today · 19 d/yr by 30 yrs out
- Wind 2/10 Low 100% chance of damaging wind over 30 yrs
- Air quality 4/10 Moderate 3 unhealthy d/yr today · 5 by 30 yrs out
Nearby sold comps map
Loading sold comps map…
Walkable amenities ~0.75 mi
Loading nearby amenities…
Taxation est. · year 1
- Rental income
- $21,452
- − Mortgage interest
- −$5,209
- − Property taxes
- −$1,395
- − Insurance
- −$465
- − Repairs & maintenance
- −$1,716
- − Management
- −$1,716
- − HOA
- −$5,640
- − Depreciation
- −$2,705
- Taxable income
- $2,606
- Est. tax owed @ 24.0%
- −$625
- After-tax cash flow
- $2,970/yr
For passive investors: Depreciation is non-cash, so a rental often shows a tax loss while cash-flowing — sheltering income. Rental losses are passive: they offset passive income freely, and up to $25,000/yr can offset ordinary (W-2) income if you actively participate and your MAGI is under $100k (phasing out to $0 by $150k); unused losses carry forward. On sale, claimed depreciation is recaptured at up to 25%, and gains may owe capital-gains tax (a 1031 exchange can defer both). Figures are a year-1 estimate at your 24.0% rate — not tax advice; consult a CPA.
Condition & rehab AI · 5 photos
This single-family home in a quiet, rural setting is in good condition with a good condition score of 80. It has a good exterior, interior, and landscaping, and is ready for minor cosmetic updates to enhance its value.
Value-add opportunities
- Both Painting the exterior and interior walls — Fresh paint can enhance curb appeal and interior aesthetics.
- Both Updating the flooring to a more modern style — Modern flooring can improve the home's resale and rental value.
- Both Upgrading the kitchen appliances — Newer appliances can attract more buyers and renters.
- Both Adding smart home features — Smart home features can increase the home's appeal and value.
- Both Landscaping improvements — Enhanced landscaping can boost curb appeal and attract more potential buyers and renters.
Renovation cost estimate screening
Value-add ROI direction
- Both Painting the exterior and interior walls — Fresh paint can enhance curb appeal and interior aesthetics. ↑
- Both Updating the flooring to a more modern style — Modern flooring can improve the home's resale and rental value. ↑
- Both Upgrading the kitchen appliances — Newer appliances can attract more buyers and renters. ↑
- Both Adding smart home features — Smart home features can increase the home's appeal and value. ↑
- Both Landscaping improvements — Enhanced landscaping can boost curb appeal and attract more potential buyers and renters. ↑
ⓘ Cost ranges are severity-bucket heuristics (US national rule-of-thumb). Get contractor quotes + a written scope before underwriting a rehab budget.
Schools (NCES district)
- District
- Southwest Local
- NCES district ID
- 3904738
- Math proficiency
- 62% ▼ -14.00%
- Reading proficiency
- 65% ▼ -10.00%
- Median HH income
- $57,781
- Composite
- 54.72/100
- National rank
- #1321
- State rank
- #222 of 656 in OH
Livability — Hooven
- Score
- 42/100
- State rank
- #1194
- US rank
- #27069
Category grades
Schools grade is shown separately in the Schools card above.
Census & demographics
- County
- Hamilton · 838,887 people
- City population
- 436
- Metro
- Cincinnati, OH-KY-IN
- Population (ZIP)
- 14,647
- Household income
- $84,597
- Rent vs Own
- Severe rent burden
- 12.0
Population outlook (Hamilton County) Hauer SSP2
- Today (2025)
- 826,054 people
- By 2030
- 830,947 · +0.6%
- By 2040
- 832,319 · +0.8%
- By 2050
- 822,428 · -0.4%
- By 2075
- 788,688 · -4.5%
- By 2100
- 710,674 · -14.0%
Race, ethnicity, and origin ACS 2023
- Neighborhood character
- Predominantly White (93%)
- Race & ethnicity
- White 93% Two or more races 6% Hispanic / Latino 2%
- Common ancestry
- Romanian 2% Slovak 2% Italian 2%
- Foreign-born
- 1%
- Languages at home
- 98% English-only · Spanish 1%
Political lean MEDSL · Hamilton
- 2024 margin
- D (+14.9) · D 57.0% · R 42.1%
- 2008→2024 swing
- +7.9pp toward D · 2008: 7.0pp · 2024: 14.9pp
- All cycles
- 2024: D+14.9 2020: D+15.9 2016: D+9.5 2012: D+4.9 2008: D+7.0
Not yet ingested
- Civics
- —
Market trends
- HPI YoY
- ▼ -85.62%
- Current HPI
- 210.9397
- Rent YoY
- —
- Metro
- —
- State GDP YoY
- ▲ 1.98%
- F500 in state
- 48
Industry mix (Fortune 500 HQ in OH)
| Industry | F500 HQs | Revenue |
|---|---|---|
| Insurance | 3 | $145B |
|
||
| Industrial Machinery | 3 | $49B |
|
||
| Financial Services | 3 | $24B |
|
||
| Consumer Goods | 2 | $93B |
|
||
| Aerospace / Defense | 2 | $47B |
|
||
| Utilities | 2 | $33B |
|
||
Price history
1 event — show timeline
- 2025-08-02 Listed $92,995 Zillow
Cash-flow waterfall
monthlySold comps — $/sqft
last 12 mo · ≤1 miLoading sold comps…