312 E Oneil Dr · Casa Grande, AZ
Flood risk 1/10 · Minimal
- FEMA flood zone
- X (unshaded)
- Chance of flooding over 30 yrs
- 0.0%
- Est. flood insurance / yr
- $507 – $1,088
Fire risk 6/10 · Moderate
- Est. fire insurance / yr
- $610 – $1,132
Heat risk 9/10 · Severe
- Hot days now (above 113°F)
- 7 days/yr
- Hot days in 30 yrs
- 20 days/yr
Wind risk 1/10 · Minimal
- Chance of severe wind over 30 yrs
- —
Air-quality risk 2/10 · Minimal
- Unhealthy air days now
- 1 days/yr
- Unhealthy air days in 30 yrs
- 1 days/yr
Risk factors via First Street. Map © Google.
Why this score? — see what drove the C- grade
The composite is a weighted blend of 9 inputs, each scored 0–100. Each bar is that input's sub-score; the figure is the points it added to the 100-point composite (weight × sub-score).
- Cash flow +18.5/30.0
- ARV discount +7.5/15.0
- DSCR +5.8/10.0
- 1% rule +5.0/10.0
- Appreciation +5.0/10.0
- Condition / age +5.0/5.0
- Livability +2.9/5.0
- Rent growth +2.5/5.0
- Schools +1.5/10.0
$225,910
🖨 Deal sheet 📄 Offer letter ✓ Due diligence
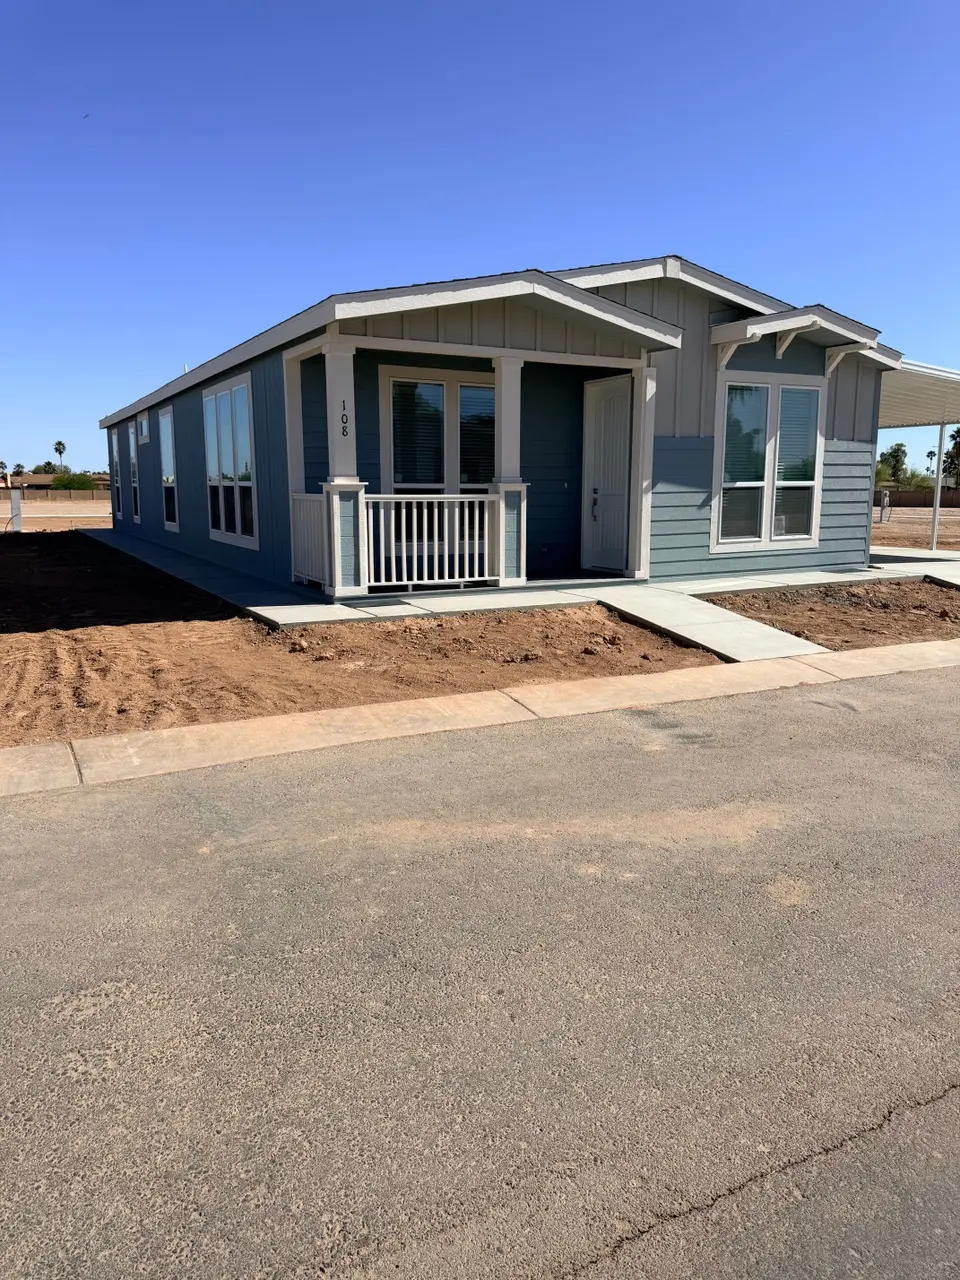
Listing remarks
Upgraded stainless steel appliances, LPV flooring throughout except master bedroom, 9 foot flat ceilings, oversized windows, oversized carport, shed and 42 upper cabinets custom blue.
Key facts
- Flat ceilings
- Lpv flooring
- Oversized carport
Tags
Property features AI
Finance
- Other: Active listing; Model/plan name: Saguaro; Spec inventory type
- Financial info: List price $225,910
Exterior
- Parking: 4 parking spaces
- Utilities: Electric heating; Heat pump; Central air conditioning
- Home design: Single-family spec home — Plan: Saguaro
- Construction: Living area 1533; Asphalt roof
- Exterior features: Asphalt roof
Interior
- Kitchen: Dishwasher; Refrigerator
- Bedrooms: 3 bedrooms
- Bathrooms: 2 full bathrooms
- Heating & cooling: Electric heating with heat pump; Central air conditioning
- Interior features: Dishwasher; Refrigerator
Neighborhood map
What this means for you Summary
Snapshot
- This is a 3-bed/2.0-bath manufactured listed at $226k. Condition is rated excellent.
Deal economics
- At list price, monthly cash flow is $217 ($3k/yr) — positive.
- The deal already cash-flows at list — no discount required.
- To meet the 1% rule (rent ≥ 1% of price), the offer needs to be $225k (0.4% below list).
- Recommended offer: $219k (3.0% below list) — sets the bar for market timing.
- Cap rate 7.4% vs local median 4.1% in Casa Grande — top-decile yield for the area; either an underpriced asset or a hidden risk that comps aren't pricing in. Stress-test before assuming the spread holds.
Location & tenants
- Location reads 58/100 on livability (#220 in AZ) — a working-class tenant base; expect higher turnover. Strengths: cost of living A+, housing A+; Watch: crime D+, employment D+, schools F.
- Casa Grande Union High School District (4453) (suburban): math 14% / reading 21% proficiency, ranked #193 of 249 in AZ (top 78%) — low school quality limits family demand, transient renter base, plan for 1-2y turnover.
- Market conditions: 1 active listings in the ZIP; 29 comparable units currently listed for rent nearby; rentals at typical pace (median 24d on market — plan ~3-4 weeks tenant-placement turnaround); 9,504 units permitted in Pinal County in 2024 (776 in 5+ unit buildings).
Forward outlook
- In year one you build about $8k of equity ($2k loan paydown + $7k appreciation (3.0% local appreciation)).
- At projected returns (3.0% appreciation + 3.0% rent growth), your $63k cash investment doubles in ~5 years — after that, you're playing with house money.
- By year 5, paydown + projected appreciation supports a ~$36k cash-out refi (75% LTV) — recoverable capital for the next deal without selling this one.
Negotiation context
- It's been on market 59 days — a 3% lower offer ($219k) is reasonable based on typical stale-listing flexibility.
Risks & watch-outs
- Climate carrying-cost: major wildfire risk; extreme-heat days projected 7→20/yr by 2055 (HVAC capex compounding) — expect insurance premiums to compound above CPI over the hold.
Questions for the listing agent
- It's been on market 59 days. Have you received any prior offers? Is the seller open to a 3% concession, seller financing, or rate buy-down credit?
- Is there a deadline driving the sale (1031 exchange, divorce, estate, relocation)? That informs how much negotiation room exists.
- Schools are F-rated, which usually means shorter tenancies and higher turnover. Who's the typical renter profile here, and what's been the actual vacancy rate?
- Crime grade is D in this area — have there been break-ins, vandalism, or insurance claims at this property in the last 3 years? What carrier currently insures it and at what premium?
- What's the average days-on-market for RENTAL listings here right now (not sales)? A rising rental-DOM trend means longer vacancies and softer asking-rent achievability than the comps imply.
- What's the recent tenant-quality profile in this submarket — average credit score on applications, eviction rate, late-payment / NSF rate, and stable-employment percentage? A property-management company in the area should have these aggregated.
- How much new for-sale + rental construction is in the pipeline within 1–3 miles? Heavy new supply typically softens prices + rents 12–24 months out; constrained supply supports both.
Investment metrics
- 1% rule
- 1.00% ✗
- Cap rate
- 7.44%
- Cash-on-cash
- 4.11%
- DSCR
- 1.18
- GRM
- 8.4
CMA / ARV
- ARV (on-the-fly)
- $105,777
- Comps found
- 12
Show comp detail 12 sales within ~0.75 mi
| Address | Dist | Beds/Ba | Sqft | Sold | Price | $/sf | Match |
|---|---|---|---|---|---|---|---|
| 312 E O'neil Dr #103 | 0.12mi | 3/2.0 | 1,344 (-12%) | 1mo | $140,000 | $104 | 73 |
| 312 E O'neil Dr #123 | 0.37mi | 2/2.0 (-1) | 1,486 (-3%) | 12mo | $189,000 | $127 | 62 |
| 312 E O'neil Dr #159 | 0.37mi | 2/2.0 (-1) | 1,486 (-3%) | 14mo | $200,000 | $135 | 61 |
| 120 W O'neil Dr #84 | 0.19mi | 2/2.0 (-1) | 1,352 (-12%) | 7mo | $70,000 | $52 | 60 |
| 450 W Sunwest Dr #98 | 0.65mi | 3/2.0 | 1,568 (+2%) | 12mo | $135,000 | $86 | 56 |
| 312 E O'neil Dr #112 | 0.37mi | 3/2.0 | 1,379 (-10%) | 14mo | $189,000 | $137 | 54 |
| 450 W Sunwest Dr #143 | 0.65mi | 2/2.0 (-1) | 1,568 (+2%) | 11mo | $75,000 | $48 | 52 |
| 450 W Sunwest Dr #68 | 0.65mi | 3/2.0 | 1,364 (-11%) | 4mo | $80,000 | $59 | 48 |
| 450 W Sunwest Dr #114 | 0.65mi | 3/2.0 | 1,328 (-13%) | 6mo | $59,000 | $44 | 42 |
| 450 W Sunwest Dr #17 | 0.65mi | 3/2.0 | 1,344 (-12%) | 11mo | $92,500 | $69 | 40 |
| 450 W Sunwest Dr #273 | 0.65mi | 2/2.0 (-1) | 1,368 (-11%) | 13mo | $89,500 | $65 | 36 |
| 450 W Sunwest Dr #149 | 0.65mi | 2/2.0 (-1) | 1,352 (-12%) | 14mo | $81,000 | $60 | 34 |
Match score weights: distance 35% · size 25% · config 20% · recency 20%. Top-matched comps best support the ARV.
Projected returns pro-forma
3.0% appreciation · 3.0% rent growth · sell at horizon
- IRR
- 11.3%
- Equity multiple
- 1.65×
- Total profit
- $41,057
- Equity at exit
- $101,579
- IRR
- 13.5%
- Equity multiple
- 3.01×
- Total profit
- $126,888
- Equity at exit
- $156,545
Cash invested: $63,255 (down + closing). Projections, not guarantees.
Landlord ↔ Tenant lean methodology
- Overall (STATE)
- 87 Strongly Landlord-Friendly
- State Arizona
- 87 Strongly Landlord-Friendly · R+3
- County
- — inherits STATE
- City
- — inherits STATE
ZIP-level market 88152
- Active inventory
- 1
- Price-to-rent
- 8.4×
Monthly cashflow live
- Estimated rent
- $2,251 high interval (Pro) →
- Mortgage (P&I)
- −$1,185
- Tax est. 1.5%
- −$282 /mo · $3,389/yr
- Insurance
- −$94
- HOA
- −$0
- Vacancy / Maint / Mgmt
- −$473
- Net cashflow
- $217
Break-even live
UW: 25.0% down · 7.5% · 30yr · 1.5% tax · 5.0% vac · 8.0% maint · 8.0% mgmt
Financing live
Cash to close
- Down payment
- $56,478
- Closing costs
- $6,777
- Reserves months
- —
- Total cash needed
- —
Loan-product check · same deal, 3 products live
Conventional
25% down · 7.5% · 30yr
- Down + closing
- —
- Monthly P&I
- —
- Monthly cashflow
- —
- DSCR
- —
- Eligible?
- —
Personal DTI + credit; lowest rate.
DSCR
20% down · 8.5% · 30yr
- Down + closing
- —
- Monthly P&I
- —
- Monthly cashflow
- —
- DSCR
- —
- Eligible?
- —
No personal income docs; deal must DSCR.
Hard money
10% down · 12.0% · 12mo
- Down + closing
- —
- Monthly P&I
- —
- Monthly cashflow
- —
- DSCR
- —
- Eligible?
- —
Short-term bridge; refi at stabilization.
Rent comps 29 comps
| Address | Beds | Baths | Sqft | Rent | $/sqft | DOM | Units | Dist |
|---|---|---|---|---|---|---|---|---|
| 1858 N Center Ave Casa Grande, AZ | 2.0 | 2.0 | 1146 | $1,500 | $1.31 | 24d | 1 | 0.25mi |
| 1846 N Princeton Ave Casa Grande, AZ | 4.0 | 2.0 | 1786 | $1,750 | $0.98 | 4d | 1 | 0.31mi |
| 1640 N Cameron St Casa Grande, AZ | 3.0 | 2.0 | 1577 | $3,250 | $2.06 | 24d | 1 | 0.42mi |
| 1640 N Cameron St Casa Grande, AZ | 3.0 | 2.0 | 1577 | $3,250 | $2.06 | 22d | 1 | 0.42mi |
| 1640 N Cameron St Unit 1640 Casa Grande, AZ | 3.0 | 2.5 | 1577 | $3,250 | $2.06 | 24d | 1 | 0.42mi |
| 1642 N Cameron St Casa Grande, AZ | 3.0 | 2.5 | 1577 | $3,250 | $2.06 | 24d | 1 | 0.42mi |
| 1775 N Terrace Cir Casa Grande, AZ | 3.0 | 2.0 | 1628 | $1,699 | $1.04 | 15d | 1 | 0.62mi |
| 1926 N Avenida de Palmas Casa Grande, AZ | 2.0 | 2.0 | 1106 | $1,199 | $1.08 | 22d | 3 | 0.71mi |
| 1584 N Wood St Casa Grande, AZ | 4.0 | 2.0 | 1928 | $1,800 | $0.93 | 15d | 1 | 0.82mi |
| 645 W Jardin Dr Casa Grande, AZ | 3.0 | 2.0 | 1309 | $1,650 | $1.26 | 24d | 1 | 0.83mi |
| 520 W Casa Mirage Ct Casa Grande, AZ | 3.0 | 2.0 | 1536 | $1,600 | $1.04 | 4d | 1 | 0.83mi |
| 1620 N Trekell Rd Casa Grande, AZ | 1.0–3.0 | 1.0–2.5 | 1090 | $2,640 | $2.42 | 1d | 1 | 0.84mi |
| 1153 E Gabrilla Dr Casa Grande, AZ | 4.0 | 2.0 | 1689 | $1,795 | $1.06 | 20d | 1 | 0.84mi |
| 541 W Melrose Dr Casa Grande, AZ | 3.0 | 2.0 | 1101 | $1,600 | $1.45 | 24d | 1 | 0.87mi |
| 1161 E O'Neil Dr Casa Grande, AZ | 2.0–4.0 | 2.0 | 1144 | $1,498 | $1.31 | 3d | 12 | 0.90mi |
| 1936 N Trekell Rd Casa Grande, AZ | 1.0–4.0 | 1.0–2.0 | 1033 | $1,723 | $1.67 | 2d | 29 | 0.91mi |
| 767 W Barrus Dr Casa Grande, AZ | 3.0 | 2.0 | 1463 | $1,695 | $1.16 | 24d | 1 | 0.94mi |
| 2094 N Sweetwater Dr Casa Grande, AZ | 3.0 | 2.0 | 1266 | $1,700 | $1.34 | 24d | 1 | 0.94mi |
| 736 W Palo Verde Dr Casa Grande, AZ | 3.0 | 2.0 | 1810 | $3,550 | $1.96 | 24d | 1 | 0.98mi |
| 1979 N Vista Ln Casa Grande, AZ | 4.0 | 2.0 | 1636 | $2,200 | $1.34 | 24d | 1 | 1.01mi |
| 803 W Jardin Dr Casa Grande, AZ | 3.0 | 2.0 | 1491 | $1,725 | $1.16 | 4d | 1 | 1.08mi |
| 1256 E Jahns Dr Casa Grande, AZ | 4.0 | 3.0 | 2094 | $2,199 | $1.05 | 5d | 1 | 1.09mi |
| 776 W Fairlane Ct Casa Grande, AZ | 3.0 | 2.0 | 1489 | $3,200 | $2.15 | 24d | 1 | 1.18mi |
| 750 W Torino Pl Casa Grande, AZ | 3.0 | 2.0 | 2007 | $3,550 | $1.77 | 24d | 1 | 1.23mi |
| 1265 E Kingman St Casa Grande, AZ | 4.0 | 2.0 | 1874 | $2,099 | $1.12 | 5d | 1 | 1.24mi |
| 845 W Crooked Stick Dr Casa Grande, AZ | 3.0 | 2.0 | 1601 | $2,000 | $1.25 | 24d | 1 | 1.26mi |
| 919 N Gilbert Ave Casa Grande, AZ | 3.0 | 2.0 | 1630 | $1,975 | $1.21 | 5d | 1 | 1.33mi |
| 1131 E Trinity Pl Casa Grande, AZ | 4.0 | 2.5 | 1600 | $1,650 | $1.03 | 24d | 1 | 1.37mi |
| 928 N Pueblo Dr Casa Grande, AZ | 3.0 | 2.0 | 1300 | $1,550 | $1.19 | 24d | 1 | 1.49mi |
Listing history 14 events
-
2026-06-18days on market $225,910 Active 59 DOM
-
2026-06-17days on market $225,910 Active 58 DOM
-
2026-06-16days on market $225,910 Active 57 DOM
-
2026-06-15days on market $225,910 Active 56 DOM
-
2026-06-13days on market $225,910 Active 54 DOM
-
2026-06-13days on market $225,910 Active 53 DOM
-
2026-06-09days on market $225,910 Active 50 DOM
-
2026-06-08days on market $225,910 Active 49 DOM
-
2026-06-07days on market $225,910 Active 48 DOM
-
2026-06-04days on market $225,910 Active 45 DOM
-
2026-06-03days on market $225,910 Active 44 DOM
-
2026-06-02days on market $225,910 Active 43 DOM
-
2026-06-01days on market $225,910 Active 42 DOM
-
2026-05-31days on market $225,910 Active 41 DOM
ⓘ Source: listings_history table (triggers on properties + properties_extension) + one-shot
backfill from property_details.listing_events for pre-trigger history.
Climate risk First Street
- Flood 1/10 Low FEMA zone X (unshaded) · 0% chance over 30 yrs
- Wildfire 6/10 Major
- Heat 9/10 Extreme 7 d/yr ≥113°F today · 20 d/yr by 30 yrs out
- Wind 1/10 Low
- Air quality 2/10 Low 1 unhealthy d/yr today · 1 by 30 yrs out
Nearby sold comps map
Loading sold comps map…
Walkable amenities ~0.75 mi
Loading nearby amenities…
Taxation est. · year 1
- Rental income
- $27,008
- − Mortgage interest
- −$12,654
- − Property taxes
- −$3,389
- − Insurance
- −$1,130
- − Repairs & maintenance
- −$2,161
- − Management
- −$2,161
- − Depreciation
- −$6,572
- Taxable loss
- −$1,058
- Est. tax savings @ 24.0%
- +$254
- After-tax cash flow
- $2,856/yr
For passive investors: Depreciation is non-cash, so a rental often shows a tax loss while cash-flowing — sheltering income. Rental losses are passive: they offset passive income freely, and up to $25,000/yr can offset ordinary (W-2) income if you actively participate and your MAGI is under $100k (phasing out to $0 by $150k); unused losses carry forward. On sale, claimed depreciation is recaptured at up to 25%, and gains may owe capital-gains tax (a 1031 exchange can defer both). Figures are a year-1 estimate at your 24.0% rate — not tax advice; consult a CPA.
Condition & rehab AI · 12 photos
This new construction home is in excellent condition with upgraded appliances and custom cabinetry. Minor updates to the exterior and landscaping would significantly enhance its resale and rental value.
Value-add opportunities
- Both Paint exterior and landscaping — Enhances curb appeal and resale value
- Both Install outdoor lighting — Improves safety and enhances curb appeal
- Both Install a front door mat — Enhances curb appeal and adds a welcoming touch
Renovation cost estimate screening
Value-add ROI direction
- Both Paint exterior and landscaping — Enhances curb appeal and resale value ↑
- Both Install outdoor lighting — Improves safety and enhances curb appeal ↑
- Both Install a front door mat — Enhances curb appeal and adds a welcoming touch ↑
ⓘ Cost ranges are severity-bucket heuristics (US national rule-of-thumb). Get contractor quotes + a written scope before underwriting a rehab budget.
Schools (NCES district)
- District
- Casa Grande Union High School District (4453)
- NCES district ID
- 0401740
- Math proficiency
- 14% ▼ -15.00%
- Reading proficiency
- 21% ▼ -10.00%
- Median HH income
- $45,373
- Composite
- 15.38/100
- National rank
- #9319
- State rank
- #193 of 249 in AZ
Livability — Casa Grande
- Score
- 58/100
- State rank
- #220
- US rank
- #21534
Category grades
Schools grade is shown separately in the Schools card above.
Census & demographics
- Census place
- Casa Grande, AZ
Population outlook (Pinal County) Hauer SSP2
- Today (2025)
- 437,574 people
- By 2030
- 446,903 · +2.1%
- By 2040
- 452,589 · +3.4%
- By 2050
- 444,126 · +1.5%
- By 2075
- 430,300 · -1.7%
- By 2100
- 393,536 · -10.1%
Not yet ingested
- Political lean
- —
- Race & ethnicity
- —
- Common origin
- —
- Civics
- —
Market trends
- HPI YoY
- —
- Current HPI
- —
- Rent YoY
- —
- Metro
- —
- State GDP YoY
- ▲ 4.54%
- F500 in state
- 20
Industry mix (Fortune 500 HQ in AZ)
| Industry | F500 HQs | Revenue |
|---|---|---|
| Technology | 2 | $13B |
|
||
| Mining / Metals | 1 | $23B |
|
||
| Environmental Services | 1 | $16B |
|
||
| Metals / Steel | 1 | $14B |
|
||
| Technology Distribution | 1 | $9B |
|
||
| Homebuilding | 1 | $8B |
|
||
Cash-flow waterfall
monthlySold comps — $/sqft
last 12 mo · ≤1 miLoading sold comps…